
Today the bullish scans returned zero. Nothing. I ran four or five and still no results. I ran the "Diamond Dog" scan and had 401 results! Therefore, I decided to present shorts today. However, I do see very oversold conditions on our indicators so a short-term rebound isn't out of the question. As I looked at all 401 results I noted that most were actually sitting on support. This is the main reason I hesitated to present shorts right now.
I decided to try and find the doggiest of the dogs. I looked for broken support levels and trends. In particular, I wanted to find those that had the most downside potential. I have three shorting opportunities and one inverse ETF.
Note that the "shorts" have stop levels that are at higher price levels and targets are listed to the downside on the weekly charts.
I was contacted by a viewer (non-subscriber) about a call I made on Cleveland-Cliffs (CLF) during an interview. I checked my prior "Diamonds in the Rough" and I haven't presented it since 2021. Quote: "What is happening I thought you said could hit 37 so I bought it and now it tanked what now?" I clearly didn't list a stop level or apparently I didn't. This is exactly why I always include stop levels--to avoid this. The bear market is brutal and as you all know, they are Diamonds in the "Rough". Be careful out there!
Good Luck & Good Trading!
Erin
(P.S. I will be sending Diamond subscribers the symbols discussed as "Diamonds of the Week" (and charts, time permitting) from Monday's DecisionPoint Shows. There will not be a show on Monday due to the holiday. The Free Trading Room will be held on Tuesday instead of Monday.)
Today's "Diamonds in the Rough": IIPR (Short), SARK, WK and XM.
Stocks to Review (ALL SHORTS): ALGN, ARVN, AVID, DOCN, FFIV, RCKT and SPR.

RECORDING LINK (6/10/2022):
Topic: DecisionPoint Diamond Mine (6/10/2022) LIVE Trading Room
Start Time: Jun 10, 2022 09:00 AM
Meeting Recording Link
Access Passcode: June$10th
REGISTRATION FOR Friday 6/17 Diamond Mine:
When: Jun 17, 2022 09:00 AM Pacific Time (US and Canada)
Topic: DecisionPoint Diamond Mine (6/17/2022) LIVE Trading Room
Register in advance for this webinar HERE
Save the registration confirmation email with login instructions in case Zoom doesn't notify you in time.

Free DP Trading Room (6/13/2022) RECORDING LINK:
Topic: DecisionPoint Trading Room
Start Time: Jun 13, 2022 09:01 AM
Meeting Recording Link
Access Passcode: June@13th
For best results, copy and paste the access code to avoid typos.
Welcome to DecisionPoint Daily Diamonds, wherein I highlight ten "Diamonds in the Rough" per week. These are selected from the results of my DecisionPoint Scans, which search for stocks that could benefit from the trend and condition of the market. Remember, these are not recommendations to buy or sell, but are the most interesting of the stocks that surfaced in my scans. My objective is to save you the work of the initial, tedious culling process, but you need to apply your own analysis to see if these stocks pique your interest as well. There are no guaranteed winners here!
"Predefined Scans Triggered" are taken from StockCharts.com using the "Symbol Summary" option instead of a "SharpChart" on the workbench.
Innovative Industrial Properties, Inc. (IIPR)
EARNINGS: 8/3/2022 (AMC)
Innovative Industrial Properties, Inc. is a real estate investment trust, which engages in the acquisition, ownership, and management of industrial properties. It operates through the following geographical segments: Arizona, California, Colorado, Florida, Illinois, Maryland, Massachusetts, Michigan, Minnesota, Missouri, Nevada, New Jersey, New York, North Dakota, Ohio, Pennsylvania, Texas, Virginia and Washington. The firm's property portfolio includes PharmaCann, Inc., SH Parent, Inc., Ascend Wellness Holdings, Inc., Cresco Labs Inc., and Kings Garden Inc. The company was founded by Alan D. Gold and Paul E. Smithers on June 15, 2016 and is headquartered in Park City, UT.
Predefined Scans Triggered: New 52-week Lows and P&F Double Bottom Breakout.
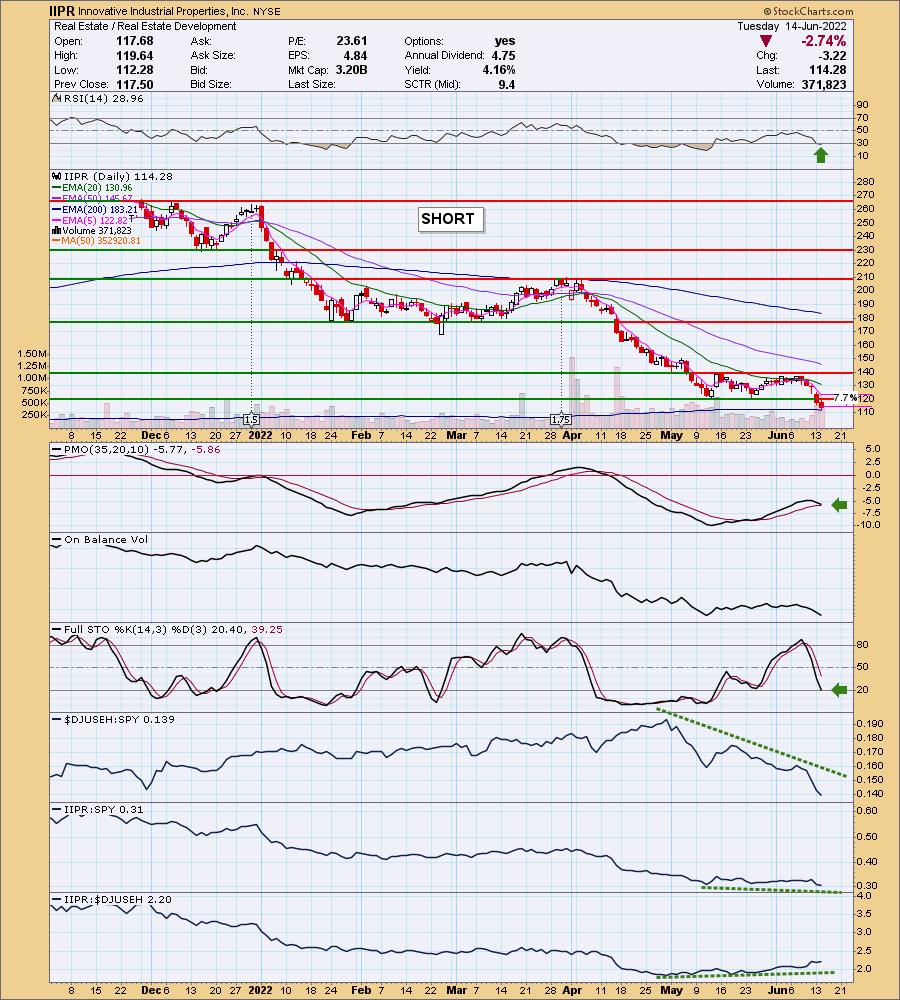
IIPR is down -0.46% in after hours trading. I covered this one on the buy side on March 16th 2021. Obviously the stop was hit on it. Short-term support was broken yesterday and the decline continued today. The RSI is oversold, but notice that it spent over a month in oversold territory as the devastation continued. Now we have a PMO SELL signal on tap with the PMO topping well beneath the zero line. Stochastics are negative and falling. Volume has been high to the downside, but notice the OBV isn't making a new low right now. That tells me there are more sellers available. The group is completely underperforming the SPY in a big way and IIPR tends to follow its lead. The stop is above the broken support level.
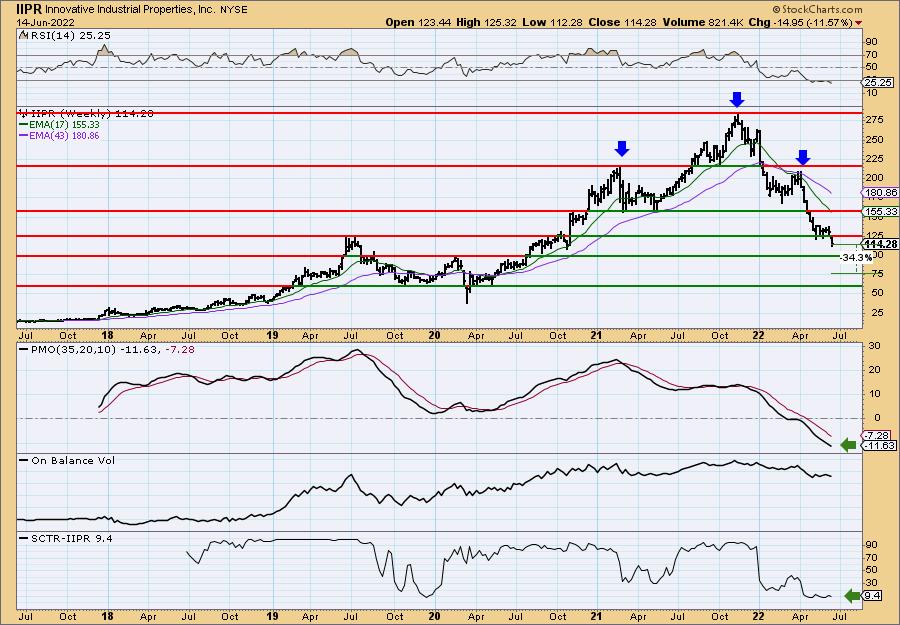
This stock had already broken below major support at the 2021 lows and now it has broken support at the 2019 highs. I haven't annotated it, but even if it just reaches the next level of support it would be a 14%+ downside gain. The weekly PMO is falling and not decelerating. The SCTR is in the basement. I actually can make out a head and shoulders pattern. The downside target of the pattern would take price to the lowest support level at about $50. Ugly.
Tuttle Capital Short Innovation ETF (SARK)
EARNINGS: N/A
SARK is an actively-managed fund that seeks to achieve -1x the return, for a single day, of the ARK Innovation ETF (ARKK) through swap agreements with major global financial institutions. For more information click here.
Predefined Scans Triggered: Hollow Red Candles, P&F Double Top Breakout and P&F Bearish Signal Reversal.
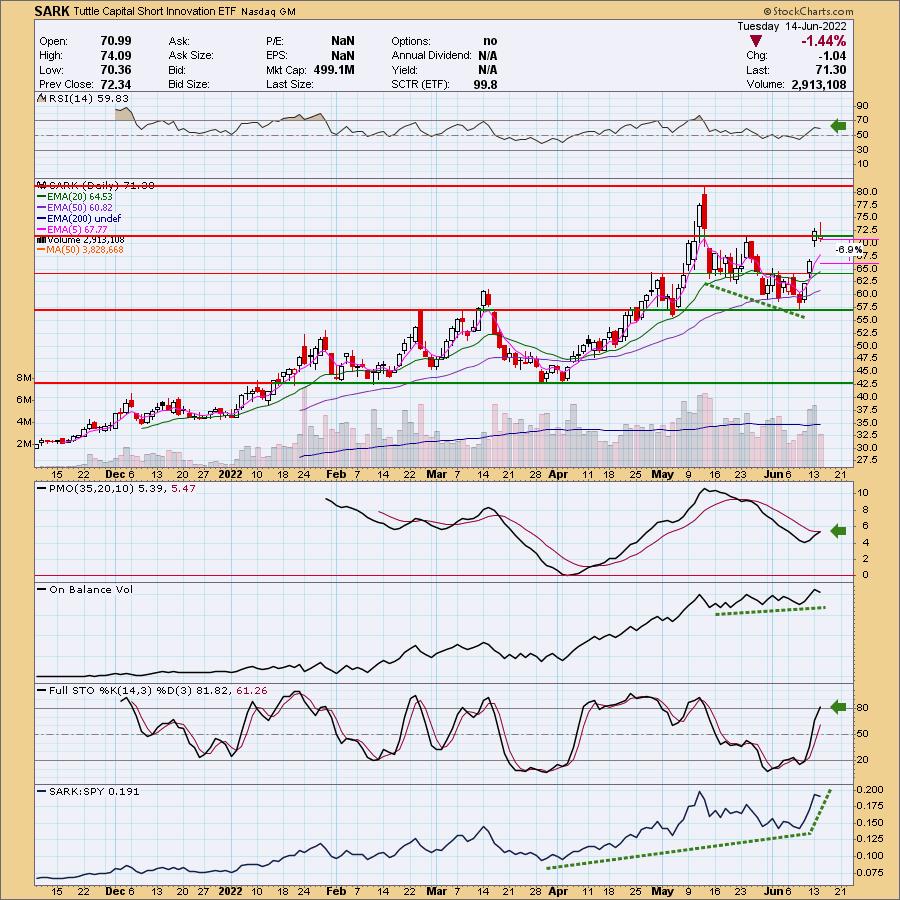
SARK is down -0.56% in after hours trading. This one could be great or could be terrible depending on whether the market gives us an oversold reversal. This could actually be a reverse island formation which would imply a gap down ahead. Time your entry carefully. I believe the bear market isn't going anywhere and this fund is likely to do well as Cathie Woods' ARKK fund languishes, but a quick bear market rally will make this ETF a bad choice.
There's plenty to like on the chart's technicals. Price broke out of a bullish falling wedge and has formed a large flag formation out of the April low. The RSI is positive and the PMO is nearing a crossover BUY signal. We have a strong OBV positive divergence that led into this rally so it should be sustainable. Stochastics just moved above 80. Not surprisingly this has been performing very well against the SPY. The stop is set below gap support.
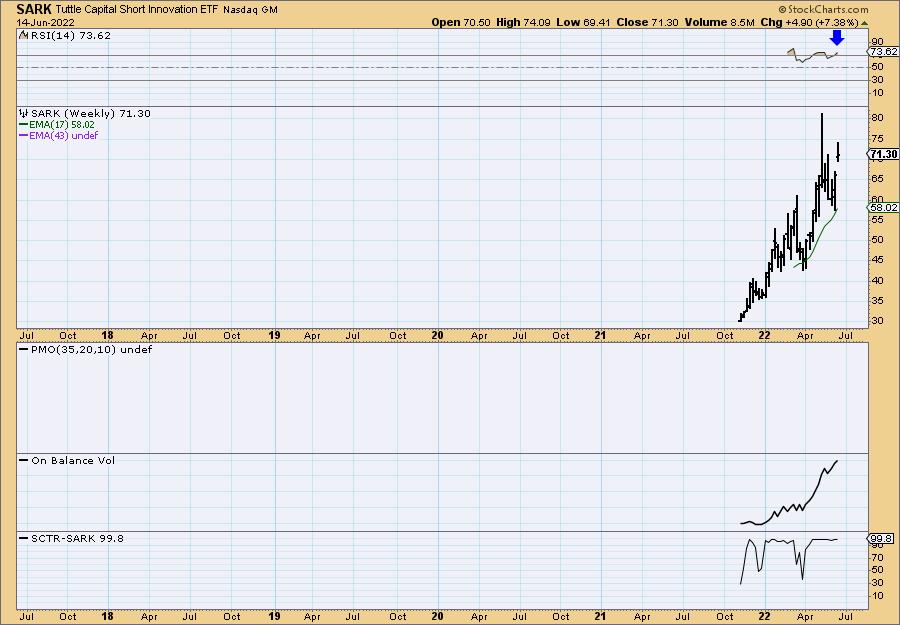
Not much on the weekly chart except to say the RSI is overbought. We also see a strong increase in volume that confirms the current rising trend. The SCTR is outstanding at 99.8.
Workiva Inc. (WK)
EARNINGS: 8/2/2022 (AMC)
Workiva, Inc. engages in the provision of cloud-based compliance and regulatory reporting solutions that are designed to solve business challenges at the intersection of data, process and people. Its platform, Wdesk, offers controlled collaboration, data linking, data integrations, granular permissions, process management and a full audit trail. The company was founded by Matthew M. Rizai, Jerome M. Behar, Martin J. Vanderploeg, Joseph H. Howell, Jeff Trom and Daniel J. Murray in August 2008 and is headquartered in Ames, IA.
Predefined Scans Triggered: P&F Spread Triple Bottom Breakdown, New 52-week Lows and P&F Double Bottom Breakout.
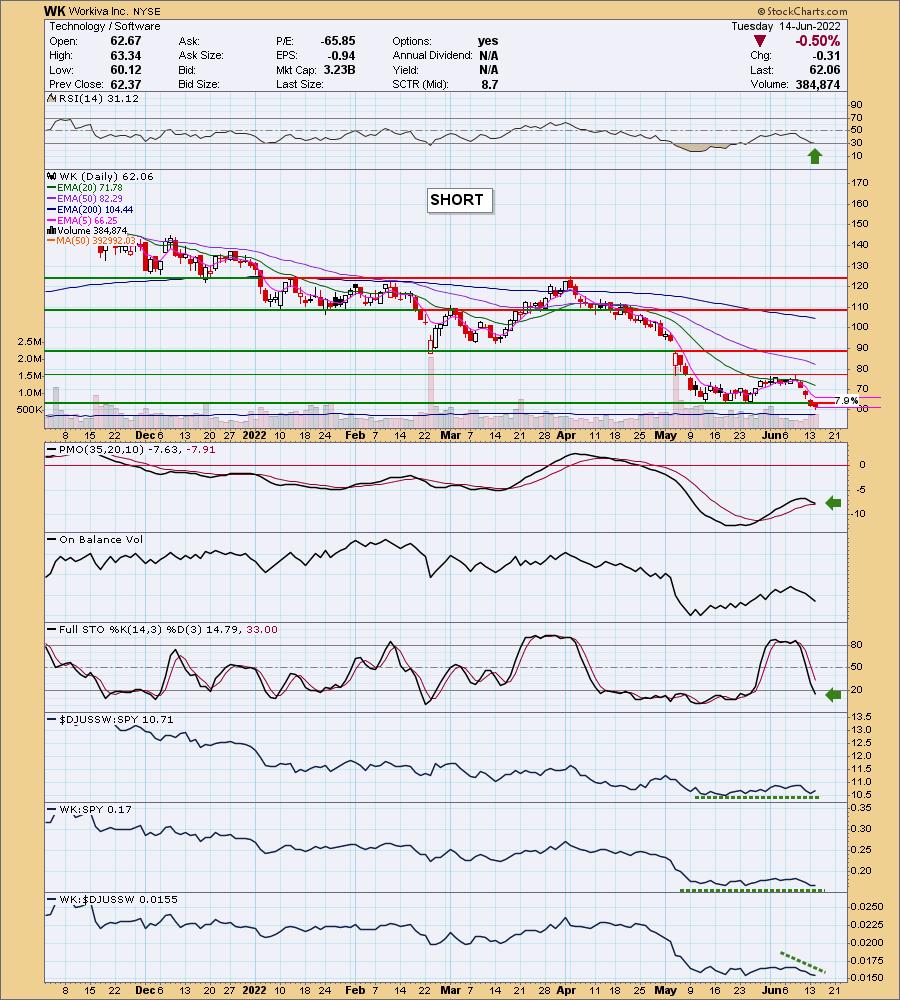
WK is unchanged in after hours trading. As noted with the scans triggered, this one is making new 52-week lows. Today it broke short-term support leading us to look at the weekly chart to find support levels. The RSI is negative, only a tiny bit oversold. In May WK was oversold nearly all month. The PMO has topped well beneath the zero line and should trigger a crossover SELL signal shortly. The OBV hasn't moved to its lows which suggests sellers are still available. Stochastics are below 20 and relative performance is somewhat weak given it is traveling in line with the SPY. The stop level is set above the last support level.
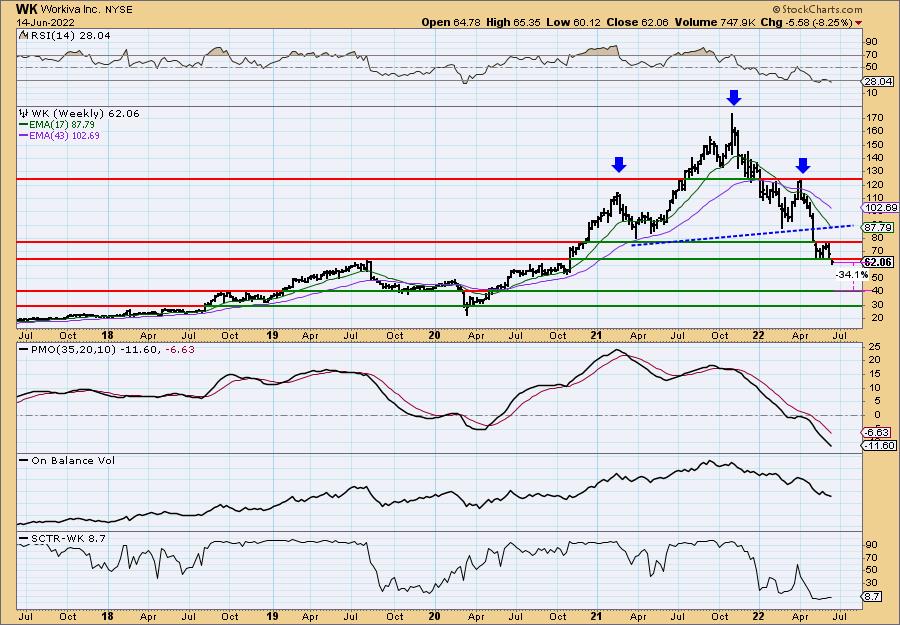
We have another large bearish head and shoulders pattern on a weekly chart. The minimum downside target would bring price down to zero, so obviously that isn't likely. However, the next strong support level is about 34% away. The weekly RSI is oversold and that has signaled higher prices, but that was out of the 2020 bear market low. The weekly PMO is pushing downward. The OBV is confirming the decline and the SCTR is a pitiful 8.7.
Qualtrics International Inc. (XM)
EARNINGS: 7/19/2022 (AMC)
Qualtrics International, Inc. operates as an experience management platform to manage customer, employee, product, and brand experiences. It operates through the following segments: CustomerXM, EmployeeXM, ProductXM and BrandXM. The CustomerXM includes a system of action that enables organizations to gain understanding across all channels that impact the customer experience and surfaces these insights in real-time to drive improvements. The EmployeeXM allows organizations to draw insights from their employees and improve experience during the employment lifecycle. The ProductXM includes design products people love, decrease time to market, and increase share of wallet by uncovering and acting on user needs, desires, and expectations. The BrandXM includes create a bedrock of loyal followers, acquire new customers, and increase market share by ensuring that brand resonates at each critical touchpoint and attracts target buyers. The company was founded by Scott M. Smith, Ryan Smith, and Jared Smith in 2002 and is headquartered in Provo, UT.
Predefined Scans Triggered: P&F Descending Triple Bottom Breakdown, New 52-week Lows and P&F Double Bottom Breakout.
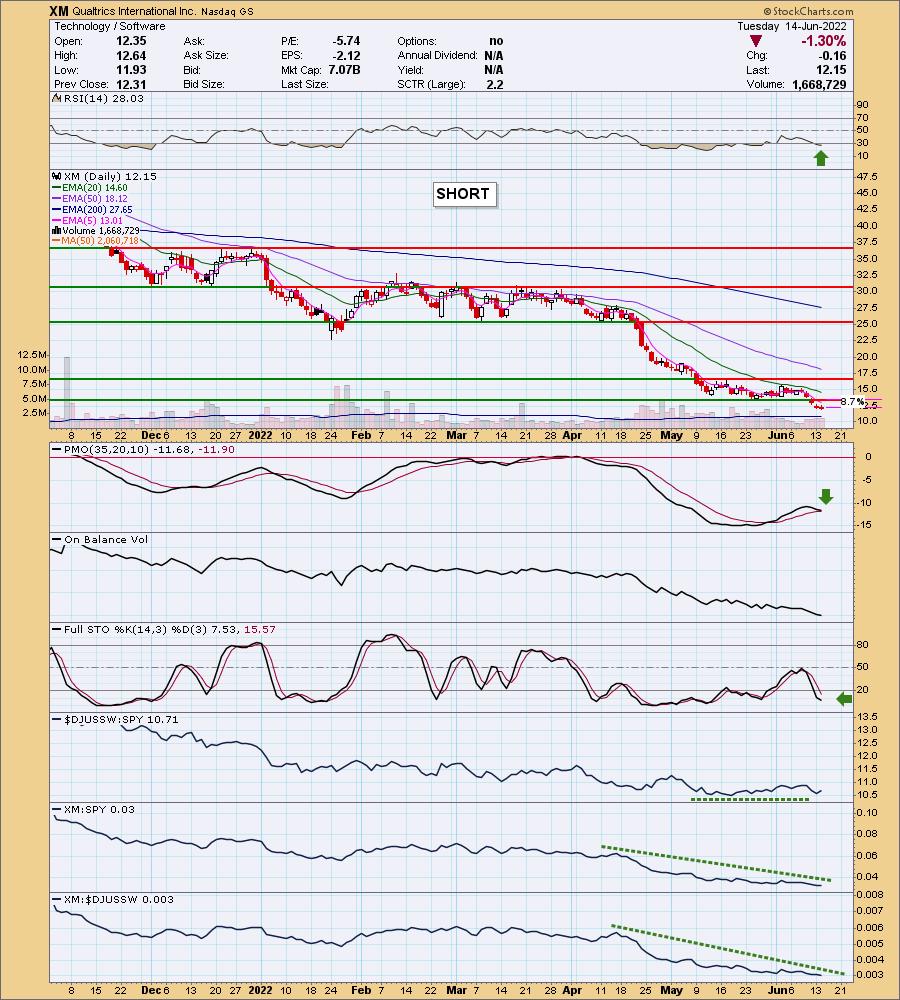
XM is of course up +1.65% in after hours trading which isn't great for a short. It does offer a better entry if it moves higher tomorrow which means a tighter stop. The RSI is oversold, but like the other "dogs", it can do that for long periods of time. Short-term support was lost yesterday. The PMO is as ugly as the others, topping below the zero line and about to trigger a crossover SELL signal. Stochastics are below 20. The group has been performing about as well as the SPY. XM is overall underperforming both the group and consequently the SPY. The OBV is confirming the decline. The upside stop is set above prior support.
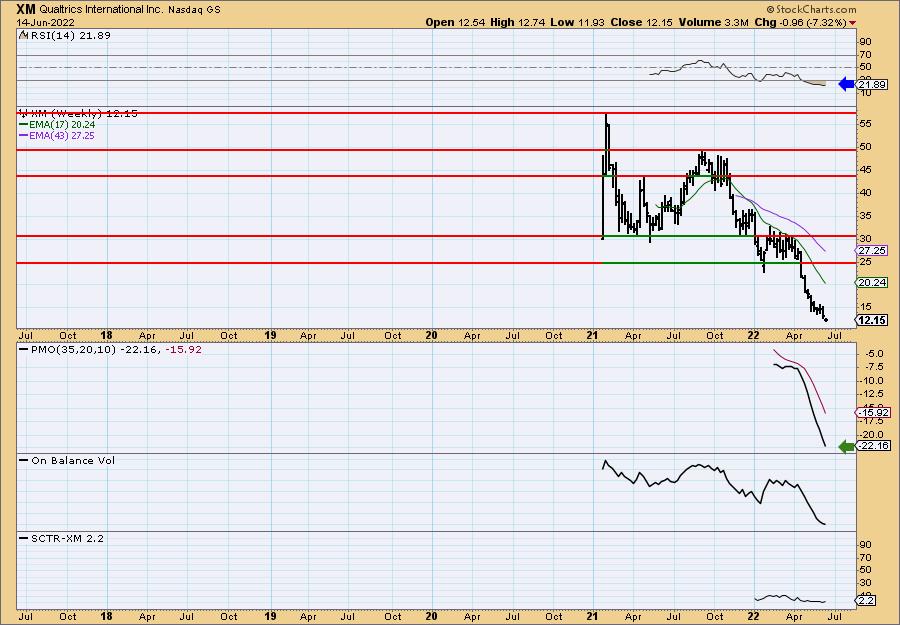
Not much on the weekly chart except to say there is no support available. The weekly RSI is oversold, but still trying to fall. The weekly PMO is ugly with no positive readings since the PMO started being calculated. Downside target to consider would be 17% around $10.08.
Don't forget, on Thursdays I look at reader-requested symbols, click HERE to send me an email. I read every email I receive and try to answer them all!
Current Market Outlook:
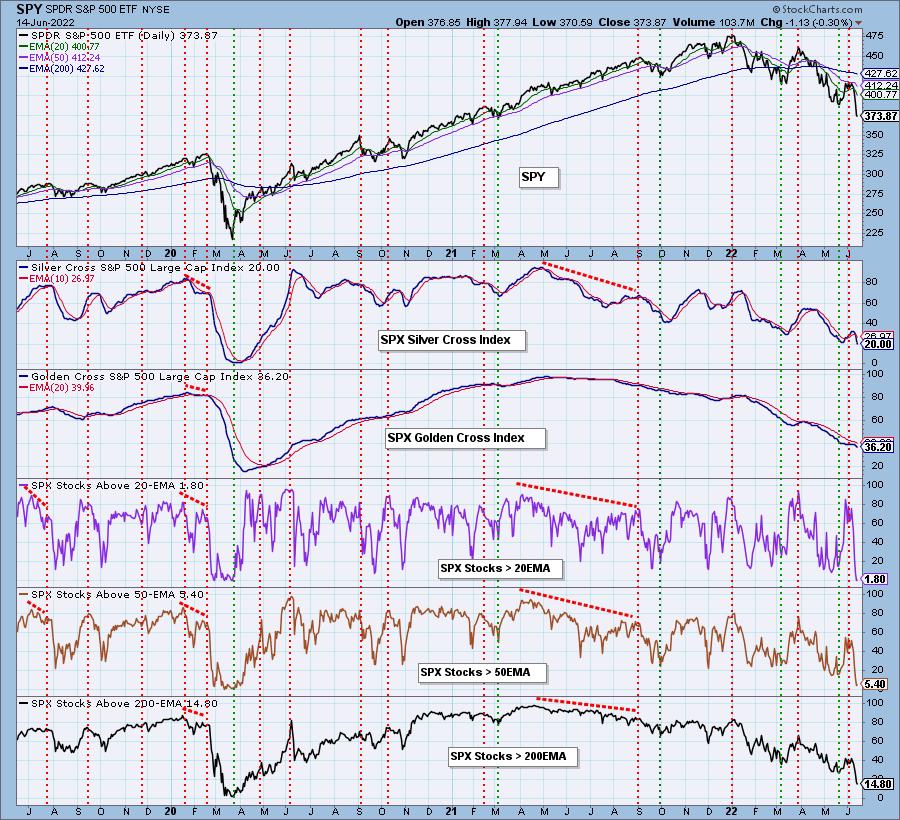
Market Environment: It is important to consider the odds for success by assessing the market tides. The following chart uses different methodologies for objectively showing the depth and trend of participation for intermediate- and long-term time frames.
- The Silver Cross Index (SCI) shows the percentage of SPX stocks on IT Trend Model BUY signals (20-EMA > 50-EMA)
- The Golden Cross Index (GCI) shows the percentage of SPX stocks on LT Trend Model BUY signals (50-EMA > 200-EMA)
Don't forget that as a "Diamonds" member, you have access to our GCI/SCI curated ChartList on DecisionPoint.com. You'll find it under "Members Only" links on the left side on the Blogs and Links Page.
Here is the current chart:
Full Disclosure: I'm 20% exposed with 10% hedge. I am holding primarily Energy and Gold.
I'm required to disclose if I currently own a stock I mention and/or may buy/short it within the next 72 hours.
"Technical Analysis is a windsock, not a crystal ball." - Carl Swenlin
(c) Copyright 2022 DecisionPoint.com
Watch the latest episode of DecisionPoint with Carl & Erin Swenlin on Mondays 7:00p EST or on the DecisionPoint playlist on the StockCharts TV YouTube channel here!
NOTE: The stocks reported herein are from mechanical trading model scans that are based upon moving average relationships, momentum and volume. DecisionPoint analysis is then applied to get five selections from the scans. The selections given should prompt readers to do a chart review using their own analysis process. This letter is not a call for a specific action to buy, sell or short any of the stocks provided. There are NO sure things or guaranteed returns on the daily selection of "Diamonds in the Rough."
Helpful DecisionPoint Links:
DecisionPoint Shared ChartList and DecisionPoint Chart Gallery
Price Momentum Oscillator (PMO)
Swenlin Trading Oscillators (STO-B and STO-V)
For more links, go to DecisionPoint.com