
I had a feeling the market might rebound today; I said as much in yesterday's opening. Given the Fed rate hike didn't upset the apple cart, I would guess we will see a bit more rally.
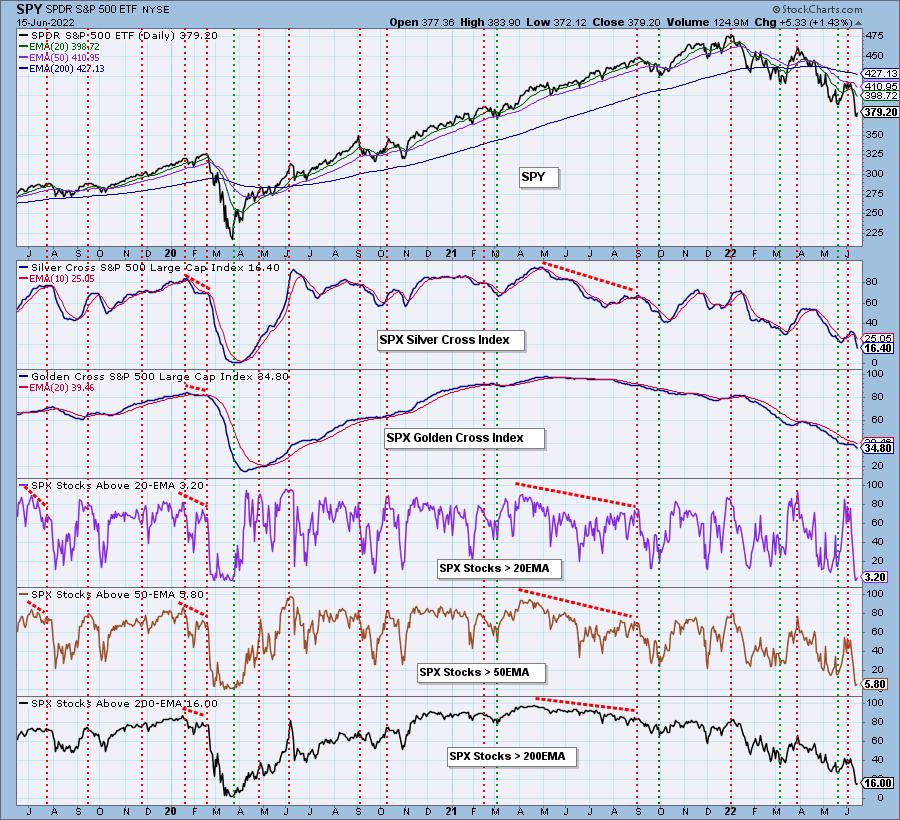
I again had no scan results on my primary scans. What I realized is that with the Golden Cross Index and Silver Cross Index being so low, there weren't that many stocks out there that have a bullish EMA configuration (fastest on top and slowest on the bottom). I decided to take out the code that required a 20-day EMA > 50-day EMA and a 50-day EMA > 200-day EMA. That expanded my results, but it was still difficult to find the right setups. I think today's charts are pretty good, but personally I prefer to remain mostly in cash.
Good Luck & Good Trading!
Erin
Note: I will be sending Diamond subscribers the symbols discussed as "Diamonds of the Week" (and charts, time permitting) from Monday's DecisionPoint Shows. There will not be a show on Monday due to the holiday. The Free Trading Room will be held on Tuesday instead of Monday.)
Today's "Diamonds in the Rough": ALHC, DPZ, DRE and GKOS.

RECORDING LINK (6/10/2022):
Topic: DecisionPoint Diamond Mine (6/10/2022) LIVE Trading Room
Start Time: Jun 10, 2022 09:00 AM
Meeting Recording Link
Access Passcode: June$10th
REGISTRATION FOR Friday 6/17 Diamond Mine:
When: Jun 17, 2022 09:00 AM Pacific Time (US and Canada)
Topic: DecisionPoint Diamond Mine (6/17/2022) LIVE Trading Room
Register in advance for this webinar HERE
Save the registration confirmation email with login instructions in case Zoom doesn't notify you in time.

Free DP Trading Room (6/13/2022) RECORDING LINK:
Topic: DecisionPoint Trading Room
Start Time: Jun 13, 2022 09:01 AM
Meeting Recording Link
Access Passcode: June@13th
For best results, copy and paste the access code to avoid typos.
Welcome to DecisionPoint Daily Diamonds, wherein I highlight ten "Diamonds in the Rough" per week. These are selected from the results of my DecisionPoint Scans, which search for stocks that could benefit from the trend and condition of the market. Remember, these are not recommendations to buy or sell, but are the most interesting of the stocks that surfaced in my scans. My objective is to save you the work of the initial, tedious culling process, but you need to apply your own analysis to see if these stocks pique your interest as well. There are no guaranteed winners here!
"Predefined Scans Triggered" are taken from StockCharts.com using the "Symbol Summary" option instead of a "SharpChart" on the workbench.
Alignment Healthcare Inc. (ALHC)
EARNINGS: 8/4/2022 (AMC)
Alignment Healthcare, Inc. operates as holding company. The company offers consumer-centric platform that delivers customized health care solutions to seniors and those who need it most, the chronically ill and frail, through its Medicare Advantage plans. The firm offers health plan options through Alignment Health Plan, and also partners with select health plans to help deliver better benefits at lower costs. The company was founded in 2013 and is headquartered Orange, CA.
Predefined Scans Triggered: New CCI Buy Signals, Stocks in a New Uptrend (ADX), Moved Above Upper Price Channel and Parabolic SAR Buy Signals.
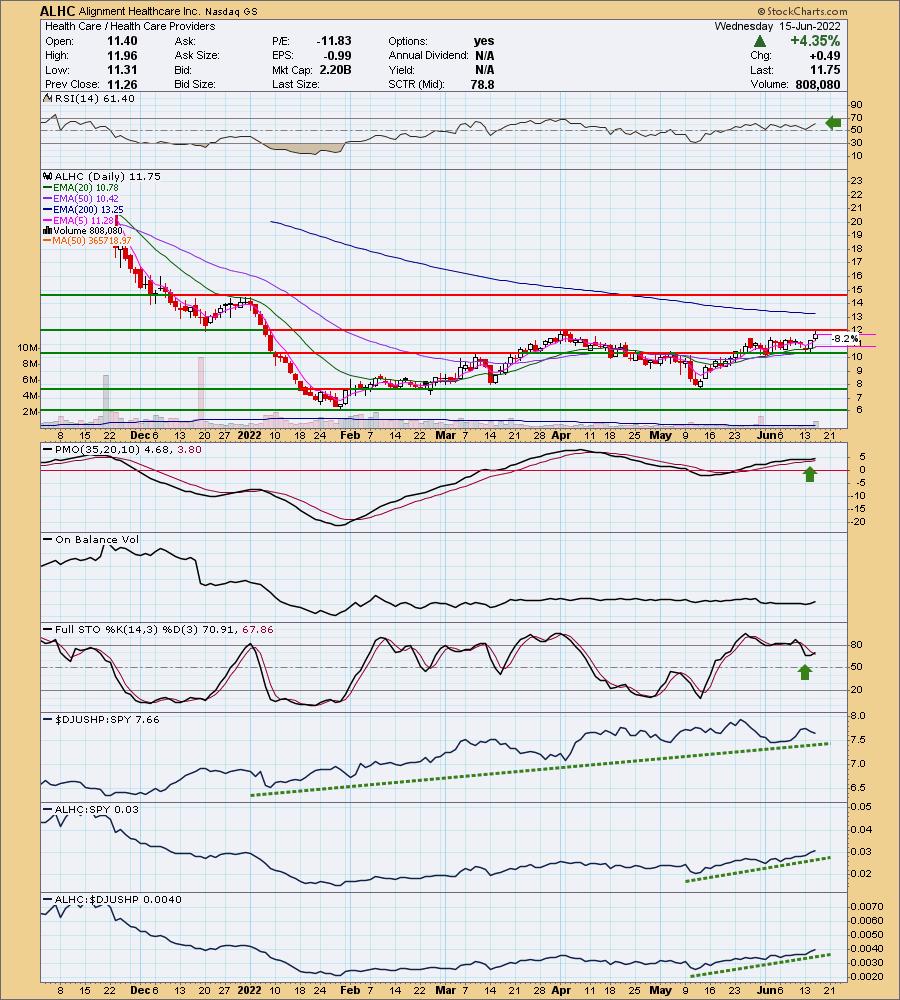
ALHC is down -1.96% in after hours trading which could offer a better buy point or take this trade off the table. It makes sense that a pullback might be necessary given it broke above very short-term resistance above the June trading range and is now up against strong resistance at December trough and April high. The technicals are sound right now with the RSI staying in positive territory and not overbought, the PMO turning up above its signal line, and Stochastics turning up and crossing above the signal line. Relative strength is good in the long term for the industry group. ALHC is increasing its outperformance of the group and the SPY. The stop is set at the 20-day EMA.
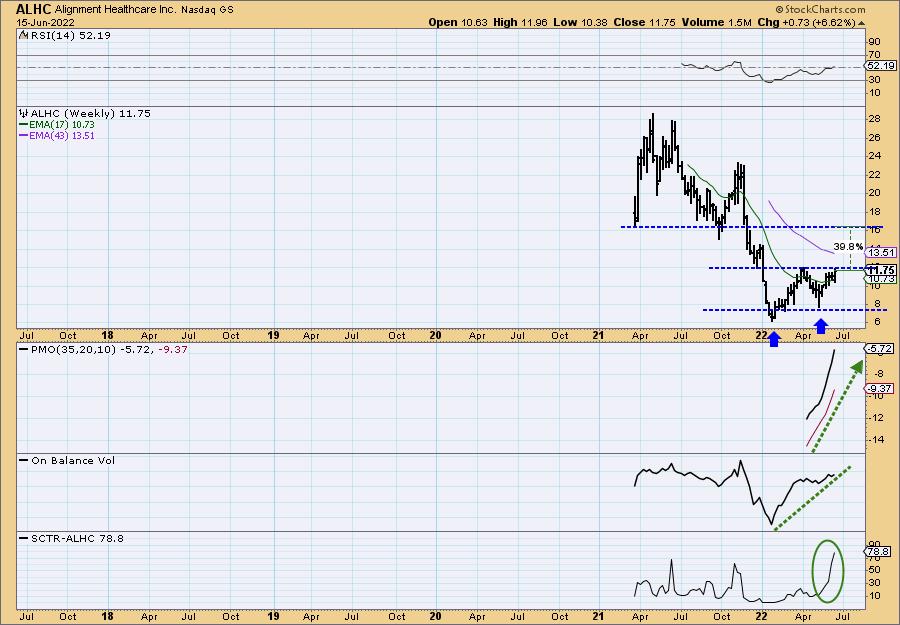
The weekly chart doesn't have a lot of data, but we do see a weekly RSI that is rising and just hit positive territory. There is a possible double-bottom pattern that would be confirmed on a breakout. The minimum upside target (conservatively) is at overhead resistance at $16. The PMO is rising strongly and the OBV is confirming the current rising trend.
Domino's Pizza Group LTD (DPZ)
EARNINGS: 7/21/2022 (BMO)
Domino's Pizza, Inc. engages in the management of a network of company-owned and franchise-owned pizza stores. It operates through the following segments: U.S. Stores, International Franchise, and Supply Chain. The U.S. Stores segment consists primarily of franchise operations. The International Franchise segment comprises a network of franchised stores. The Supply Chain segment manages regional dough manufacturing and food supply chain centers. The company was founded by James Monaghan and Thomas Stephen Monaghan in 1960 and is headquartered in Ann Arbor, MI.
Predefined Scans Triggered: None.
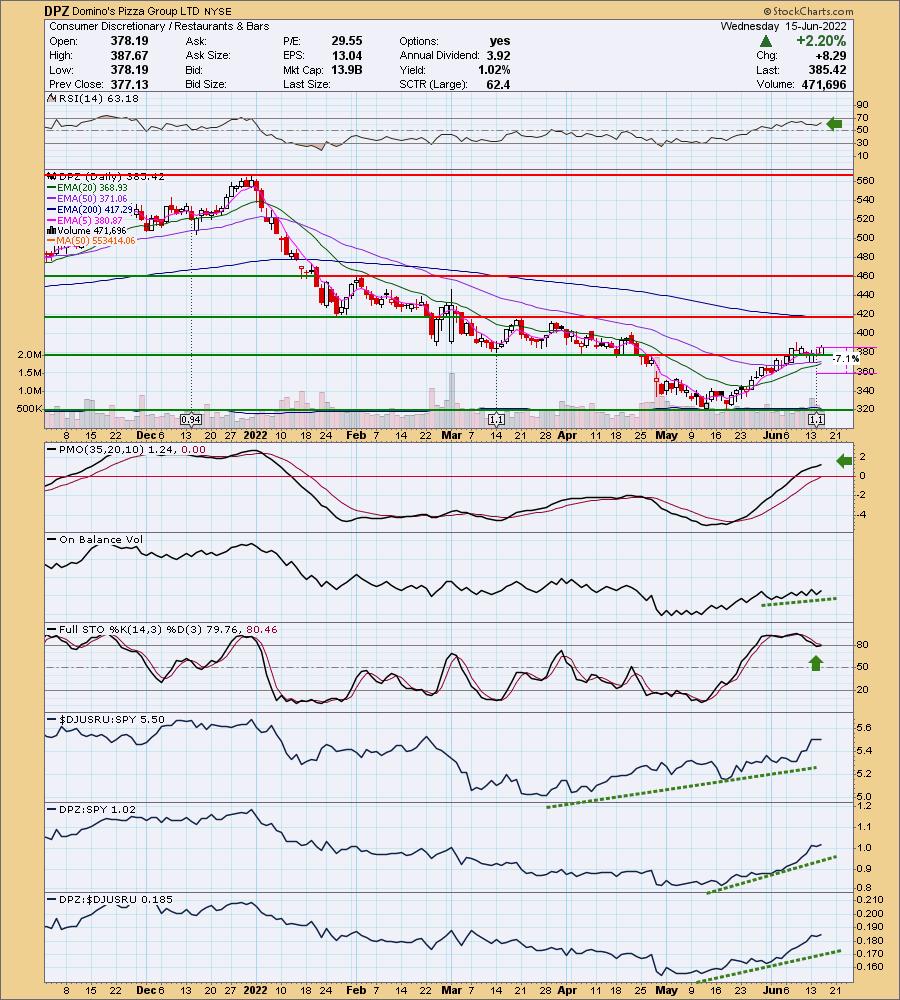
DPZ is up +0.02% in after hours trading. I covered DPZ in the June 2nd 2020 issue of DP Diamonds. The stop was hit after a gain of 13%+ later that year. I didn't annotate it, but I see a bull flag that formed out of the May low. This looks like a breakout from that tiny flag. This is occurring just above the 20/50-day EMAs which means a likely "silver cross" (20-day EMA moves above 50-day EMA) buy signal by week's end. The RSI is positive and not overbought. The PMO is beginning to accelerate higher and is not overbought. The OBV continues to rise even when the flag was formed. Stochastics have turned up just above 80 and relative strength is very good across the board. The stop is set below the 20/50-day EMAs and below current support.
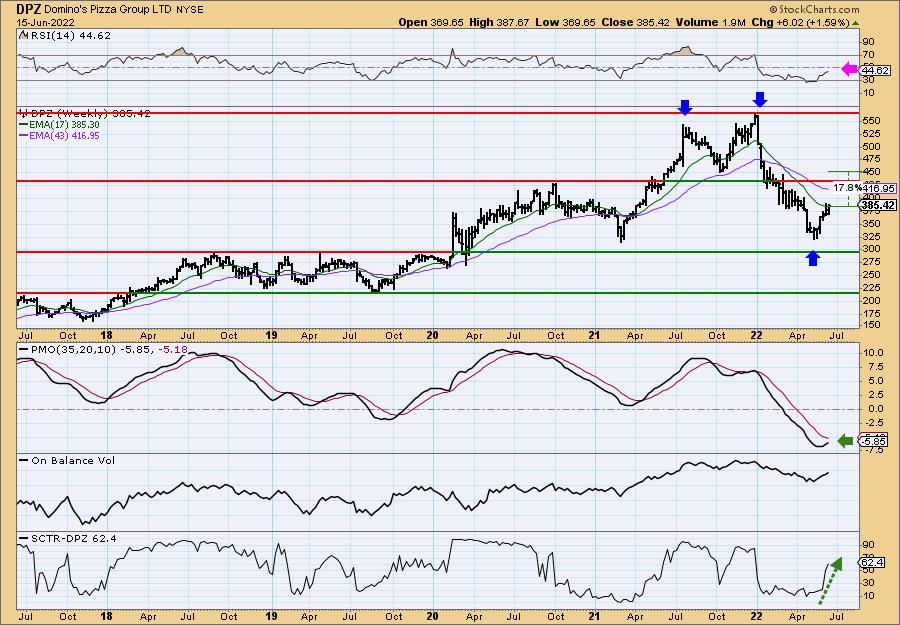
The weekly chart looks good. After fulfilling the downside target of the bearish double-top, price is now rebounding off strong support. The weekly RSI is rising, but still remains in negative territory. The weekly PMO looks excellent as it bottoms and goes in for a crossover BUY signal. The SCTR has been increasing quickly. If price just reaches the October low, that would be about a 17% gain.
Duke Realty Corp. (DRE)
EARNINGS: 7/27/2022 (AMC)
Duke Realty Corp. operates as a real estate development company, which specializes in the ownership, management and development of industrial and medical office properties. It offers property and asset management, leasing, construction and other tenant related services. Its diversified portfolio of rental properties encompasses various business houses such as government services, manufacturing, retailing, wholesale trade, distribution, healthcare and professional services. The firm operates its business through the following segments: Industrial Properties, Medical Office Properties, and Service Operations. The Industrial Properties segment offers warehousing facilities and light industrial buildings. The Service Operations segment provides real estate services such as property management, asset management, maintenance, leasing, development, general contracting and construction management to third-party property owners and joint ventures. The company was founded by John Stoddard Rosebrough, Phillip R. Duke, and John W. Wynne in 1972 and is headquartered in Indianapolis, IN.
Predefined Scans Triggered: Elder Bar Turned Green.
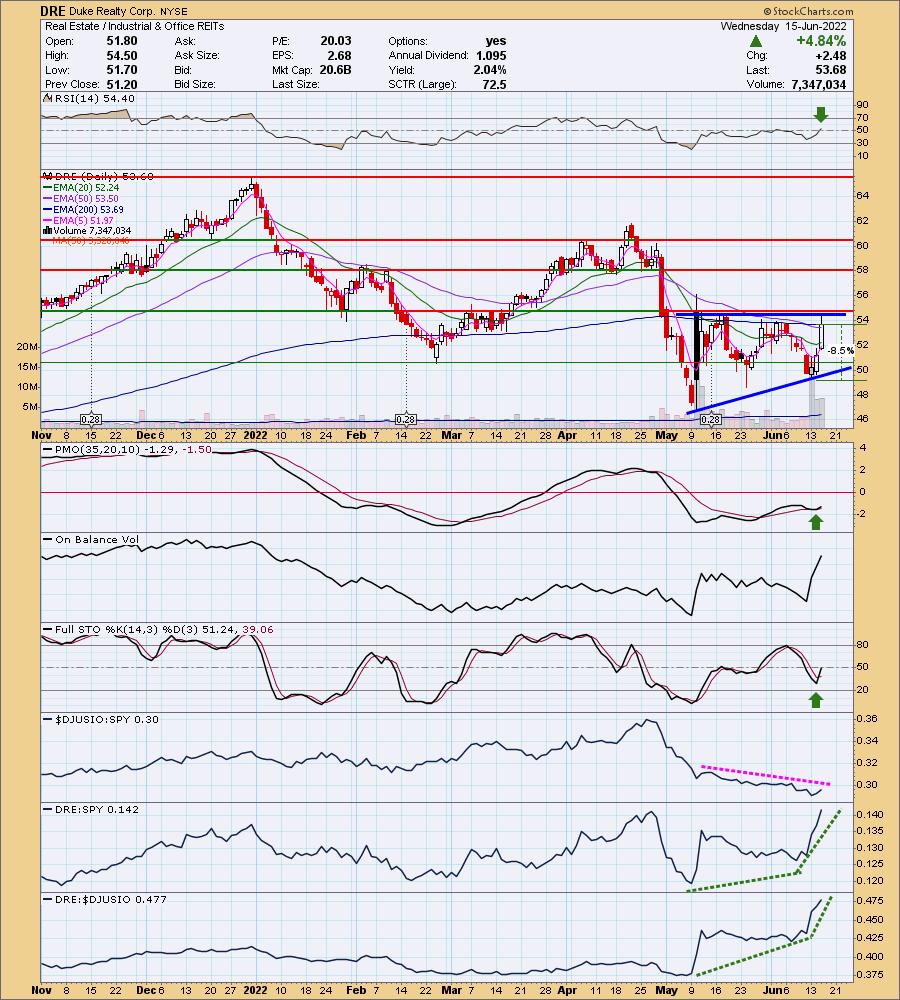
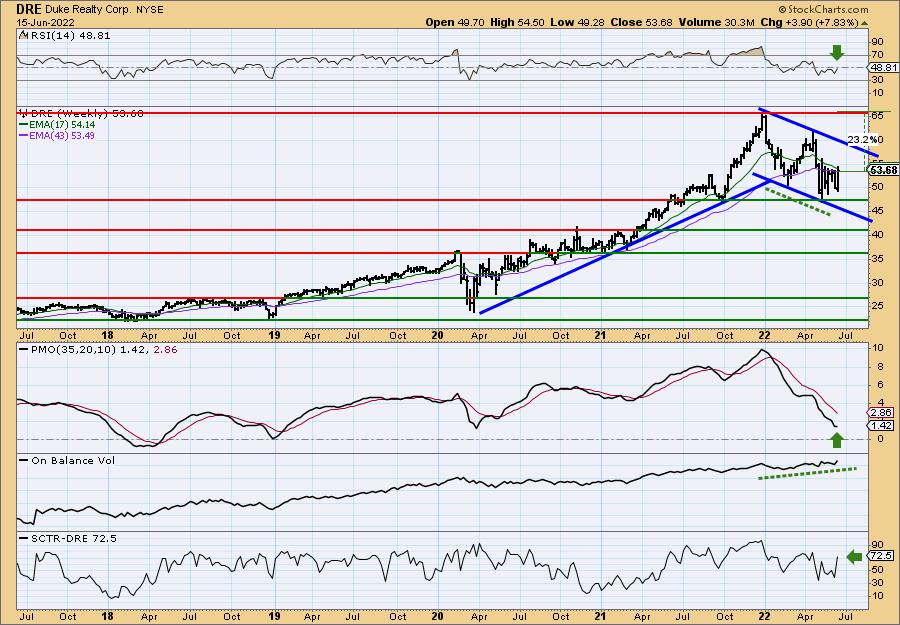
DRE is unchanged in after hours trading. I covered in the July 15th 2021 Diamonds Report. The position is still open and is currently up +6.72%. At its peak in December, it was up over 31%. The Real Estate sector has had a tough time of it with interest rates on the rise. You can see that this industry group is struggling against the SPY. However, this one continues to increase its relative strength. The RSI just turned positive. Stochastics have turned up. There is a bullish ascending triangle (flat top, rising bottoms) that implies an upside breakout ahead. The PMO has reversed back into a crossover BUY signal and volume has been crazy on the buy side. It's reflected in the vertical OBV. The stop is set below the last price bottom.
We have another large bearish head and shoulders pattern on a weekly chart. The minimum downside target would bring price down to zero, so obviously that isn't likely. However, the next strong support level is about 34% away. The weekly RSI is oversold and that has signaled higher prices, but that was out of the 2020 bear market low. The weekly PMO is pushing downward. The OBV is confirming the decline and the SCTR is a pitiful 8.7.
Glaukos Corp. (GKOS)
EARNINGS: 8/4/2022 (AMC)
Glaukos Corp. is an ophthalmic medical technology and pharmaceutical company, which focuses on novel therapies for the treatment of glaucoma, corneal disorders and retinal diseases. It engages in development and commercialization of therapies across several end markets within ophthalmology. The company was founded by Olav B. Bergheim, Morteza Gharib, and Richard Hill on July 14, 1998 and is headquartered in San Clemente, CA.
Predefined Scans Triggered: Elder Bar Turned Blue.
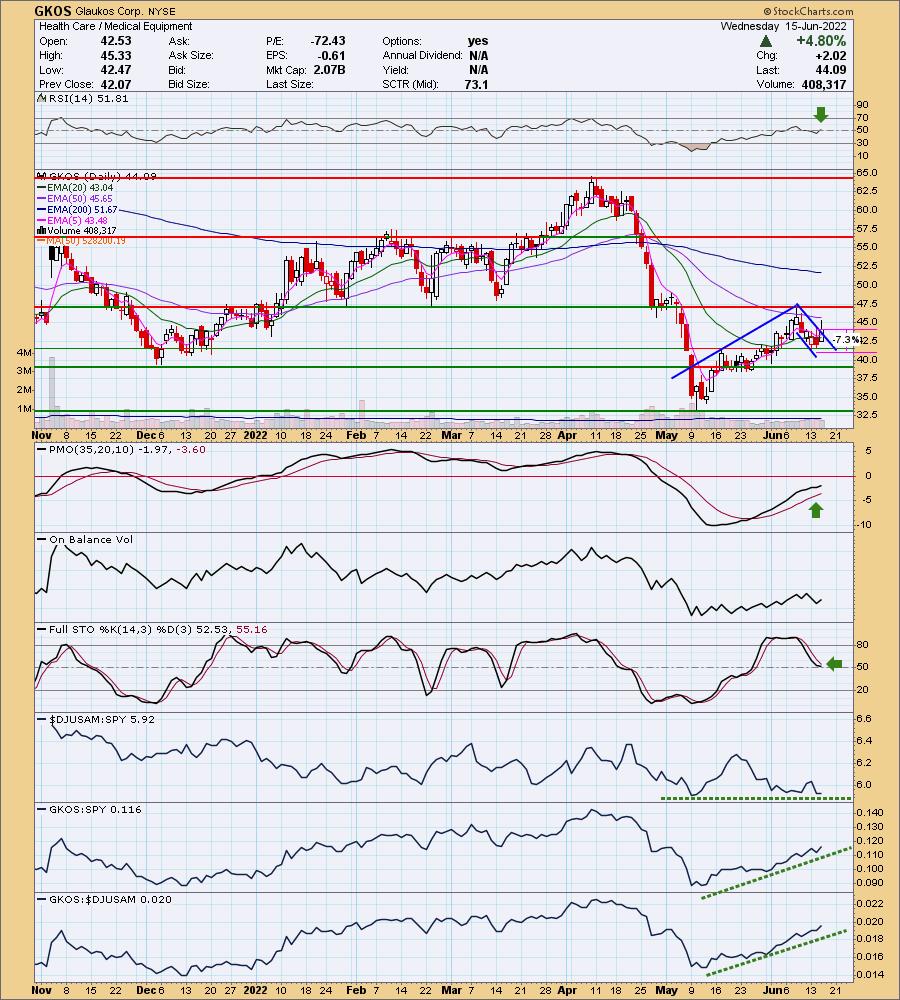
GKOS is unchanged in after hours trading. I like the bull flag that has formed on the daily chart. The RSI is now positive and the PMO is accelerating higher. Today's intraday high popped it out of the flag, but it wasn't enough to actually confirm the pattern in my opinion. Stochastics are staying in positive territory and turning back up now. Relative performance has been spotty for the group, but since May GKOS has been steadily outperforming both the market and the group. The stop is set below the flag and December low.
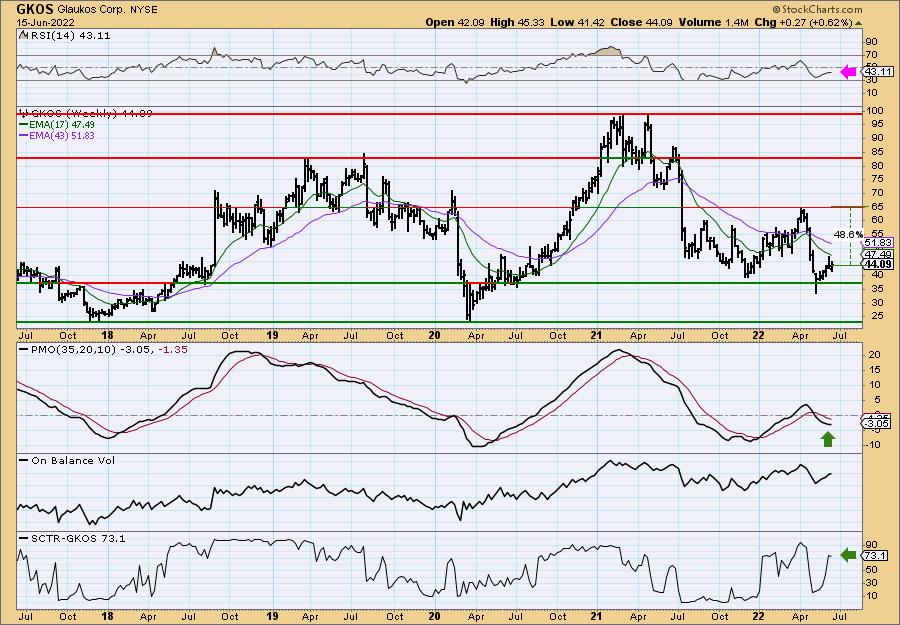
The weekly RSI remains negative and somewhat flat. The weekly PMO is declining but has decelerated and could turn up in the coming weeks. There is a strong positive OBV divergence leading into this current rally and the SCTR is bullish at 73.1. Upside potential could be over 48% if it tests overhead resistance, but I'd be happy with a move to $60 at the late 2021 tops.
Don't forget, on Thursdays I look at reader-requested symbols, click HERE to send me an email. I read every email I receive and try to answer them all!
Current Market Outlook:
Market Environment: It is important to consider the odds for success by assessing the market tides. The following chart uses different methodologies for objectively showing the depth and trend of participation for intermediate- and long-term time frames.
- The Silver Cross Index (SCI) shows the percentage of SPX stocks on IT Trend Model BUY signals (20-EMA > 50-EMA)
- The Golden Cross Index (GCI) shows the percentage of SPX stocks on LT Trend Model BUY signals (50-EMA > 200-EMA)
Don't forget that as a "Diamonds" member, you have access to our GCI/SCI curated ChartList on DecisionPoint.com. You'll find it under "Members Only" links on the left side on the Blogs and Links Page.
Here is the current chart:
Full Disclosure: I'm 20% exposed with 10% hedge. Contemplating DPZ, but dependent on tomorrow's trading action and my assessment of market conditions that would lead stocks higher in the very short term.
I'm required to disclose if I currently own a stock I mention and/or may buy/short it within the next 72 hours.
"Technical Analysis is a windsock, not a crystal ball." - Carl Swenlin
(c) Copyright 2022 DecisionPoint.com
Watch the latest episode of DecisionPoint with Carl & Erin Swenlin on Mondays 7:00p EST or on the DecisionPoint playlist on the StockCharts TV YouTube channel here!
NOTE: The stocks reported herein are from mechanical trading model scans that are based upon moving average relationships, momentum and volume. DecisionPoint analysis is then applied to get five selections from the scans. The selections given should prompt readers to do a chart review using their own analysis process. This letter is not a call for a specific action to buy, sell or short any of the stocks provided. There are NO sure things or guaranteed returns on the daily selection of "Diamonds in the Rough."
Helpful DecisionPoint Links:
DecisionPoint Shared ChartList and DecisionPoint Chart Gallery
Price Momentum Oscillator (PMO)
Swenlin Trading Oscillators (STO-B and STO-V)
For more links, go to DecisionPoint.com