
So much for bullish short-term indicators. The market crashed. I think we can use the word 'crash' for what happened today. The landscape has completely changed overnight. This is not a stock picker's paradise, more like stock picker's nightmare. The only safe way to invest right now is with stops. It is critical that you use them or just move into cash. I prefer cash.
I had only one person send in requests for today. Clearly y'all are struggling to find opportunities too. Tuesday's shorts are looking better now with SARK looking especially enticing. Today everything I present will be hedges or shorts.
My scans are empty on longs although a few Bond funds came through which makes me question whether yields will continue to rise. We'll see, but that is on my radar.
Don't forget to register for the Diamond Mine trading room tomorrow!
Good Luck & Good Trading!
Erin
Note: I will be sending Diamond subscribers the symbols discussed as "Diamonds of the Week" (and charts, time permitting) from Monday's DecisionPoint Shows. There will not be a show on Monday due to the holiday. The Free Trading Room will be held on Tuesday instead of Monday.)
Today's "Diamonds in the Rough": CPRI (Short), INSP (Short), KOLD, PEGA (Short) and SCO.

RECORDING LINK (6/10/2022):
Topic: DecisionPoint Diamond Mine (6/10/2022) LIVE Trading Room
Start Time: Jun 10, 2022 09:00 AM
Meeting Recording Link
Access Passcode: June$10th
REGISTRATION FOR Friday 6/17 Diamond Mine:
When: Jun 17, 2022 09:00 AM Pacific Time (US and Canada)
Topic: DecisionPoint Diamond Mine (6/17/2022) LIVE Trading Room
Register in advance for this webinar HERE
Save the registration confirmation email with login instructions in case Zoom doesn't notify you in time.

Free DP Trading Room (6/13/2022) RECORDING LINK:
Topic: DecisionPoint Trading Room
Start Time: Jun 13, 2022 09:01 AM
Meeting Recording Link
Access Passcode: June@13th
For best results, copy and paste the access code to avoid typos.
Welcome to DecisionPoint Daily Diamonds, wherein I highlight ten "Diamonds in the Rough" per week. These are selected from the results of my DecisionPoint Scans, which search for stocks that could benefit from the trend and condition of the market. Remember, these are not recommendations to buy or sell, but are the most interesting of the stocks that surfaced in my scans. My objective is to save you the work of the initial, tedious culling process, but you need to apply your own analysis to see if these stocks pique your interest as well. There are no guaranteed winners here!
"Predefined Scans Triggered" are taken from StockCharts.com using the "Symbol Summary" option instead of a "SharpChart" on the workbench.
Capri Holdings Ltd. (CPRI)
EARNINGS: 7/29/2022 (BMO)
Capri Holdings Ltd. operates as a global fashion luxury group. It engages in the design and distribution of sportswear, accessories, footwear and apparel of branded women's apparel and accessories and men's apparel. The firm operates through the following segments: Versace, Jimmy Choo, and Michael Kors. The Versace segment sells Versace luxury ready-to-wear, accessories, footwear and home furnishings through directly operated Versace boutiques. The Jimmy Choo segment sells Jimmy Choo luxury goods to end clients through directly operated Jimmy Choo stores. The Michael Kors segment sells Michael Kors products through four primary Michael Kors retail store formats such as Collection, Lifestyle, outlet stores, and e-commerce. The company was founded by Michael David Kors on December 13, 2002, and is headquartered in London, the United Kingdom.
Predefined Scans Triggered: Moved Below Ichimoku Cloud and P&F Double Bottom Breakout.
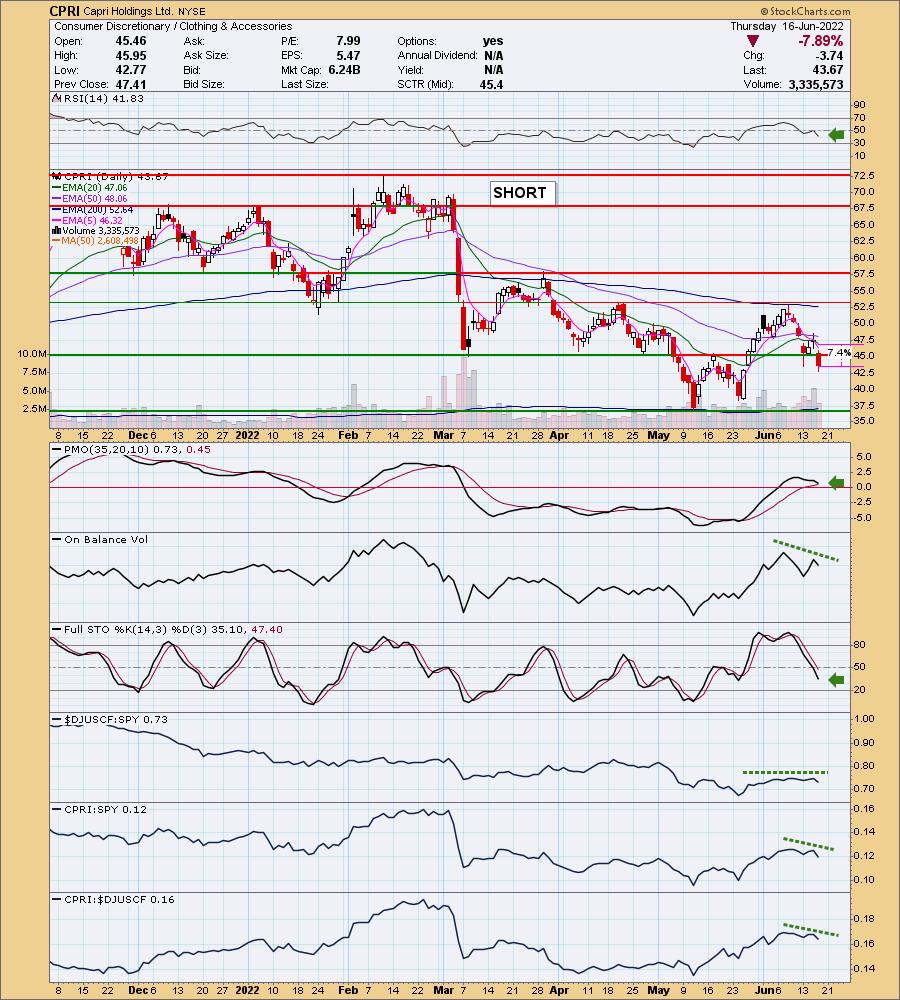
CPRI is unchanged in after hours trading. Today's breakdown was breathtaking as support was obliterated after a failed test of the 50-day EMA. The RSI is negative, not oversold and falling. The PMO is nearing a crossover SELL signal. The OBV is confirming the declining trend. Stochastics are falling in negative territory. The group has been performing in line with the SPY, but is taking a turn down. CPRI is not a good relative performer within the group or against the SPY. The upside stop on this short is 7.4% which is less than today's decline. I doubt we will see a strong enough rebound to trigger this stop, but given today's deep decline it isn't out of the question that this one will rebound a bit.
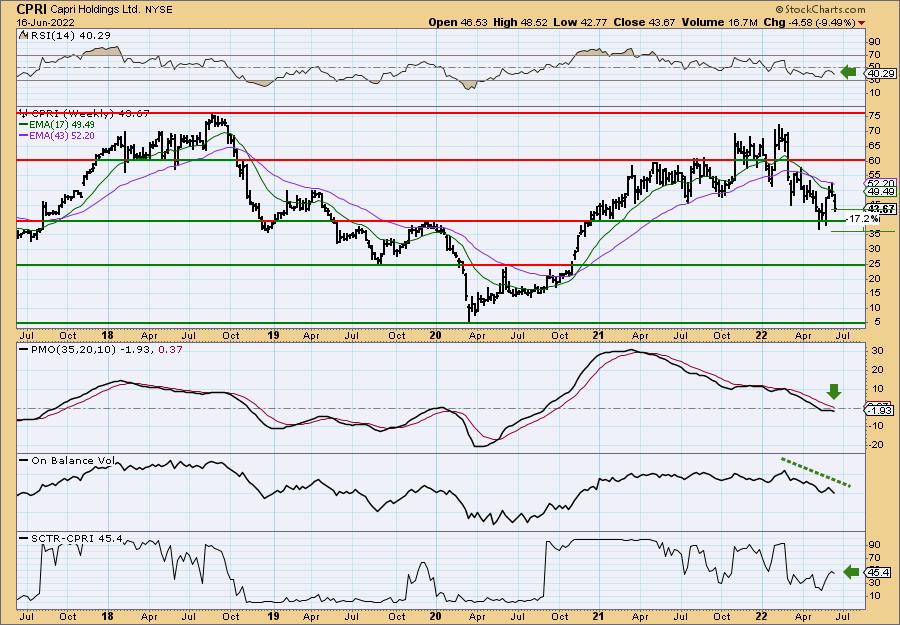
The weekly chart looked like it was going to improve on the rebound off support, but price is failing again, causing the weekly PMO to top beneath both the signal line and the zero line. The OBV is confirming the decline and the SCTR is only at 45.4 which is bearish. Downside potential is at least 13%, but I see it testing support at $35.
Inspire Medical Systems, Inc. (INSP)
EARNINGS: 8/2/2022 (AMC)
Inspire Medical Systems, Inc. engages in the development and commercialization of minimally invasive solutions for patients with obstructive sleep apnea. It offers inspire therapy, which consists of a remote control and implantable components that includes pressure sensing lead, a neurostimulator, and a stimulation lead. The company was founded by Timothy P. Herbert in November 2007 and is headquartered in Golden Valley, MN.
Predefined Scans Triggered: Hollow Red Candles and P&F Double Bottom Breakout.
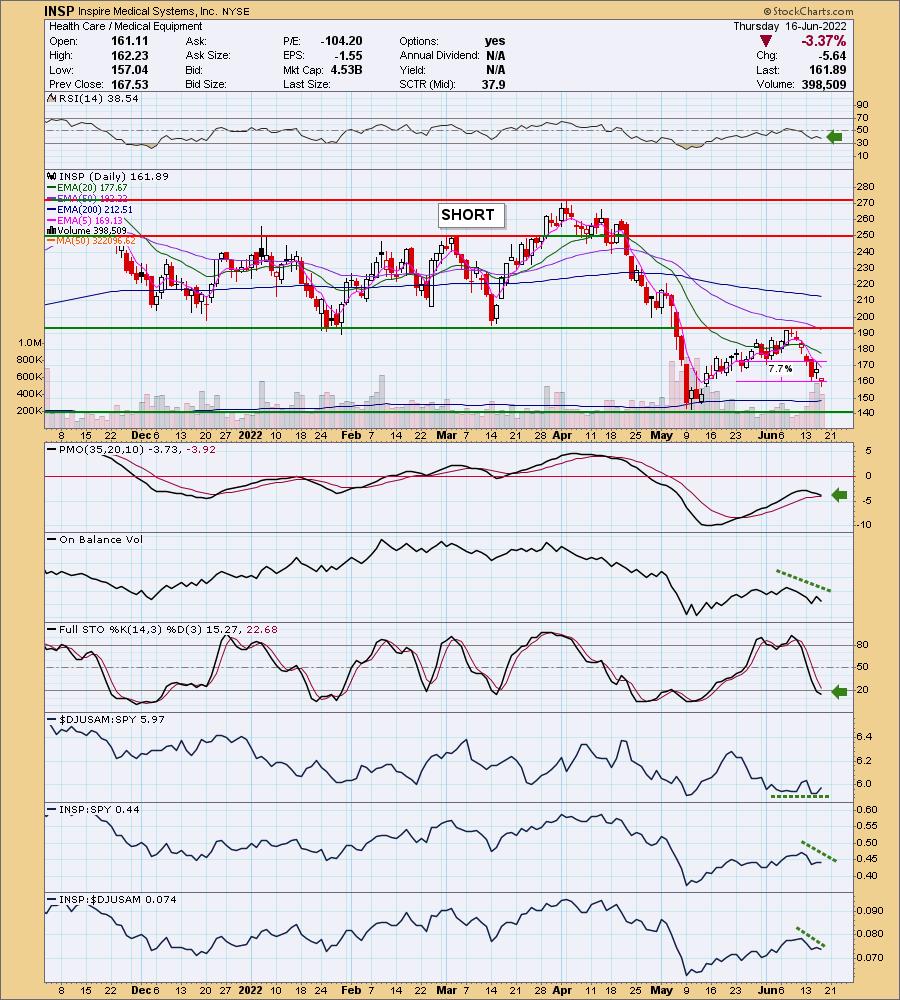
INSP is up +0.11% in after hours trading. I covered INSP on February 27th 2020. The position is closed as it was a casualty of the 2020 bear market. It's looking pretty ugly with one exception--a bullish hammer candlestick that suggests some upside tomorrow. Other than that it's bearish. The RSI is negative and falling. The PMO is about to give us a crossover SELL signal. Stochastics are falling below 20. Relative strength may be improving somewhat for the group, but INSP is failing against both the group and the SPY. The upside stop is set just above the early June low.
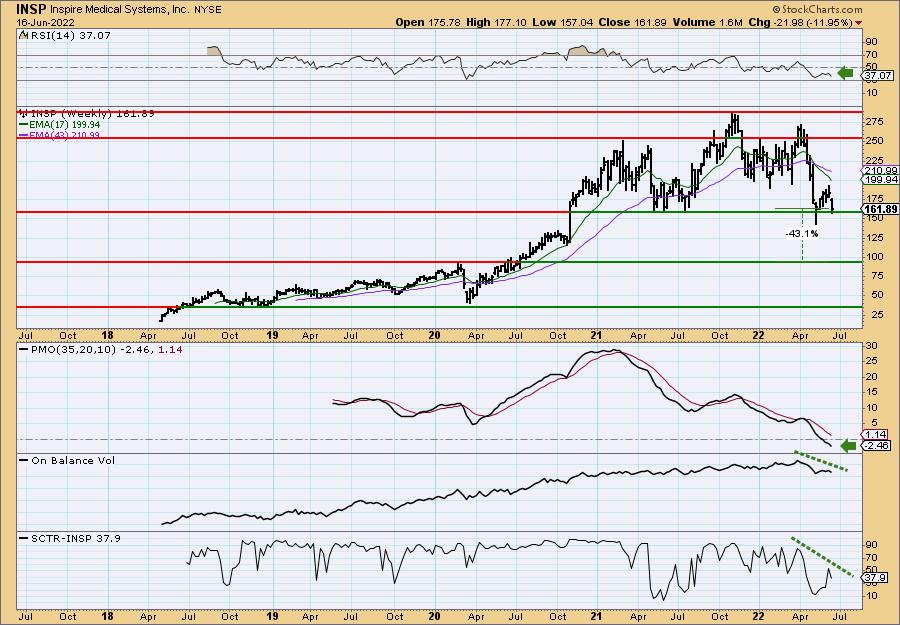
Another problem for me is that price hasn't broken long-term support yet on the weekly chart. If that happens, this one could fall a long way. The weekly RSI is negative and has turned down. The weekly PMO is now below zero and falling. The OBV and SCTR are confirming the downtrend with the SCTR value being a bearish 37.9.
ProShares UltraShort Bloomberg Natural Gas (KOLD)
EARNINGS: N/A
KOLD provides daily -2x exposure to an index that tracks natural gas by holding one second month futures contract at a time. For more information click HERE.
Predefined Scans Triggered: P&F High Pole.
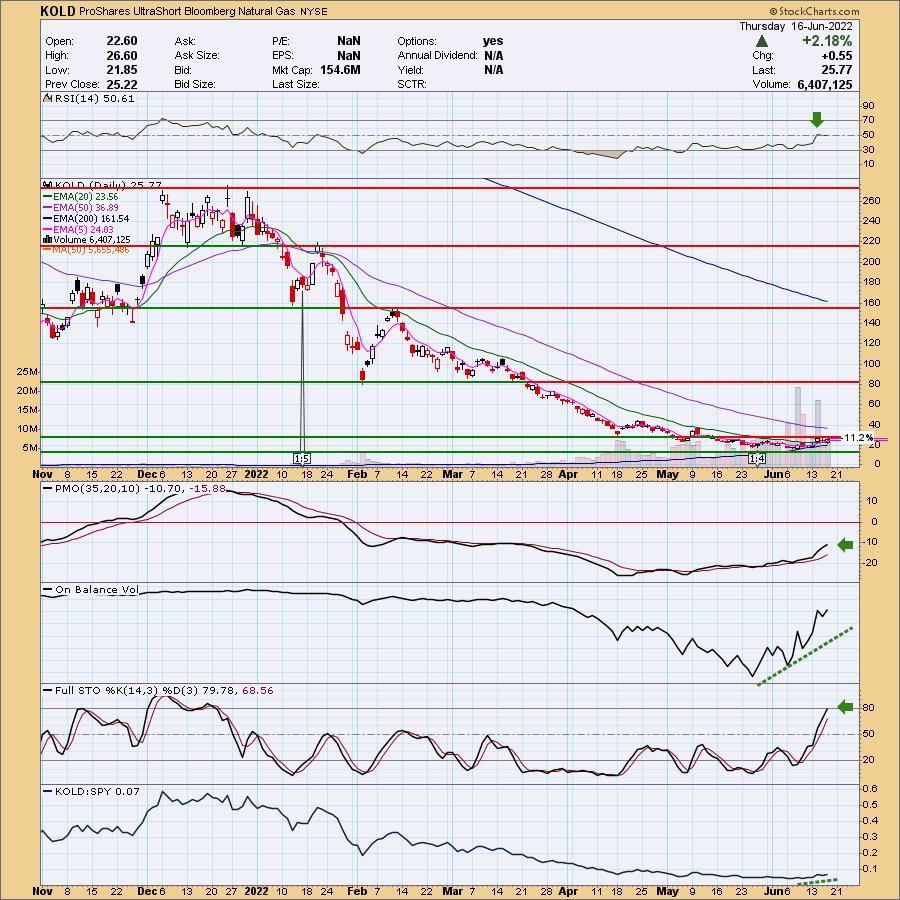
KOLD is up +0.66% in after hours trading. Carl actually wrote about Natural Gas as a free article. Here is the link. I think shorting Natural Gas isn't a bad idea, but as you know I don't like these "juiced" ETFs. UNG (US Natural Gas ETF) is already volatile these days so I KNOW I wouldn't have the stomach to go in on this ETF. the upside stop level is 11.2% but really should be a higher percentage given the swings that we've seen. You could get stopped out pretty quick. KOLD shows you why we should avoid UNG. If the inverse is setting up like this, the real thing should see lower prices. The RSI just moved into positive territory and the PMO is accelerating out of oversold territory. The OBV is confirming the current rising trend and saw a positive divergence with price on the May and June lows. Stochastics are bullish and relative strength is beginning to pick up slightly.
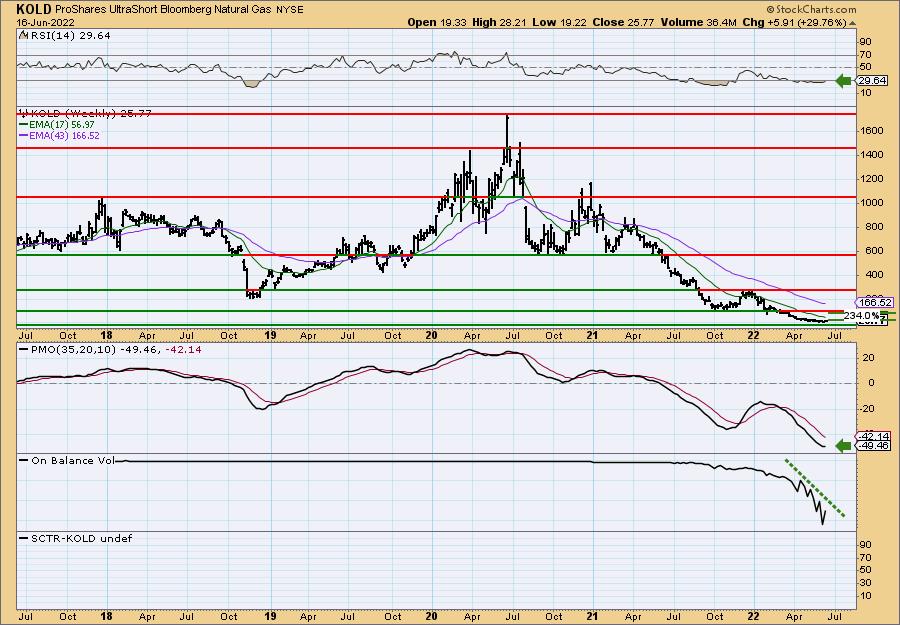
The weekly RSI is rising out of oversold territory and the weekly PMO is about to turn back up. The OBV is pretty ugly, but upside potential is staggering if UNG begins to fail in a big way.
Pegasystems, Inc. (PEGA)
EARNINGS: 7/27/2022 (AMC)
Pegasystems, Inc. engages in the development, market, license, and support of software, which allows organizations to build, deploy, and change enterprise applications. Its product Pega Infinity helps connect enterprises to their customers in real-time across channels, streamline business operations, and adapt to meet changing requirements. The company was founded by Alan Trefler in 1983 and is headquartered in Cambridge, MA.
Predefined Scans Triggered: Moved Below Lower Price Channel, P&F Triple Bottom Breakdown, P&F Double Bottom Breakout and Moved Below Lower Keltner Channel.
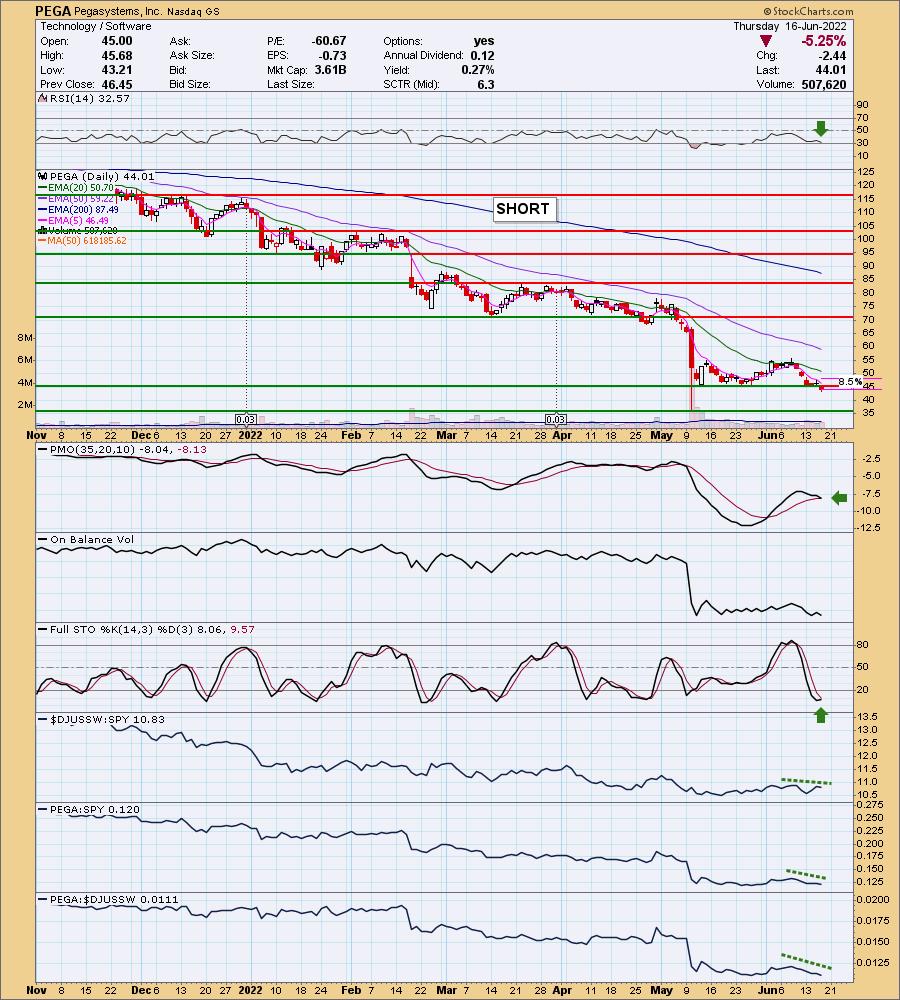
PEGA is unchanged in after hours trading. Today it lost near-term support at the mid-May low. The chart is ugly with the exception of Stochastics bottoming a bit. As long as they stay below 20 it should be fine. The RSI is negative and falling. The PMO is nearing a crossover SELL signal. The OBV is confirming the recent decline. Relative strength is weak. The upside stop would be about 8.5% which would put it back above prior support.
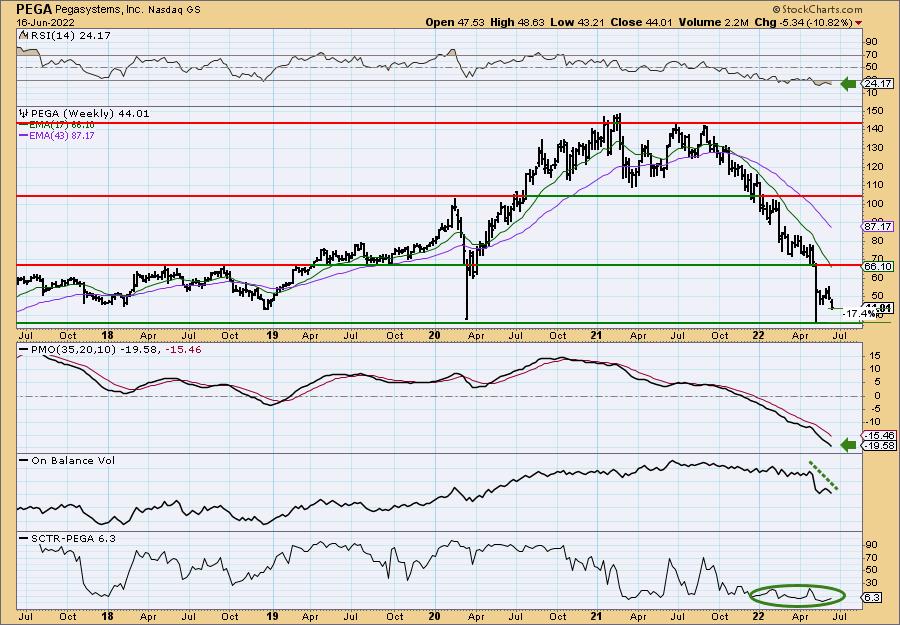
It is very close to long-term support, but the chart is still weak and I would look for a 17% drop. The weekly RSI is oversold, but in decline. The weekly PMO is well below the zero line and accelerating. Downside potential is just over 17%.
ProShares UltraShort Bloomberg Crude Oil (SCO)
EARNINGS: N/A
SCO provides -2x the daily return of an index of futures contracts on light sweet crude oil. For more information click HERE.
Predefined Scans Triggered: Elder Bar Turned Blue.
SCO is up +0.15% in after hours trading. This one, while it does look somewhat bullish, doesn't fit with my outlook on Crude Oil. I'm expecting a rebound soon so if you play with this one, consider it very short-term. The RSI is still negative and has turned down. The PMO is nearing a crossover BUY signal, but it is way below the zero line. Stochastics look very favorable and the OBV as well as relative strength are rising to confirm the rally. The stop is honestly thin given this is a 2x ETF, but I've listed 8.4% which would take you just above the last support level.
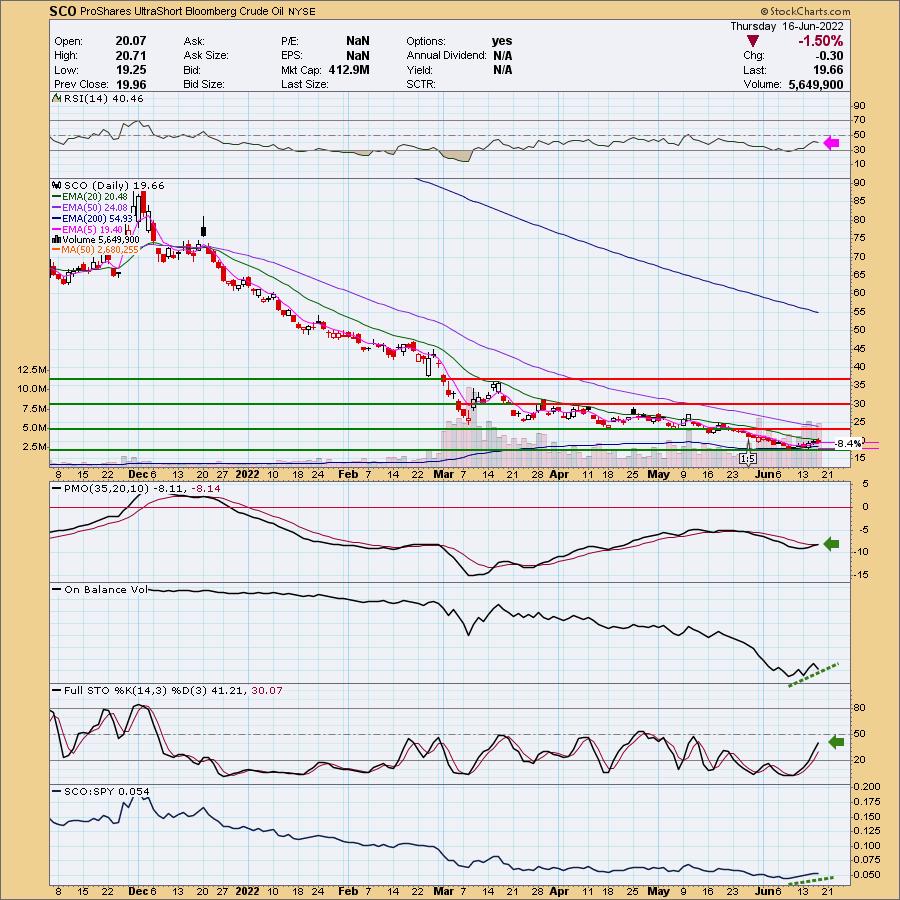
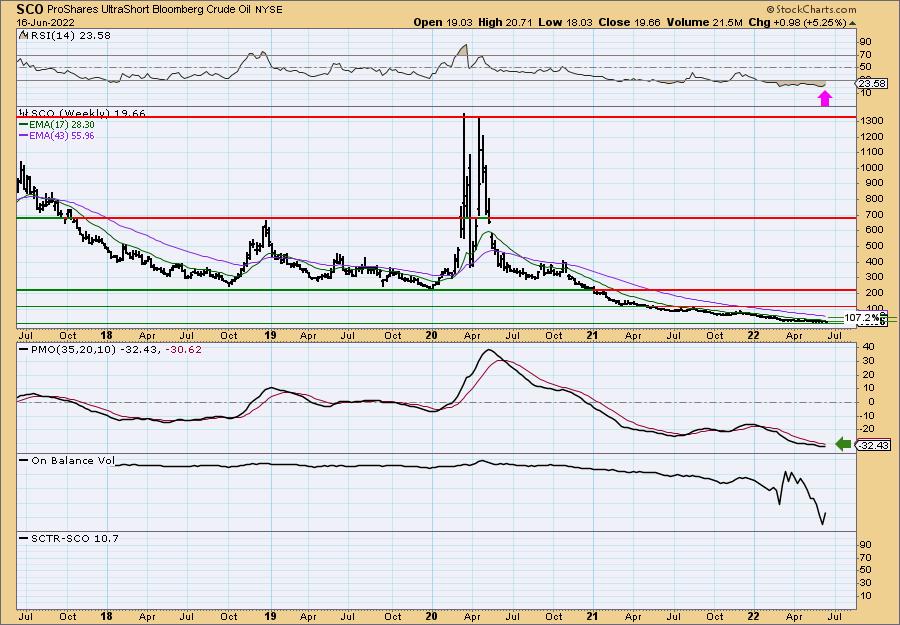
The weekly RSI is rising but is still stuck below 30. The weekly PMO is beginning to turn back up. The OBV is not good on the weekly chart. That deep decline suggests a lot of selling volume this quarter. Upside potential is crazy just like KOLD, but you have to endure some major swings in price. Also I'm not bearish enough on Oil to see that kind of return materializing right now.
Don't forget, on Thursdays I look at reader-requested symbols, click HERE to send me an email. I read every email I receive and try to answer them all!
Current Market Outlook:
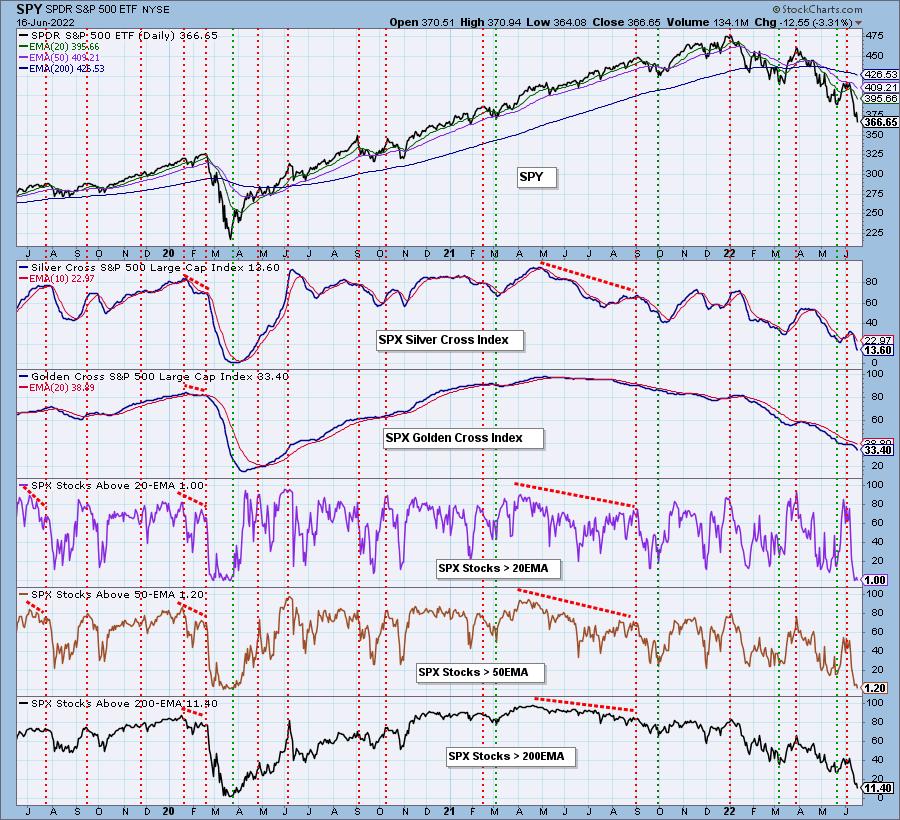
Market Environment: It is important to consider the odds for success by assessing the market tides. The following chart uses different methodologies for objectively showing the depth and trend of participation for intermediate- and long-term time frames.
- The Silver Cross Index (SCI) shows the percentage of SPX stocks on IT Trend Model BUY signals (20-EMA > 50-EMA)
- The Golden Cross Index (GCI) shows the percentage of SPX stocks on LT Trend Model BUY signals (50-EMA > 200-EMA)
Don't forget that as a "Diamonds" member, you have access to our GCI/SCI curated ChartList on DecisionPoint.com. You'll find it under "Members Only" links on the left side on the Blogs and Links Page.
Here is the current chart:
Full Disclosure: I'm 20% exposed with 10% hedge. Probably going to add more hedge given today's debacle.
I'm required to disclose if I currently own a stock I mention and/or may buy/short it within the next 72 hours.
"Technical Analysis is a windsock, not a crystal ball." - Carl Swenlin
(c) Copyright 2022 DecisionPoint.com
Watch the latest episode of DecisionPoint with Carl & Erin Swenlin on Mondays 7:00p EST or on the DecisionPoint playlist on the StockCharts TV YouTube channel here!
NOTE: The stocks reported herein are from mechanical trading model scans that are based upon moving average relationships, momentum and volume. DecisionPoint analysis is then applied to get five selections from the scans. The selections given should prompt readers to do a chart review using their own analysis process. This letter is not a call for a specific action to buy, sell or short any of the stocks provided. There are NO sure things or guaranteed returns on the daily selection of "Diamonds in the Rough."
Helpful DecisionPoint Links:
DecisionPoint Shared ChartList and DecisionPoint Chart Gallery
Price Momentum Oscillator (PMO)
Swenlin Trading Oscillators (STO-B and STO-V)
For more links, go to DecisionPoint.com