
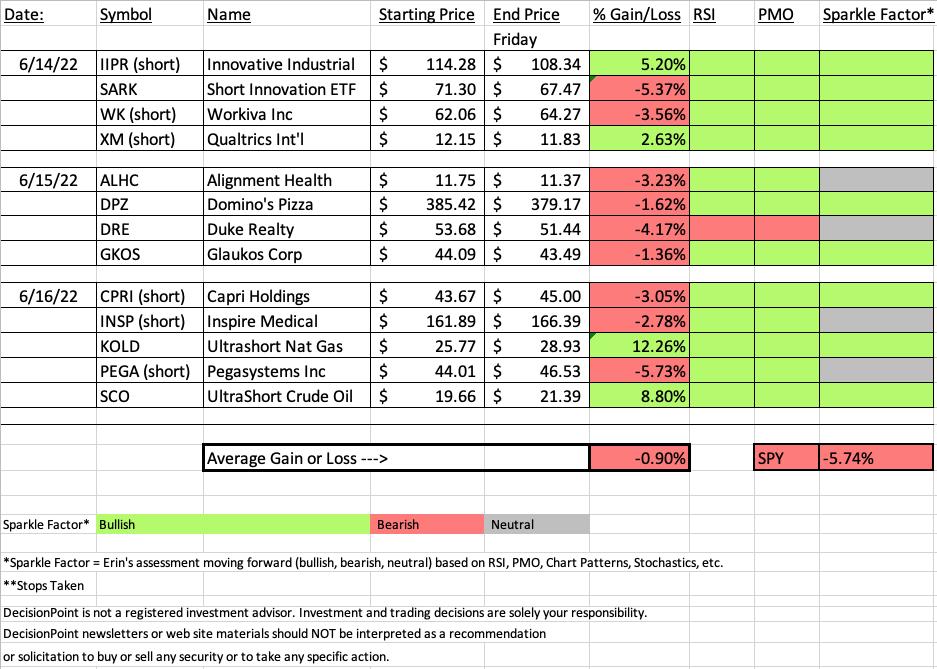
It was a rocky week for the market, but thanks to two inverse ETFs that were "Diamonds in the Rough", they averaged 4.84% better than the SPY...however, we are still looking at an average loss of -0.90%. Being heavily exposed to Energy made this week very difficult with my current hedge not making up for that. Yesterday, one reader brought SCO to the table. It is an inverse ETF on Crude Oil. I will likely add this hedge on Tuesday if Energy doesn't look like it will come back to life.
This week's "Darling" was another inverse ETF, Ultrashort Natural Gas (KOLD). It was a reader request yesterday and it was up over 12% today! This might also be a way to hedge your Energy stocks.
This week's "Duds" were SARK (inverse of ARKK) down -5.37% and a short on PEGA, a software company that unfortunately finished today up +5.73%. I like SARK moving forward (the timing was off this week) so I'm going to present PEGA as the "Dud".
We have a three-day weekend as Monday is a holiday for "Juneteenth". The Free DP Trading Room will be on TUESDAY at Noon ET.
See you then! Next Diamonds report will be on Tuesday, June 21st.
Erin

RECORDING LINK (6/17/2022):
Topic: DecisionPoint Diamond Mine (6/17/2022) LIVE Trading Room
Start Time: Jun 17, 2022 09:00 AM PT
Meeting Recording Link
Access Passcode: June#17th
REGISTRATION FOR Friday 6/24 Diamond Mine:
When: Jun 24, 2022 09:00 AM Pacific Time (US and Canada)
Topic: DecisionPoint Diamond Mine (6/24/2022) LIVE Trading Room
Register in advance for this webinar HERE
Save the registration confirmation email with login instructions in case Zoom doesn't notify you in time.

Free DP Trading Room (6/13/2022) RECORDING LINK:
Topic: DecisionPoint Trading Room
Start Time: Jun 13, 2022 09:00 AM
Meeting Recording Link
Access Passcode: June@13th
For best results, copy and paste the access code to avoid typos.
A few items about the spreadsheet: I've put on the spreadsheet whether the RSI is positive (green) or negative (red). The PMO column tells you if it is rising (green) or falling (red). Finally I've added my own "Sparkle Factor" that gives you my assessment going forward, bullish (green), bearish (red) or neutral (gray). The Sparkle Factor is basically my thoughts on whether I expect it to rise or fall. A neutral means it could really go either way so it could be added to a watch list. If you're in a stock I consider "neutral" going forward, the ball is in your court.
Darling:
ProShares UltraShort Bloomberg Natural Gas (KOLD)
EARNINGS: N/A
KOLD provides daily -2x exposure to an index that tracks natural gas by holding one second month futures contract at a time. For more information click HERE.
Predefined Scans Triggered: P&F High Pole.
Below are the chart and commentary from yesterday (6/16):
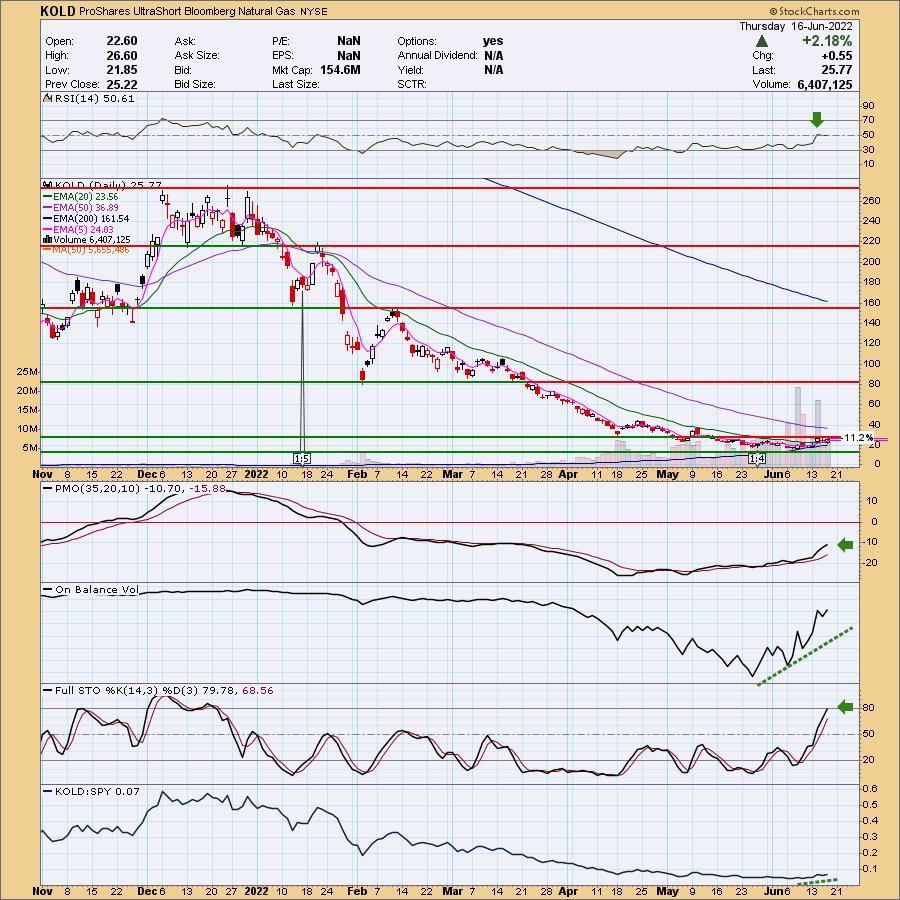
"KOLD is up +0.66% in after hours trading. Carl actually wrote about Natural Gas as a free article. Here is the link. I think shorting Natural Gas isn't a bad idea, but as you know I don't like these "juiced" ETFs. UNG (US Natural Gas ETF) is already volatile these days so I KNOW I wouldn't have the stomach to go in on this ETF. the upside stop level is 11.2% but really should be a higher percentage given the swings that we've seen. You could get stopped out pretty quick. KOLD shows you why we should avoid UNG. If the inverse is setting up like this, the real thing should see lower prices. The RSI just moved into positive territory and the PMO is accelerating out of oversold territory. The OBV is confirming the current rising trend and saw a positive divergence with price on the May and June lows. Stochastics are bullish and relative strength is beginning to pick up slightly."
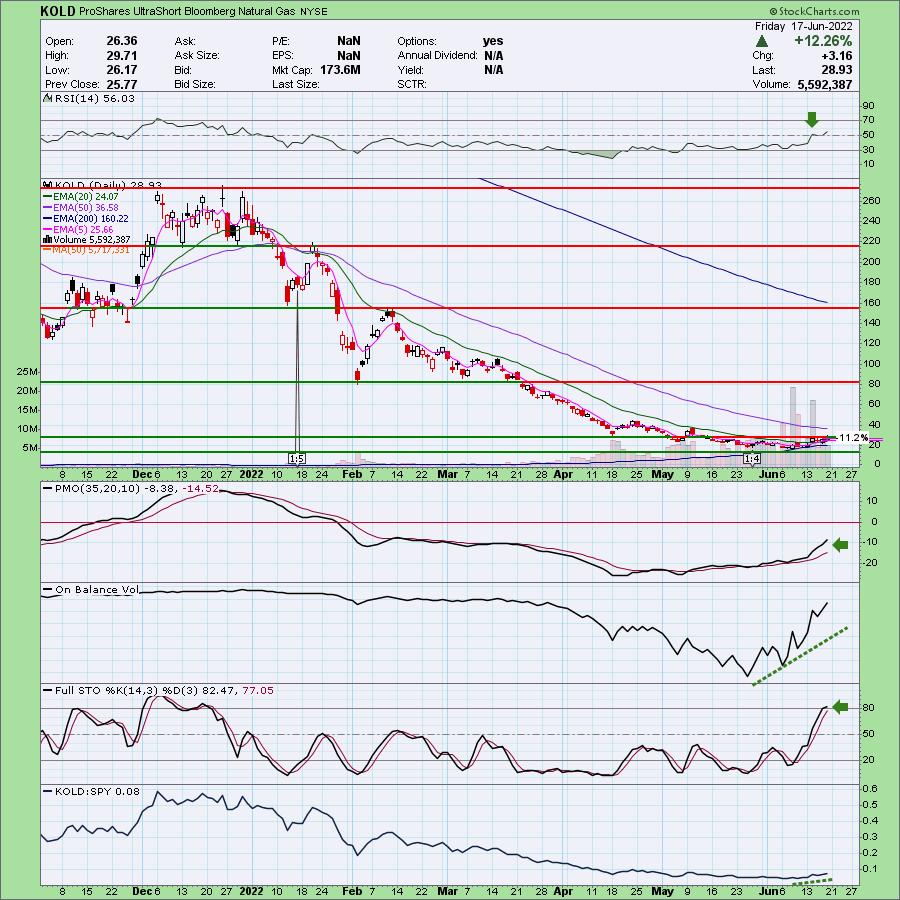
Here is today's chart:
Natural Gas (UNG) is already a volatile investment so take care getting into this "juiced" ETF. Next time I'll use a log scale and it is hard to see price action. I will tell you that it is excellent price action with today's move taking price just above the April low. We are hearing that there is an influx of domestic natural gas and that will take UNG lower. This could be a decent hedge on Energy positions, but be careful as this one has some unbelievable price swings.
Don't forget, on Thursdays I look at reader-requested symbols, so shoot me an email at erin@decisionpoint.com. I read every email I receive and try to answer them all!
Dud:
Pegasystems, Inc. (PEGA)
EARNINGS: 7/27/2022 (AMC)
Pegasystems, Inc. engages in the development, market, license, and support of software, which allows organizations to build, deploy, and change enterprise applications. Its product Pega Infinity helps connect enterprises to their customers in real-time across channels, streamline business operations, and adapt to meet changing requirements. The company was founded by Alan Trefler in 1983 and is headquartered in Cambridge, MA.
Predefined Scans Triggered: Moved Below Lower Price Channel, P&F Triple Bottom Breakdown, P&F Double Bottom Breakout and Moved Below Lower Keltner Channel.
Below are the commentary and chart from yesterday (6/16):
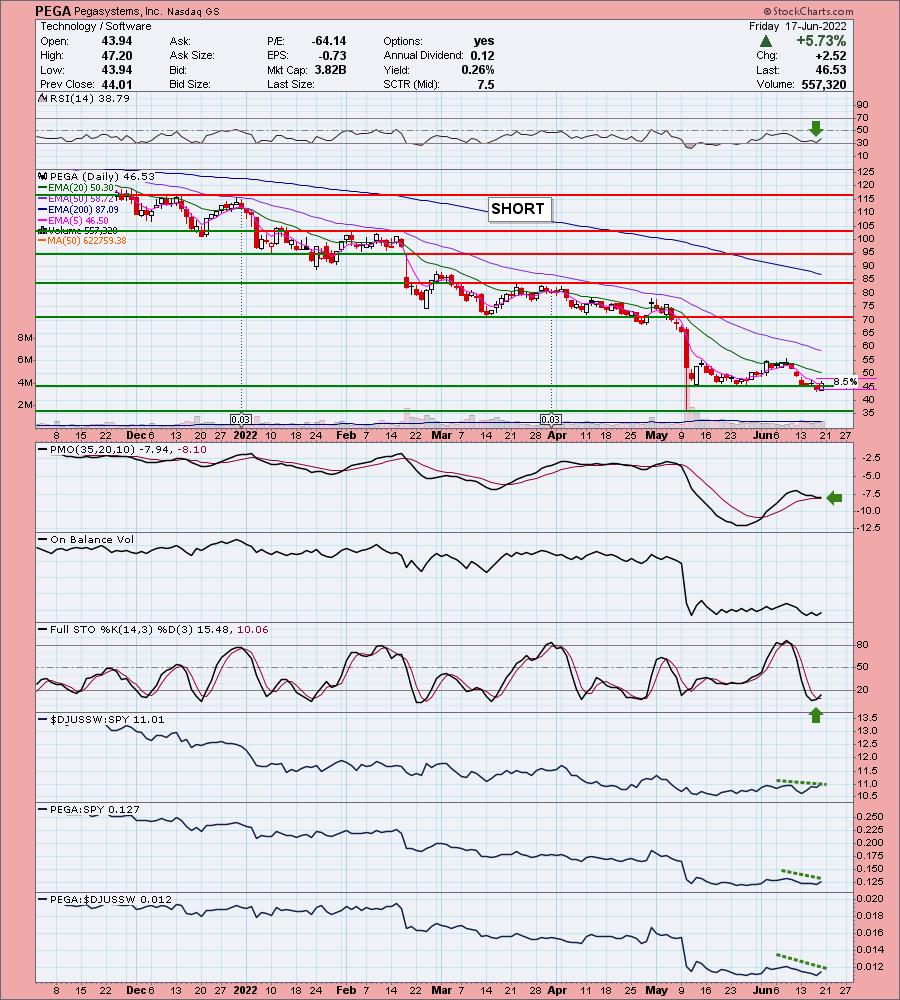
"PEGA is unchanged in after hours trading. Today it lost near-term support at the mid-May low. The chart is ugly with the exception of Stochastics bottoming a bit. As long as they stay below 20 it should be fine. The RSI is negative and falling. The PMO is nearing a crossover SELL signal. The OBV is confirming the recent decline. Relative strength is weak. The upside stop would be about 8.5% which would put it back above prior support."
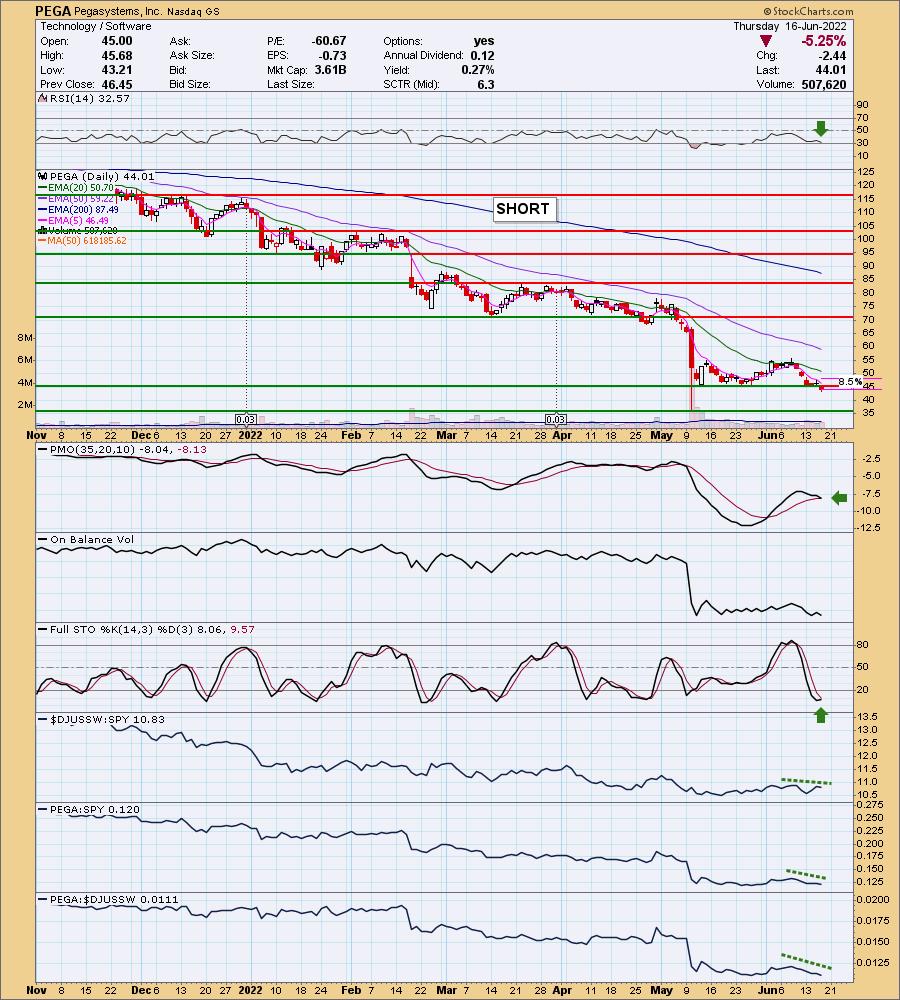
Here is today's chart:
PEGA had broken support but today was able to recapture it. The indicators are still negative with he exception of Stochastics. That is why I've given it a "neutral" rating going forward. The chart is still weak, but today's upward thrust makes me question the validity of shorting this one. I believe there are better choices.
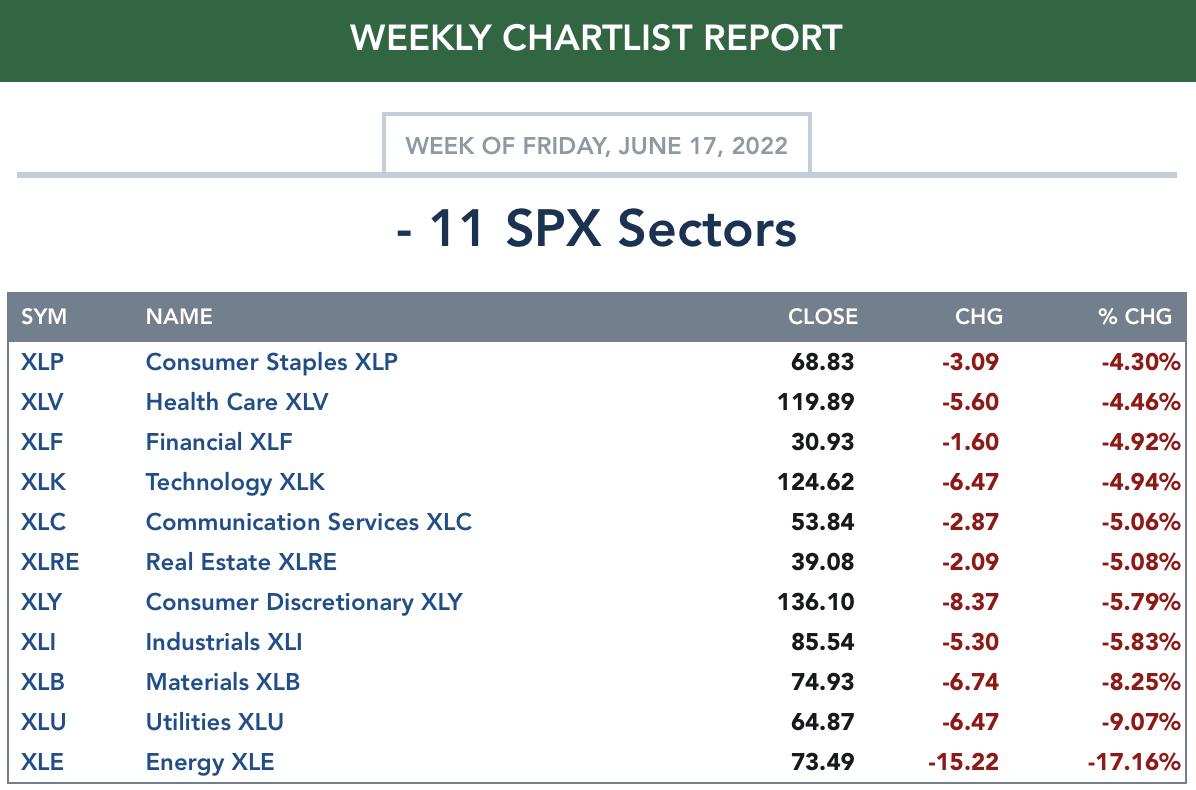
THIS WEEK's Sector Performance:
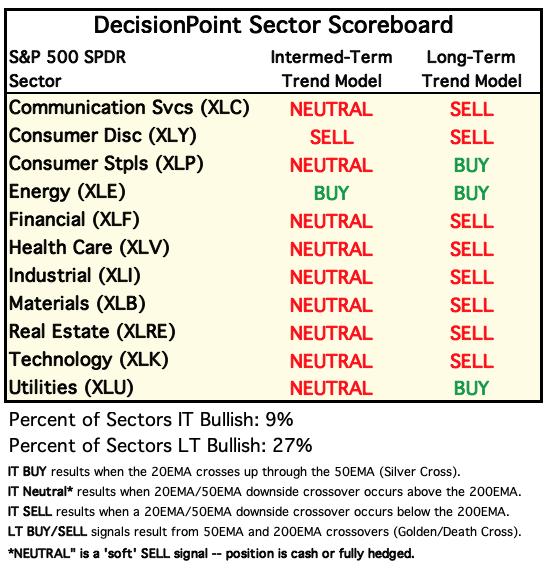
DecisionPoint Sector Scoreboard (Mechanical Trend Model Signals):
Click Here to view Carl's annotated Sector ChartList!
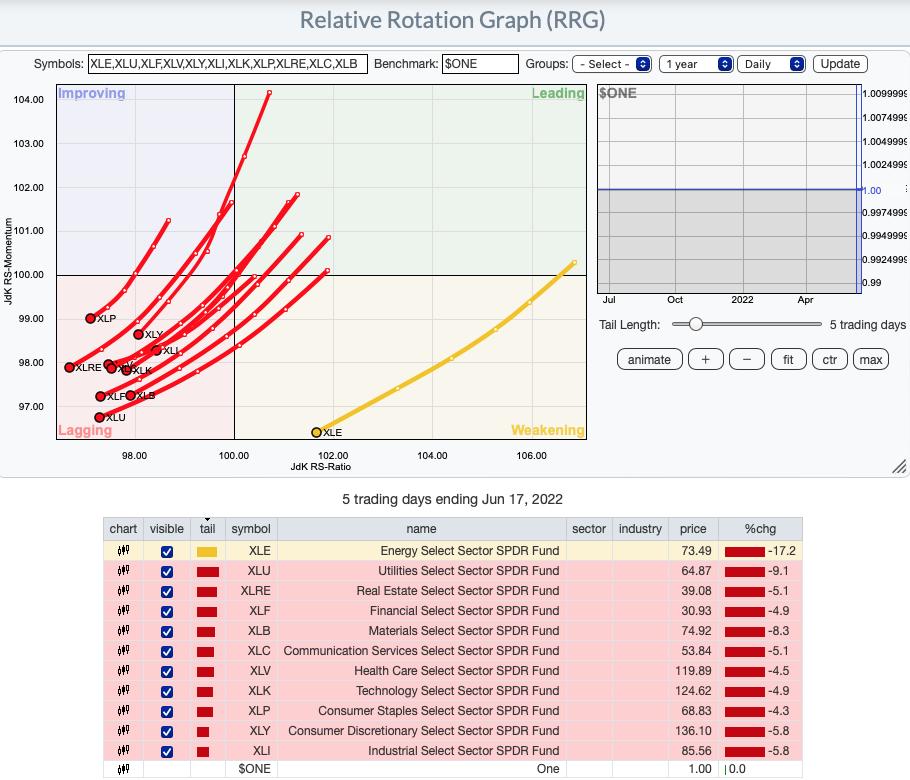
RRG® Daily Chart ($ONE Benchmark):
Normally we have to write an extensive description about the RRG as we see actual rotation. Currently all of the sectors are underperforming as they travel in a bearish southwest direction. None of them have turned from that heading. XLE looks slightly better as it is in the Weakening quadrant. If that sector continues to lose ground, it will hit the Lagging quadrant sooner rather than later.
RRG® Weekly Chart ($ONE Benchmark):
The weekly RRG tells us weakness isn't only in the short term, it is clear in the longer term as well. This looks very similar to the daily version. All of the sectors have bearish southwest headings. XLP, XLU and XLE are only in the Weakening quadrant as they have seen some success in this bear market; however, based on today's Diamond Mine Trading Room sector review, XLP and XLU are not healthy enough to go fishing there. Energy is pulling back in a big way and that has given it a new southwest bearish heading.
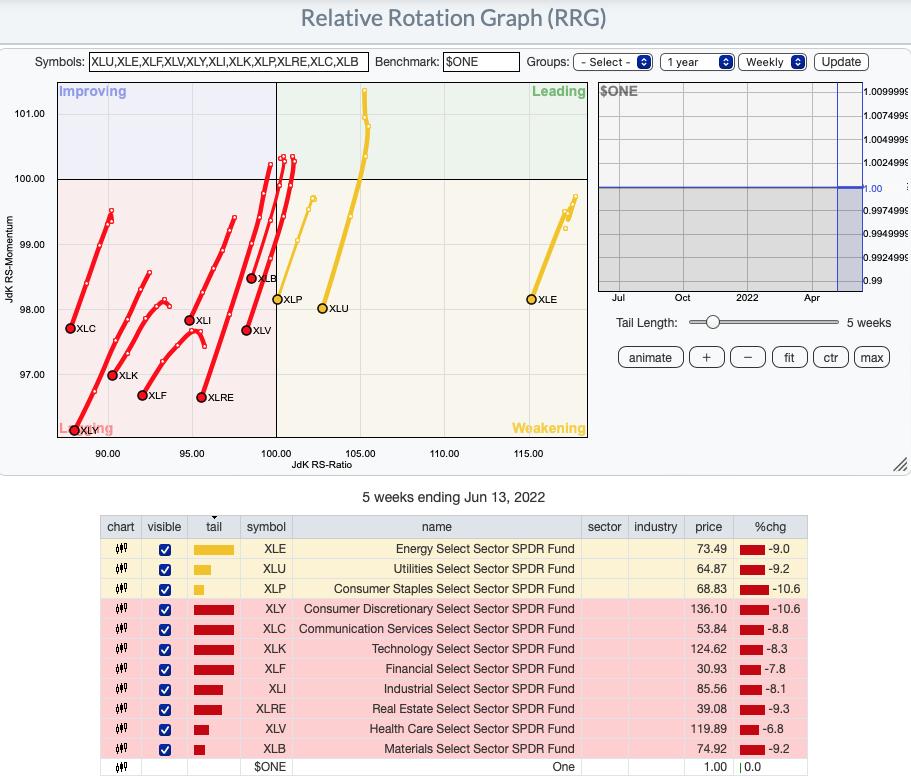
RRG® charts show you the relative strength and momentum for a group of stocks. Stocks with strong relative strength and momentum appear in the green Leading quadrant. As relative momentum fades, they typically move into the yellow Weakening quadrant. If relative strength then fades, they move into the red Lagging quadrant. Finally, when momentum starts to pick up again, they shift into the blue Improving quadrant.
CLICK HERE for an animated version of the RRG charts.
Sector to Watch: Healthcare (XLV)
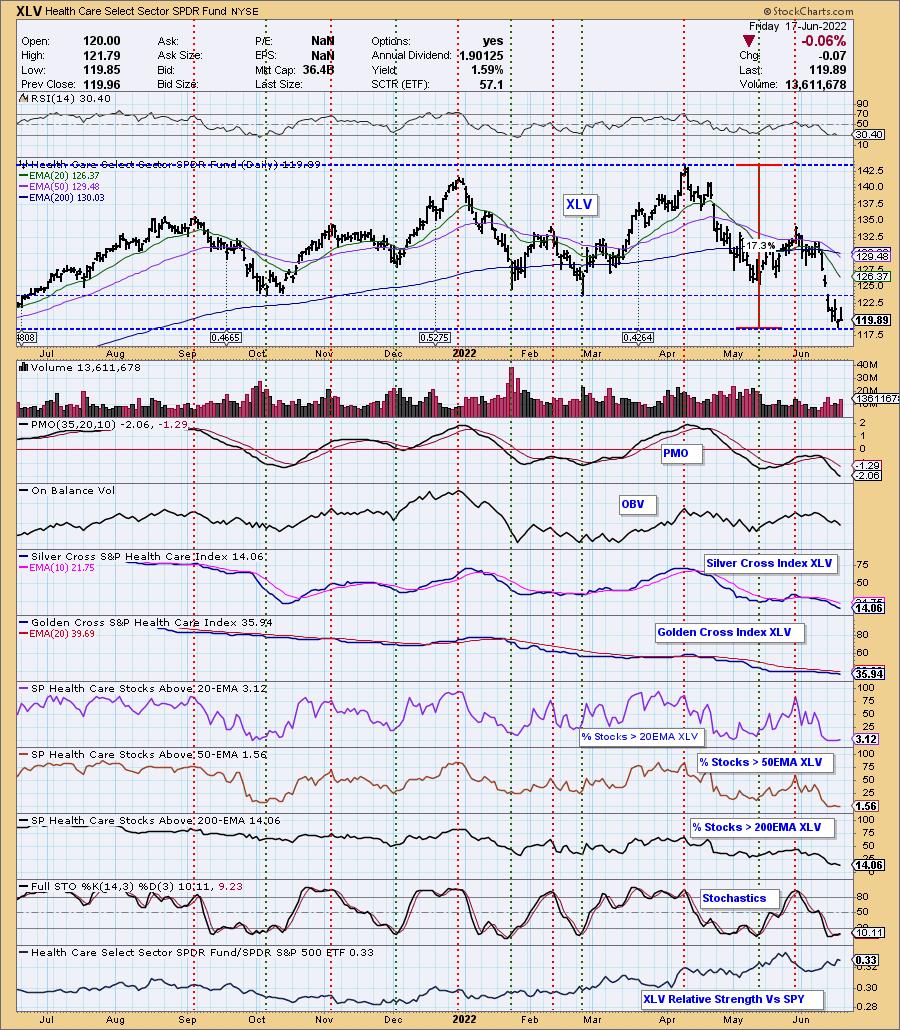
Looking at all of the sectors was enlightening after the close. As I noted in the Diamond Mine trading room, none of the sectors look appetizing, so I suppose we go with the least bearish? I scoured the participation numbers and relative strength against the SPY and rather than present Real Estate (XLRE) as I thought I would (participation did not improve at all today), I opted for Healthcare. Given it had a "death cross" this week (50/200-day EMA negative crossover), it is far from strong. What it does have going for it is participation (kind of) and relative strength. As noted in the beginning of this blog, relative strength against the SPY doesn't always mean higher prices, but it is the best we've got right now.
I don't like the shooting star candlestick today. The RSI is very negative and not yet oversold, and the PMO is still declining (but is oversold). Stochastics are attempting to turn back up in oversold territory and we do have slightly more stocks above their 20-day EMA than their 50-day EMA. Given the negative EMA configuration on XLV, the first improvement a stock will make is moving above the 20-day EMA. Seeing improvement here is good although the actual readings are terrible.
Price has turned back up as far as intraday lows.
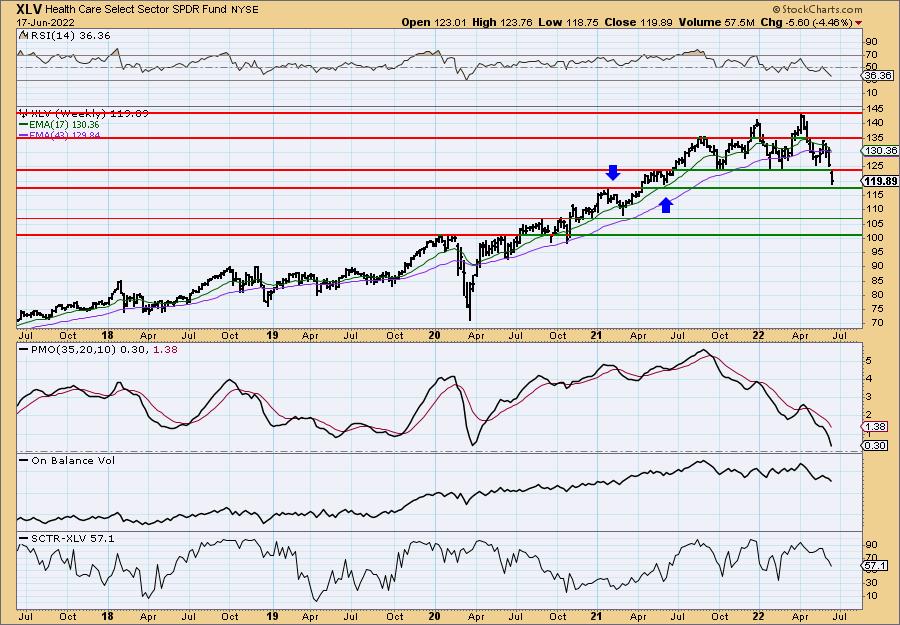
I don't usually include the weekly chart, but I wanted you to be able to see support levels. It dropped below important support this week which is far from encouraging, but it has landed on another support level. If it doesn't hold this, this sector will fall apart even more than it has.
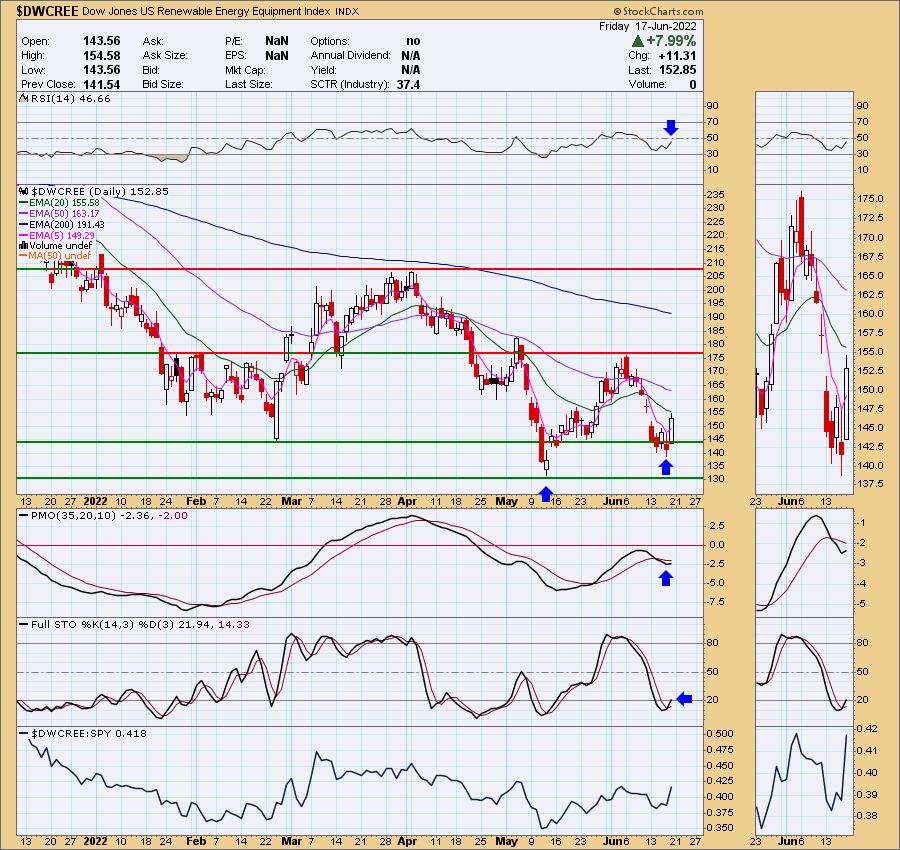
Industry Group to Watch: Diversified REITs ($DJUSDT) & Renewable Energy ($DWCREE)
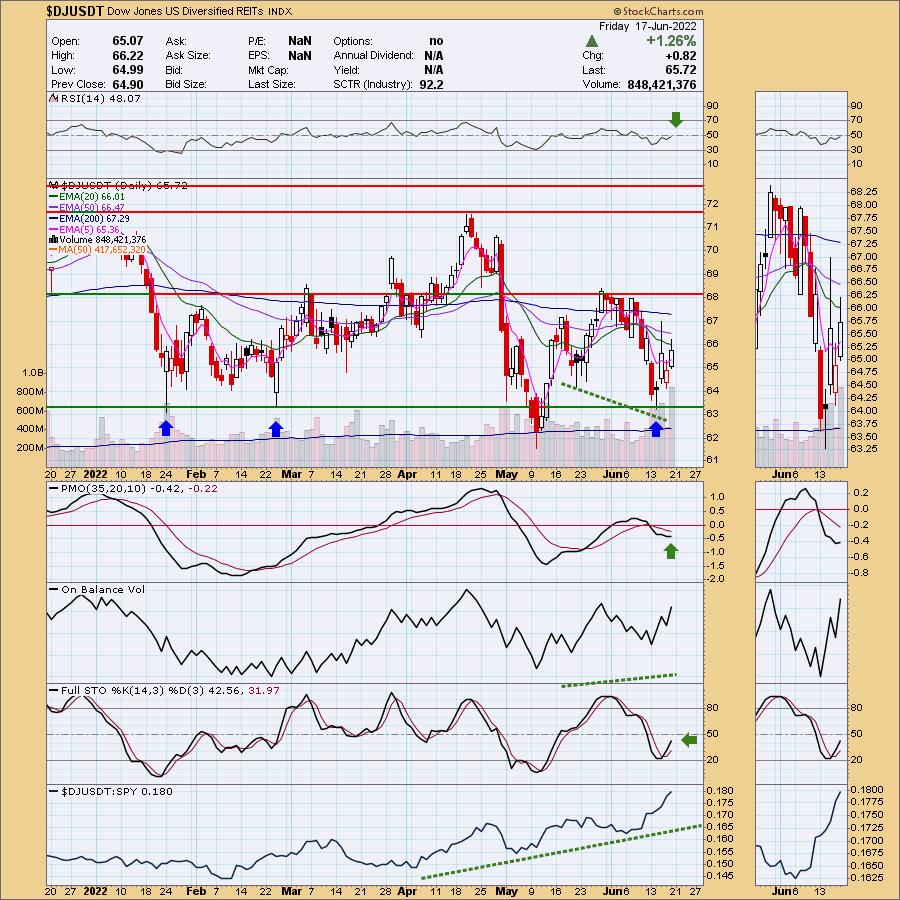
I will be writing an article shortly discussing both of these two industry groups. Of the 90 industry groups that StockCharts.com tracks, only TWO have rising PMOs and just barely. I included both of them for you. I will tell you that TAN, the Solar ETF doesn't have a rising PMO yet, but it has decelerated.
I have included the thumbnails because without them, you wouldn't really know that these PMOs had turned up at all. We have a strong positive divergence that led into this current rally that suggests it will get legs. The RSI is still negative but is rising now and Stochastics look good as they rise out of negative territory. It is a clear winner against the SPY. In the Diamond Mine trading room we picked out a few stocks in this area that had potential: WPC, STOR and PINE (I will not be sharing those symbols when I write the free article).
This looks promising for Renewable Energy, but I have to say that I wouldn't want to jump into this area in a bear market. It is already volatile. However, the chart is shaping up. The RSI is nearing positive territory, Stochastics are rising again and this week it was a clear outperformer against the SPY. Looking at the relative strength line though you can see how volatile it is. If you have a giant risk tolerance, here are a few symbols in that area that I liked: SHLS (big double-bottom forming in intermediate term), ENPH (positive EMA configuration, holding support at 200-day EMA) and SOL (like the PMO configuration and relative strength).
Go to our Sector ChartList on DecisionPoint.com to get an in-depth view of all the sectors.
Have a great three-day weekend! Good Luck & Good Trading!
- Erin
erin@decisionpoint.com
Full Disclosure: I'm 30% exposed.
Watch the latest episode of DecisionPoint with Carl & Erin Swenlin on Mondays 7:00p EST or on the DecisionPoint playlist on the StockCharts TV YouTube channel here!
Technical Analysis is a windsock, not a crystal ball. --Carl Swenlin
NOTE: The stocks reported herein are from mechanical trading model scans that are based upon moving average relationships, momentum and volume. DecisionPoint analysis is then applied to get five selections from the scans. The selections given should prompt readers to do a chart review using their own analysis process. This letter is not a call for a specific action to buy, sell or short any of the stocks provided. There are NO sure things or guaranteed returns on the daily selection of "diamonds in the rough."
Helpful DecisionPoint Links:
DecisionPoint Shared ChartList and DecisionPoint Chart Gallery
Price Momentum Oscillator (PMO)
Swenlin Trading Oscillators (STO-B and STO-V)
(c) Copyright 2022 DecisionPoint.com