
Today presented some interesting selections despite seeing fewer scan results. In the title I mentioned pullbacks and breakouts. Sometimes I find "Diamonds in the Rough" that aren't 'ripe' for whatever reason. Typically if a stock or ETF has made a gain of more than 5%, I won't include it. I just add it to the "Stocks to Review" list. Today, I decided to indicate why they are on the "review" list and not a "Diamond in the Rough". I won't always be able to do this, but I will try as it gives you watch list material with more direction.
One of today's "Diamonds in the Rough", American Waterworks (AWK) was taken from the Diamond Mine trading room when I 'mined' for sector/industry group to watch. Another, Generac (GNRC) was given out during yesterday's DecisionPoint Show (as well as AWK).
Let me know via email whether you would like me to email the "Diamond of the Week" charts from the DecisionPoint Show to you on Monday afternoon/evening after the show has been recorded. I avoid cramming subscriber inboxes so if I have enough who want that extra email, I'll begin sending them to all Diamonds subscribers.
Good Luck & Good Trading!
Erin
Today's "Diamonds in the Rough": AWK, GNRC, IIIV and KFRC.
Stocks to Review:
Possible Buy on a Pullback: LABU, CRNX and UEC.
Possible Buy on a Breakout: ARIS, LOPE and IAU.

RECORDING LINK (6/3/2022):
Topic: DecisionPoint Diamond Mine (6/3/2022) LIVE Trading Room
Start Time: Jun 3, 2022 09:00 AM
Meeting Recording Link.
Access Passcode: June#3rd
REGISTRATION FOR Friday 6/10 Diamond Mine:
When: Jun 10, 2022 09:00 AM Pacific Time (US and Canada)
Topic: DecisionPoint Diamond Mine (6/10/2022) LIVE Trading Room
Register in advance for this webinar HERE.
Save the registration confirmation email with login instructions in case Zoom doesn't notify you in time.

Free DP Trading Room (6/6/2022) RECORDING LINK:
Topic: DecisionPoint Trading Room
Start Time: Jun 6, 2022 09:00 AM
Meeting Recording Link.
Access Passcode: June@6th
For best results, copy and paste the access code to avoid typos.
Welcome to DecisionPoint Daily Diamonds, wherein I highlight ten "Diamonds in the Rough" per week. These are selected from the results of my DecisionPoint Scans, which search for stocks that could benefit from the trend and condition of the market. Remember, these are not recommendations to buy or sell, but are the most interesting of the stocks that surfaced in my scans. My objective is to save you the work of the initial, tedious culling process, but you need to apply your own analysis to see if these stocks pique your interest as well. There are no guaranteed winners here!
"Predefined Scans Triggered" are taken from StockCharts.com using the "Symbol Summary" option instead of a "SharpChart" on the workbench.
American Water Works Co. Inc. (AWK)
EARNINGS: 7/27/2022 (AMC)
American Water Works Co., Inc. engages in the provision of complementary water and wastewater services. It operates through the following segments: Regulated Businesses, Market-Based Businesses, and Other. The Regulated Businesses segment provides water and wastewater services to customers. The Market-Based Businesses segment is responsible for Military Services Group, Contract Operations Group, Homeowner Services Group, and Keystone Operations. The Other segment includes corporate costs that are not allocated to the Company's operating segments, eliminations of inter-segment transactions, fair value adjustments and associated income and deductions related to the acquisitions that have not been allocated to the operating segments for evaluation of performance and allocation of resource purposes. The company was founded in 1886 and is headquartered in Camden, NJ.
Predefined Scans Triggered: Elder Bar Turned Green and P&F Low Pole.
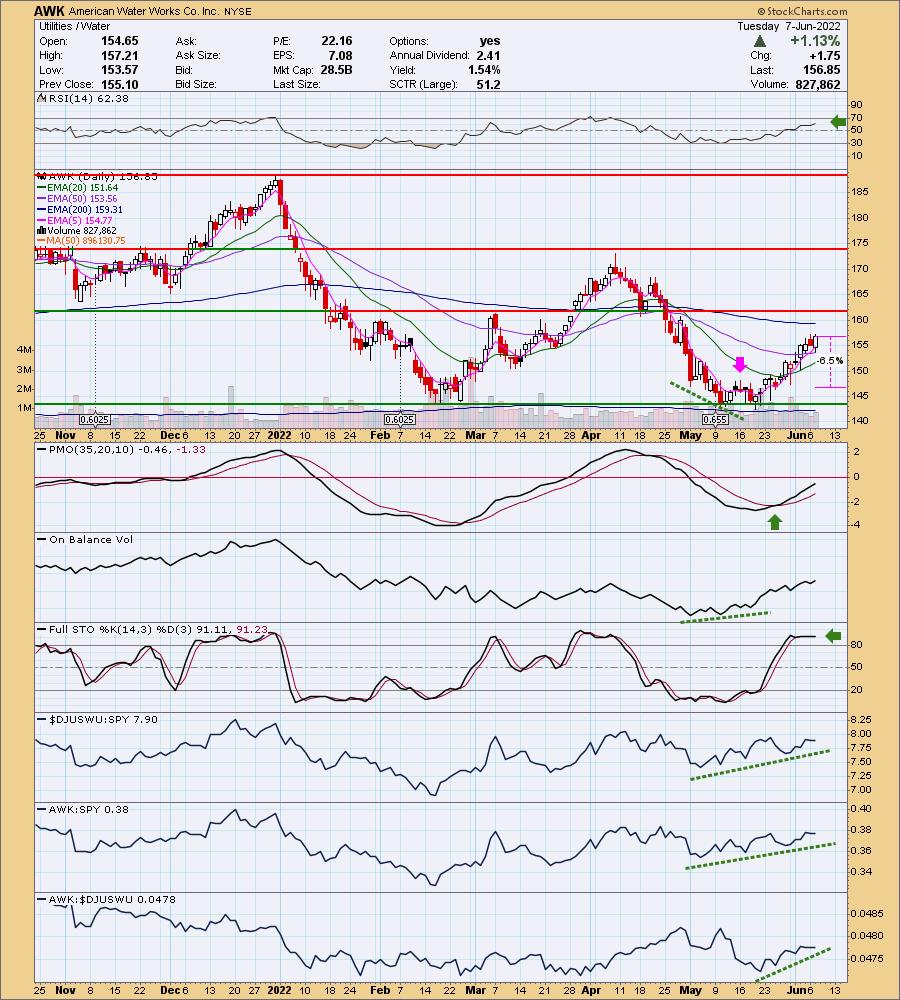
AWK is up +0.73% in after hours trading. I've covered AWK five times before. Most recently on March 8, 2022 (Nearly stopped out, but still open and up +1.7%). The other four times I covered it, only one of the positions remain open, May 26th 2020 and it is up +56.7% which is pretty good for a Utility stock. The other three times, October 1st 2020, January 7th 2021 and November 10th 2021, the positions were stopped out.
This extended rally began with a positive OBV divergence. Price made its way above the 20/50-day EMAs. Today it has a bullish engulfing candlestick suggesting higher prices again. The RSI is positive, rising and not overbought. The PMO is on a BUY signal. Notice that the PMO crossovers are "clean", no twitch or whipsaw since December of last year. This tells us we should be able to trust the PMO and should consider exiting if the PMO tops or generates a crossover SELL signal. Stochastics are very strong above 80 and relative strength is excellent in the short term. One issue I do have is that this is a defensive stock. If the market breaks out as we continue to believe it will, this one might lose momentum. The stop is set below that mid-May top that I've marked with a pink arrow. If you want to bring it down below the May low, it will be close to 9% which outside my typical stop zone of 6% to 8%.
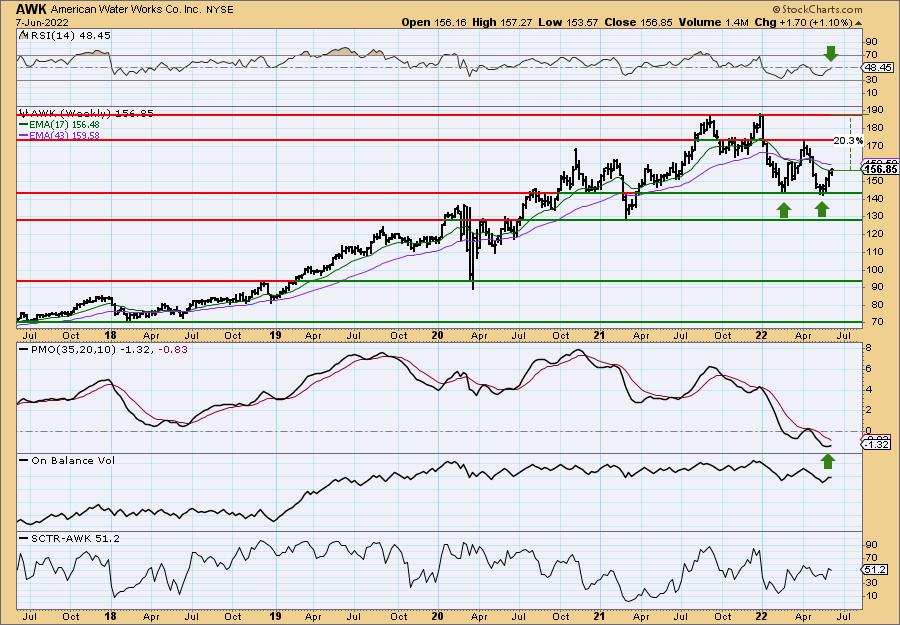
You have to love the double-bottom formation on the weekly chart. It won't be confirmed until it breaks out above the confirmation line, but it sure looks good. The weekly RSI is about to leave negative territory below net neutral (50) and the weekly PMO has turned up in very oversold territory. The SCTR isn't great. If it can reach the all-time high that's an over +20% gain. However, the minimum upside target of the pattern is around $200.
Generac Holdings Inc. (GNRC)
EARNINGS: 8/2/2022 (BMO)
Generac Holdings, Inc. engages in the design and manufacture of power generation equipment and other power products. It operates through the following segments: Domestic and International. The Domestic segment includes the legacy Generac, and the impact of acquisitions that are based in the U.S. and Canada. The International segment consists of the Ottomotores, Tower Light, Pramac, Motortech, and Selmec, Deep Sea, and Off Grid Energy businesses. The company was founded in 1959 and is headquartered in Waukesha, WI.
Predefined Scans Triggered: P&F Ascending Triple Top Breakout and P&F Double Top Breakout.
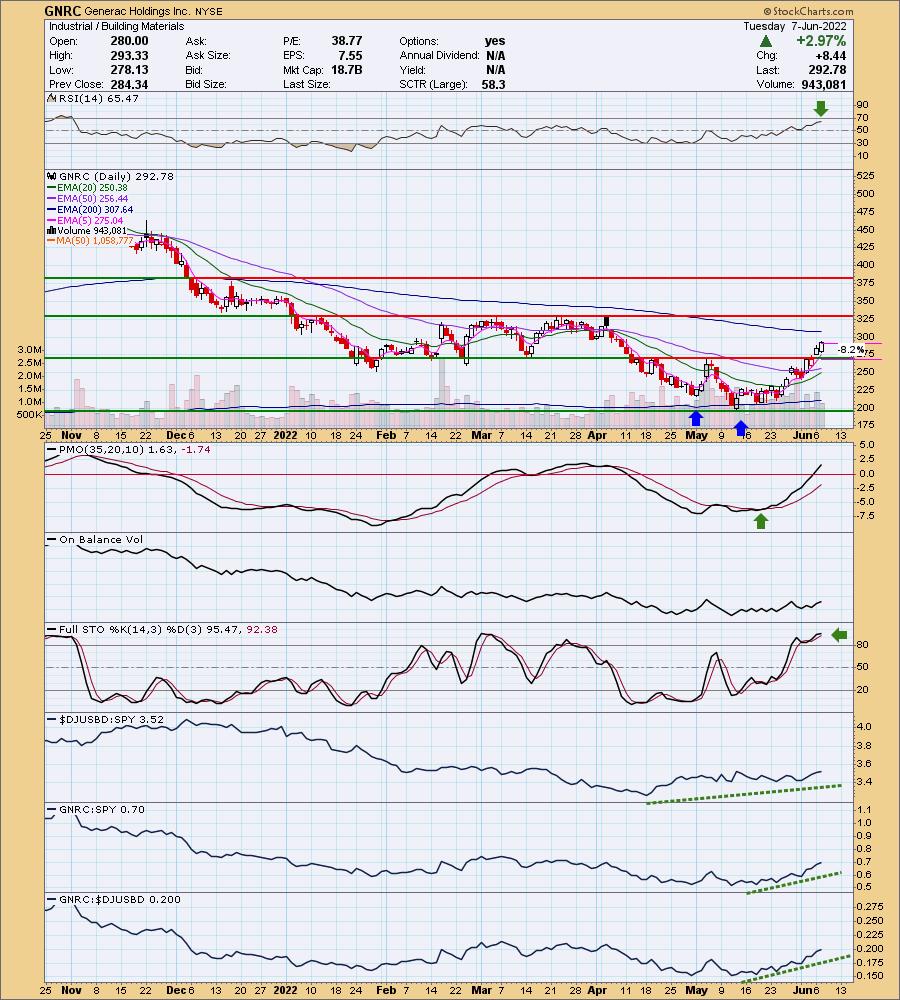
GNRC is up +0.04% in after hours trading. I've covered it twice before on August 6th, 2020 (Position open and up + 69.3%) and December 15th, 2020 (Position open and up +30.5%). I like the bullish double-bottom that was confirmed on yesterday's breakout. The RSI is positive and not overbought. The PMO is rising strongly and has moved above the zero line. Stochastics are above 80 and oscillating. Relative strength is continuing to improve. The stop is set just below the confirmation line of the double-bottom pattern.
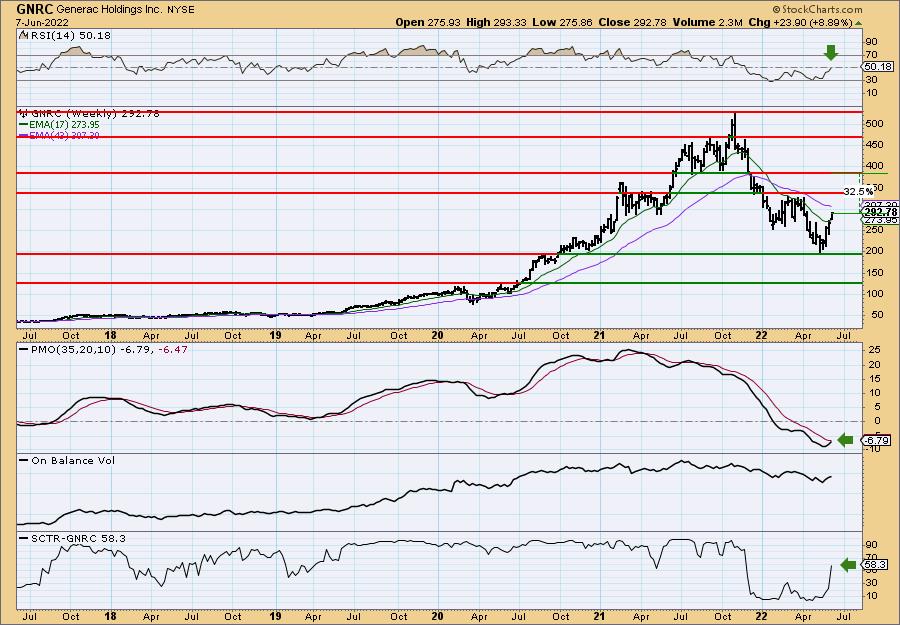
The weekly chart is getting better and better. The weekly RSI just hit positive territory and the weekly PMO is about to trigger a crossover BUY signal. The SCTR is rising strongly, but I'd like to see it get above 75%. If price hits the first line of resistance it would be a +17% gain, but I think it can move to the next level for a +32% gain.
I3 Verticals, Inc. (IIIV)
EARNINGS: 8/8/2022 (AMC)
i3 Verticals, Inc. is a holding company, which engages in the provision of integrated payment and software solutions to small-and medium-sized businesses and organizations in strategic vertical markets. It operates through the following segments: Merchant Services, Proprietary Software & Payments, and Others. The Merchant Services segment offers comprehensive payment solutions to businesses and organizations. The Proprietary Software & Payments segment delivers embedded payment solutions to clients through company-owned software. The Other segment covers corporate overhead expenses. The company was founded in 2012 and is headquartered in Nashville, TN.
Predefined Scans Triggered: New CCI Buy Signals, P&F Spread Triple Bottom Breakdown and P&F Double Bottom Breakout.
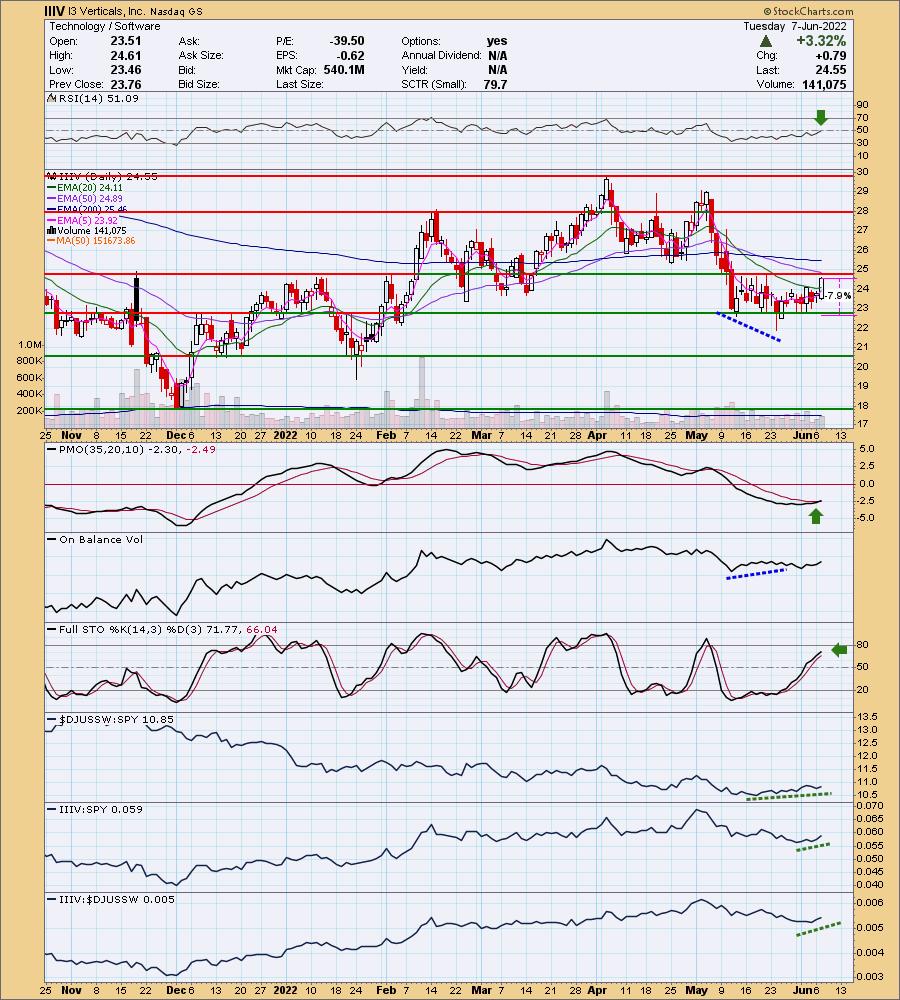
IIIV is unchanged in after hours trading. Strong breakout move above the 20-day EMA and closing price tops. Next resistance level is the 50-day EMA and the January tops. The RSI just hit positive territory and the PMO just triggered a crossover BUY signal today. What are the "conservative entries" on a 5-minute candlestick chart? This. New PMO crossover combined with a positive RSI. There is a positive OBV divergence that is setting the stage for a breakout. Stochastics are rising and near 80. Relative strength isn't fabulous but it is clearly improving. Considering this is a Software stock, it hasn't been beaten down like its brethren in the Technology sector. The stop is set below support.
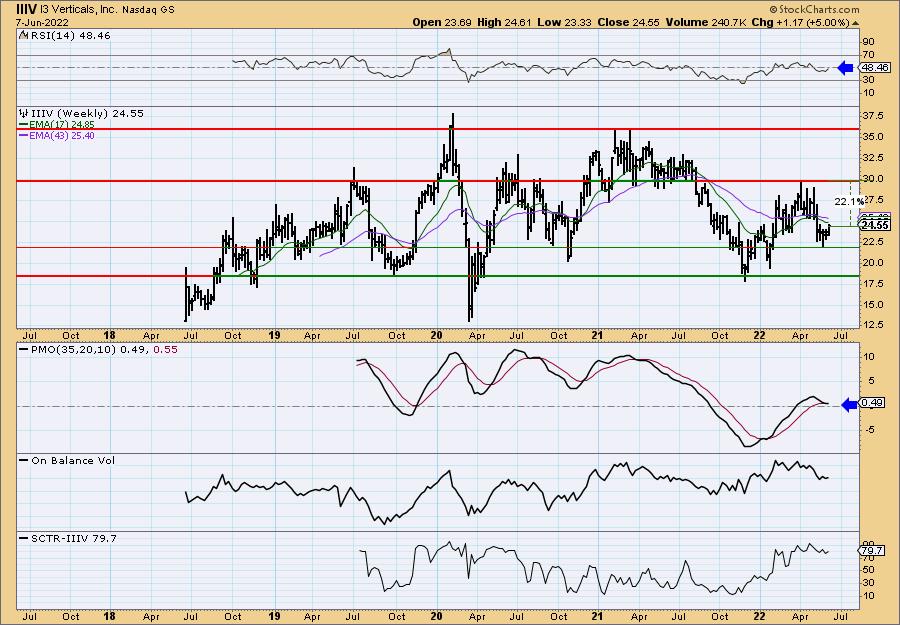
The weekly chart is turning around now that price has reversed. The weekly RSI is working its way toward net neutral (50) and the PMO has flattened in anticipation of a whipsaw crossover BUY signal. The SCTR is a healthy 79.7%. If price can reach this year's highs, it would be a 22%+ gain.
kforce.com, Inc. (KFRC)
EARNINGS: 8/1/2022 (AMC)
Kforce, Inc. engages in the provision of professional and technical staffing services and solutions. It operates through the Technology and Finance and Accounting (FA) segments. The Technology segment offers services on areas of information technology such as systems and applications architecture and development, data management, business and artificial intelligence, machine learning, and network architecture and security. The FA segment serves clients in areas such as accounting, transactional finance, financial analysis and reporting, taxation, budgeting, loan servicing, professional administration, audit services and systems, and controls analysis and documentation. The company was founded in 1962 and is headquartered in Tampa, FL.
Predefined Scans Triggered: Parabolic SAR Buy Signals and P&F Double Top Breakout.
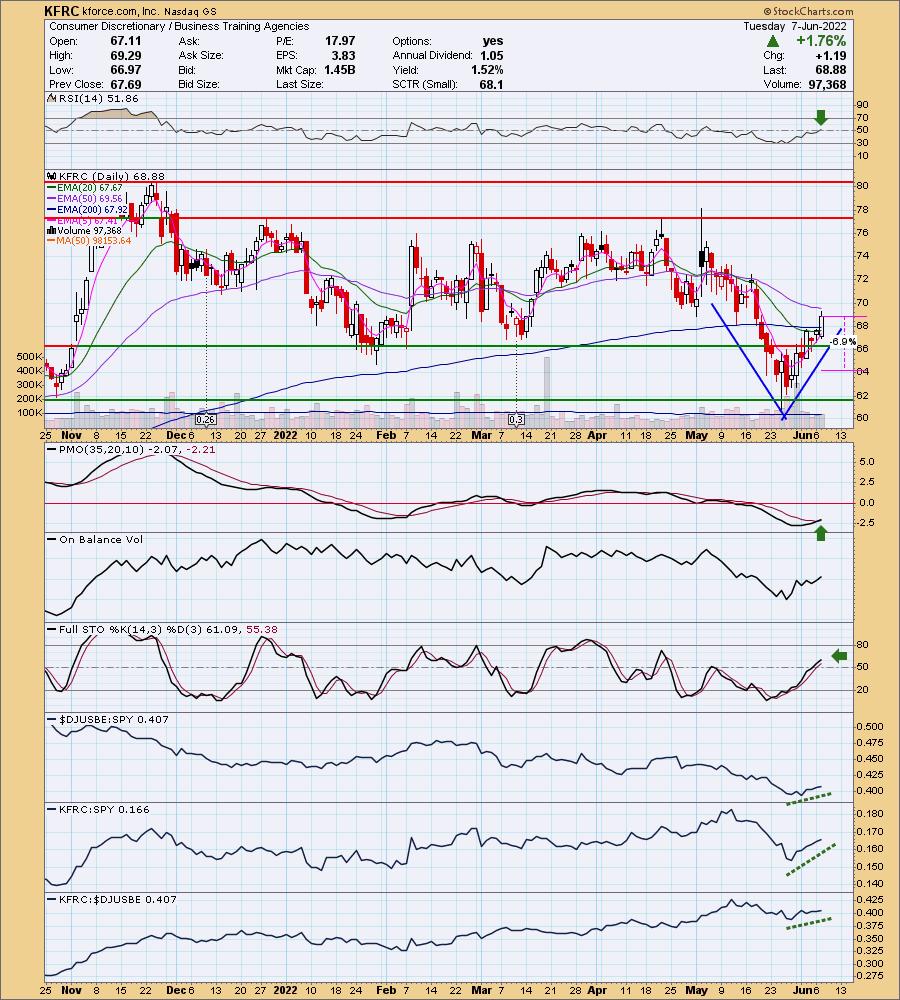
KFRC is unchanged in after hours trading. Price has formed a "V" bottom which is a highly bullish chart pattern. We have a bullish engulfing candlestick today and a breakout above the 20/200-day EMAs. The RSI is now positive and the PMO just triggered a crossover BUY signal. Stochastics are rising and relative strength is improving. These patterns suggest a move that would break above the left side of the "V". The stop is set below the January intraday low.
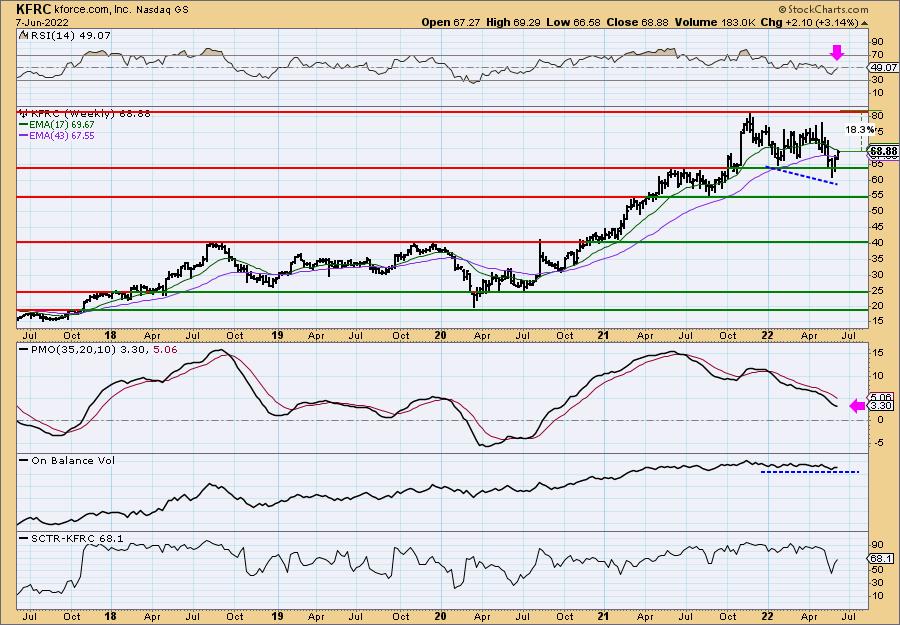
This one has been in a trading range all year and right now it is at the bottom of it; upside potential is over 18% if it returns to the top of the range. The weekly RSI is rising but hasn't gotten above 50 yet. The weekly PMO is technically declining after an overbought crossover SELL signal. It is beginning to decelerate. We have a positive OBV divergence that could lead to an extended rally. If it reaches all-time highs, that would be an 18.3% gain. However... This also looks like a large bull flag on the weekly chart and that would imply much higher gains.
Don't forget, on Thursdays I look at reader-requested symbols, click HERE to send me an email. I read every email I receive and try to answer them all!
Current Market Outlook:
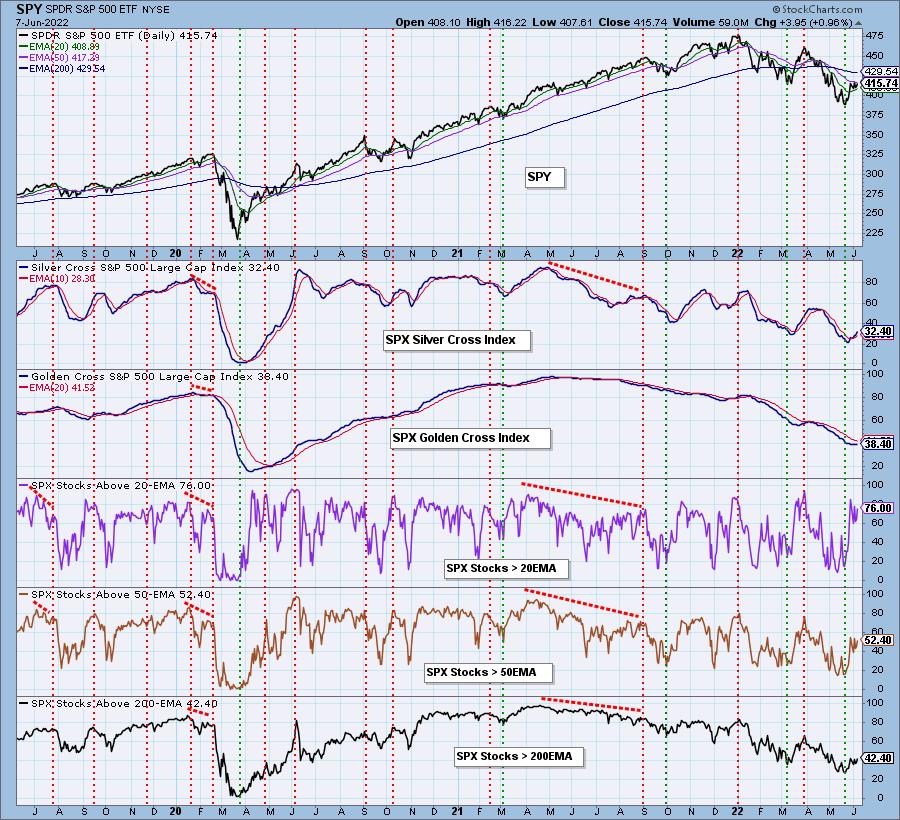
Market Environment: It is important to consider the odds for success by assessing the market tides. The following chart uses different methodologies for objectively showing the depth and trend of participation for intermediate- and long-term time frames.
- The Silver Cross Index (SCI) shows the percentage of SPX stocks on IT Trend Model BUY signals (20-EMA > 50-EMA)
- The Golden Cross Index (GCI) shows the percentage of SPX stocks on LT Trend Model BUY signals (50-EMA > 200-EMA)
Don't forget that as a "Diamonds" member, you have access to our GCI/SCI curated ChartList on DecisionPoint.com. You'll find it under "Members Only" links on the left side on the Blogs and Links Page.
Here is the current chart:
Full Disclosure: I'm 30% exposed with 70% in cash. I am planning to add to my Gold position using IAU. AWK is on my purchase list as well.
I'm required to disclose if I currently own a stock I mention and/or may buy/short it within the next 72 hours.
"Technical Analysis is a windsock, not a crystal ball." - Carl Swenlin
(c) Copyright 2022 DecisionPoint.com
Watch the latest episode of DecisionPoint with Carl & Erin Swenlin on Mondays 7:00p EST or on the DecisionPoint playlist on the StockCharts TV YouTube channel here!
NOTE: The stocks reported herein are from mechanical trading model scans that are based upon moving average relationships, momentum and volume. DecisionPoint analysis is then applied to get five selections from the scans. The selections given should prompt readers to do a chart review using their own analysis process. This letter is not a call for a specific action to buy, sell or short any of the stocks provided. There are NO sure things or guaranteed returns on the daily selection of "Diamonds in the Rough."
Helpful DecisionPoint Links:
DecisionPoint Shared ChartList and DecisionPoint Chart Gallery
Price Momentum Oscillator (PMO)
Swenlin Trading Oscillators (STO-B and STO-V)
For more links, go to DecisionPoint.com