
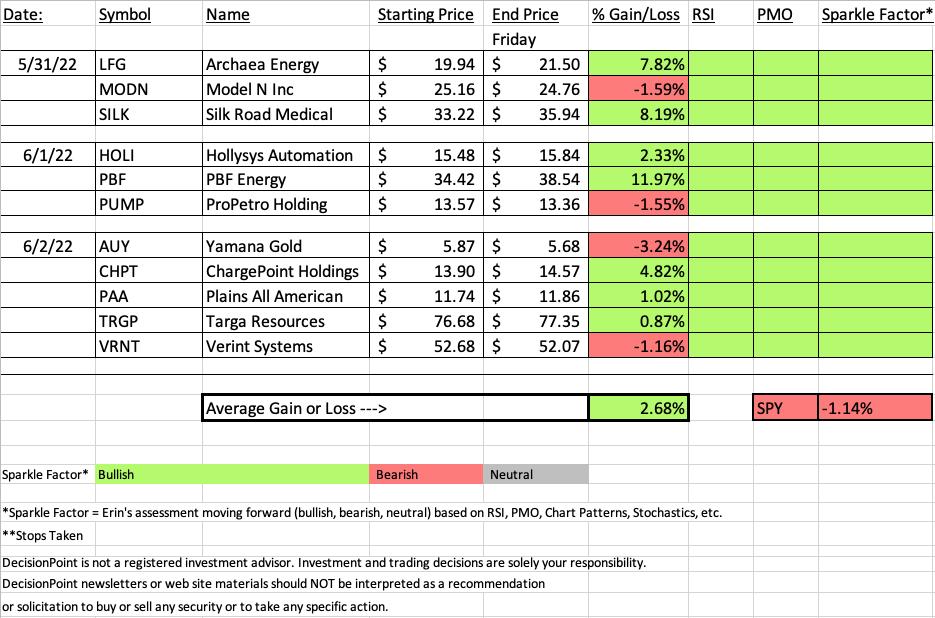
It was an excellent week for "Diamonds in the Rough". This week's "Darling" was up over 11% since Wednesday while the two runners-up were up 8.19% and 7.82%. But those weren't the only winners this week. This week's "Dud" was only down 3.24%.
It isn't a "typo" on the spreadsheet. Every single "Diamond in the Rough" this week have rising PMOs and positive RSIs, even the 'losers'. I believe that all this past week's "Diamonds in the Rough" have bullish Sparkle Factors. That means I believe all of these are still healthy.
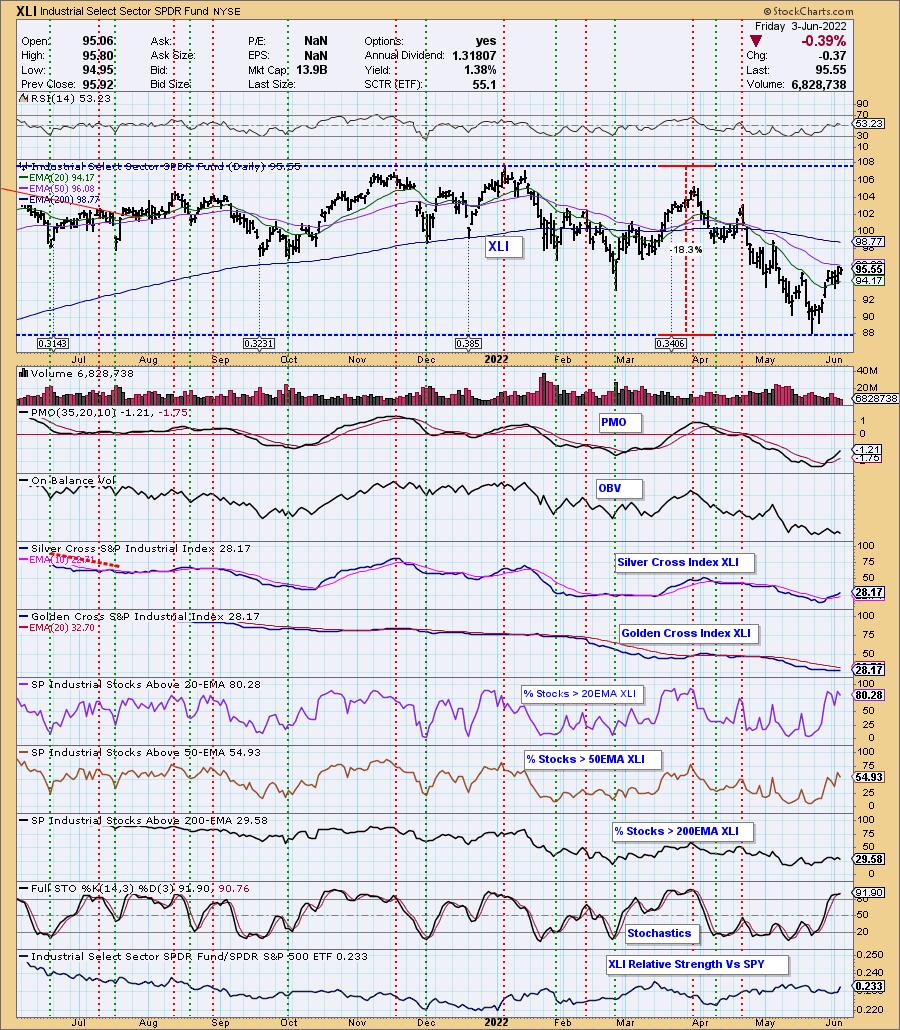
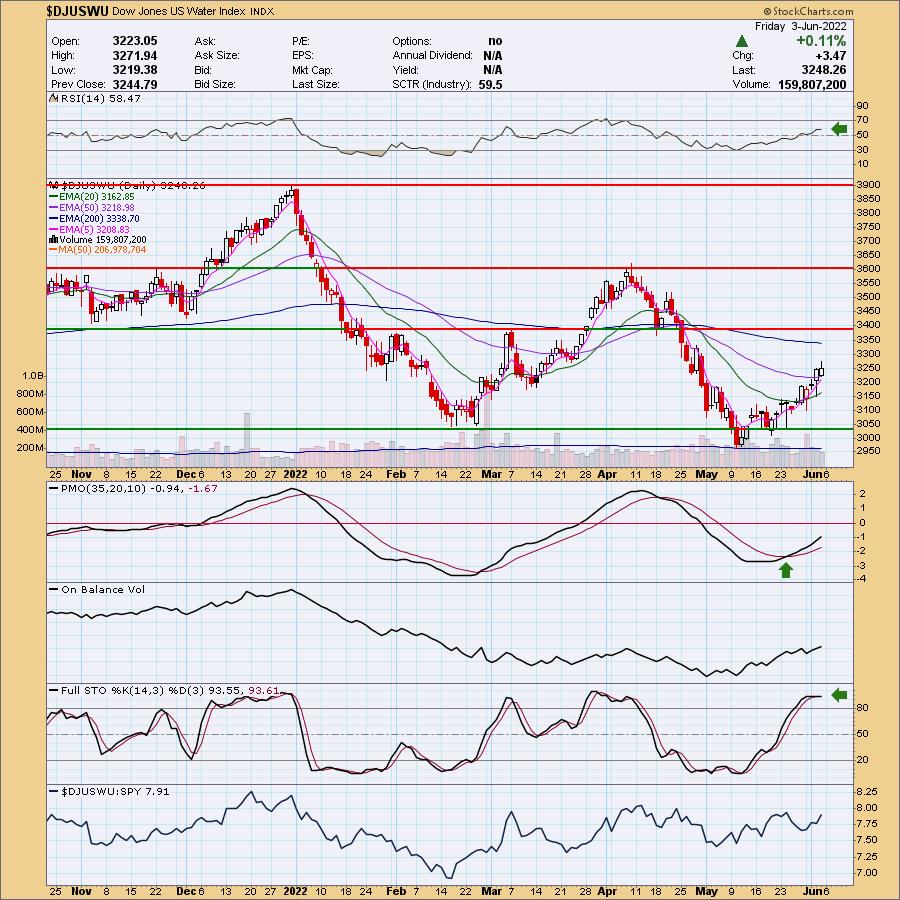
Diamond Mine attendees will see that I changed my mind on which sector to watch going into next week. This morning based on participation data from yesterday, I chose Materials (XLB). However, as of the close the Industrials sector (XLI) looks very good. I'm sticking to the Water Industry Group to Watch. There are some interesting groups in Industrials, Defense and Industrial Machinery looking especially interesting.
We rearranged the Diamond Mine presentation today with the general market overview and "sector/industry group to watch" done first, followed by a recap of the past week's "Diamonds in the Rough". We then spent the last portion of time on symbol requests. The room is getting much bigger so I can no longer guarantee all symbol requests will be covered. We managed today, but it did run over 10 minutes late.
See you in Monday's free trading room! Next Diamonds report will be on Tuesday, 5/31.
Erin

RECORDING LINK (6/3/2022):
Topic: DecisionPoint Diamond Mine (6/3/2022) LIVE Trading Room
Start Time: Jun 3, 2022 09:00 AM
Meeting Recording Link.
Access Passcode: June#3rd
REGISTRATION FOR Friday 6/10 Diamond Mine:
When: Jun 10, 2022 09:00 AM Pacific Time (US and Canada)
Topic: DecisionPoint Diamond Mine (6/10/2022) LIVE Trading Room
Register in advance for this webinar HERE.
Save the registration confirmation email with login instructions in case Zoom doesn't notify you in time.

Free DP Trading Room (5/23/2022) RECORDING LINK:
Topic: DecisionPoint Trading Room
Start Time: May 31, 2022 08:59 AM
Meeting Recording Link.
Access Passcode: May#31st
For best results, copy and paste the access code to avoid typos.
A few items about the spreadsheet: I've put on the spreadsheet whether the RSI is positive (green) or negative (red). The PMO column tells you if it is rising (green) or falling (red). Finally I've added my own "Sparkle Factor" that gives you my assessment going forward, bullish (green), bearish (red) or neutral (gray). The Sparkle Factor is basically my thoughts on whether I expect it to rise or fall. A neutral means it could really go either way so it could be added to a watch list. If you're in a stock I consider "neutral" going forward, the ball is in your court.
Darling:
PBF Energy Inc. (PBF)
EARNINGS: 7/28/2022 (BMO)
PBF Energy, Inc. engages in the operation of a petroleum refiner and supplies unbranded transportation fuels, heating oil, petrochemical feed stocks, lubricants, and other petroleum products in the United States. It operates through the following segments: Refining and Logistics. The Refining segment refines crude oil and other feed stocks into petroleum products. The Logistics segment owns, leases, operates, develops, and acquires crude oil and refined petroleum products terminals, pipelines, storage facilities, and logistics assets. The company was founded on March 1, 2008 and is headquartered in Parsippany, NJ.
Predefined Scans Triggered: Moved Above Upper Keltner Channel, Moved Above Upper Bollinger Band, P&F Ascending Triple Top Breakout and P&F Double Top Breakout.
Below are the commentary and chart from Wednesday (6/1/2022):
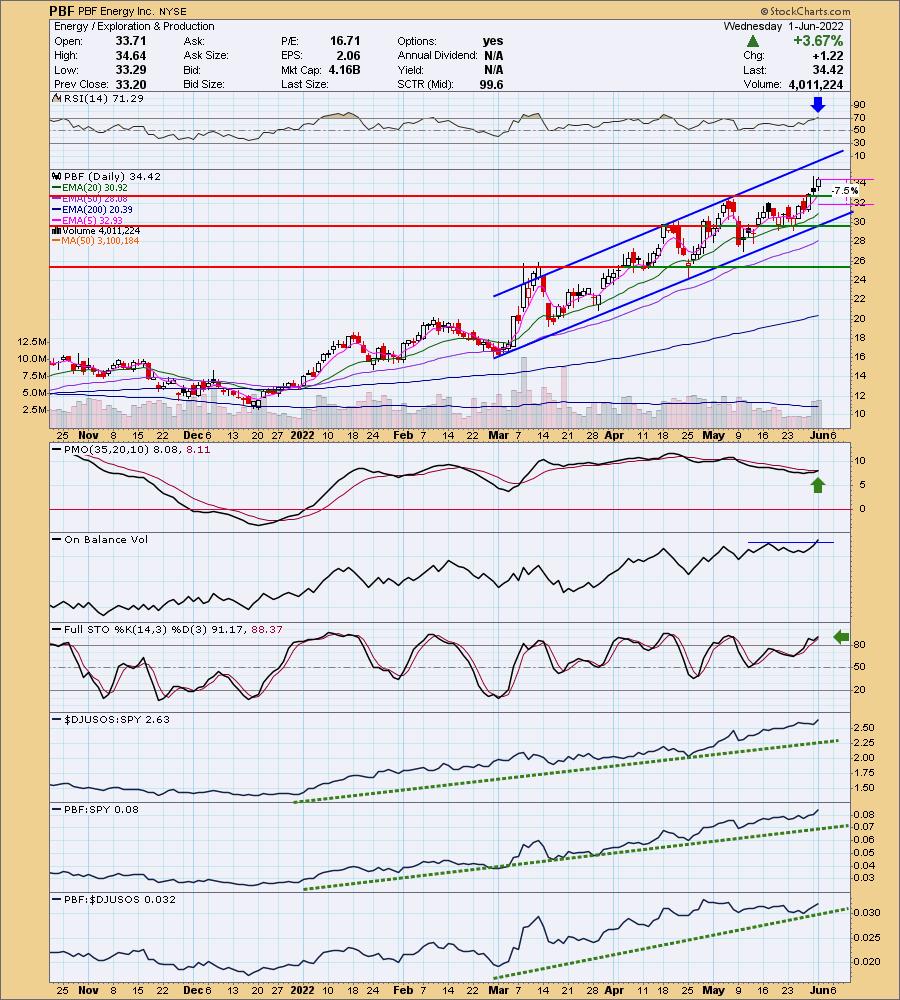
"PBF is up +1.07% in after hours trading. I've covered PBF three times before, May 6th 2021 (position closed), January 6th 2022 (position is up +123.5%) and May 3rd 2022 (position is up +13.0%). I know it has only been about a month since I presented this one, but it is worth a repeat on the recent breakout. The RSI just hit overbought territory, but this is likely a winner that will keep on winning. The PMO is about to trigger a crossover BUY signal. The OBV is confirming the breakout with a new high of its own. Stochastics are rising while oscillating above 80 telling us it has internal strength. Relative strength is excellent for this Energy stock. The stop is set below the early May top."
Here is today's chart:
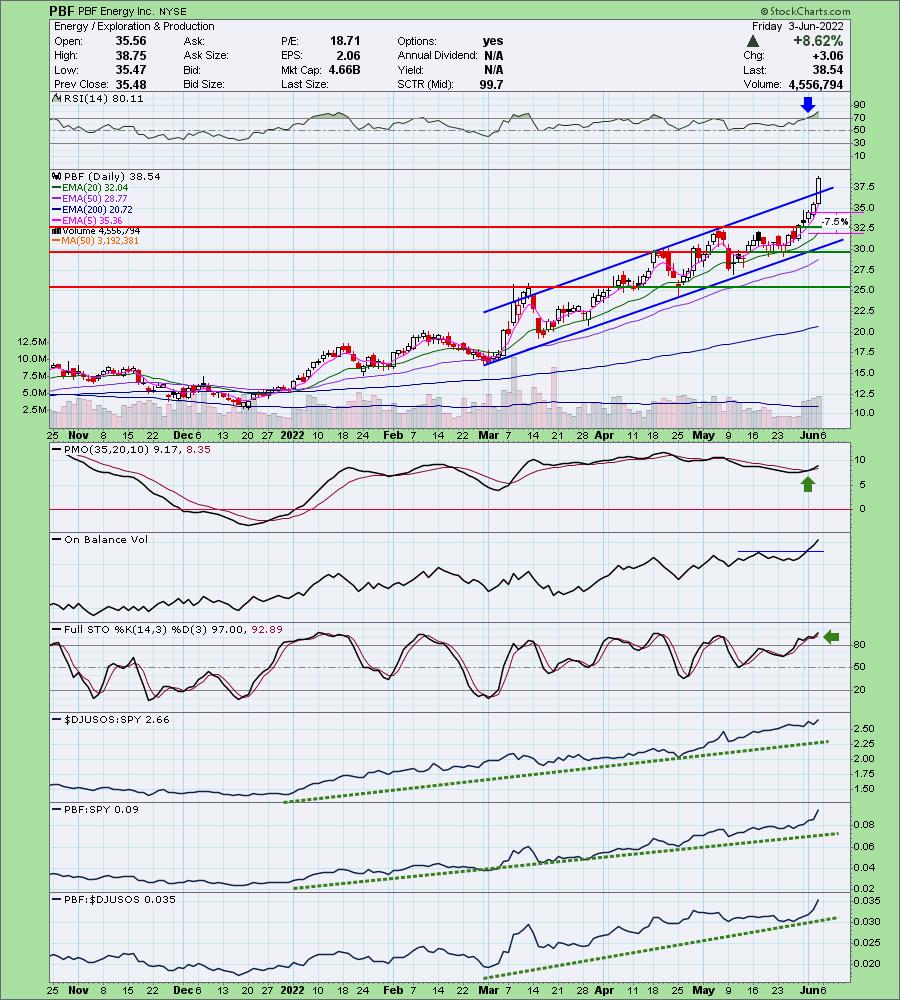
As with all of the "Darlings" this one just gets better with age. The only issue I have would be the upside breakout from an already rising trend channel. This is demonstrated by the now very overbought RSI. I don't think this one will fail, but it might need a pause soon. I own it and have the stop currently at $32.60.
Full Disclosure: I own PBF.
Don't forget, on Thursdays I look at reader-requested symbols, so shoot me an email at erin@decisionpoint.com. I read every email I receive and try to answer them all!
Dud:
Yamana Gold Inc. (AUY)
EARNINGS: 7/28/2022 (AMC)
Yamana Gold, Inc. engages in the production of gold, silver and copper. It operates through the following segments: El Peñón, Canadian Malartic, Jacobina, Minera Florida, Cerro Moro, Other Mines, and Corporate and Other. The company was founded by Peter Marrone on March 17, 1994 and is headquartered in Toronto, Canada.
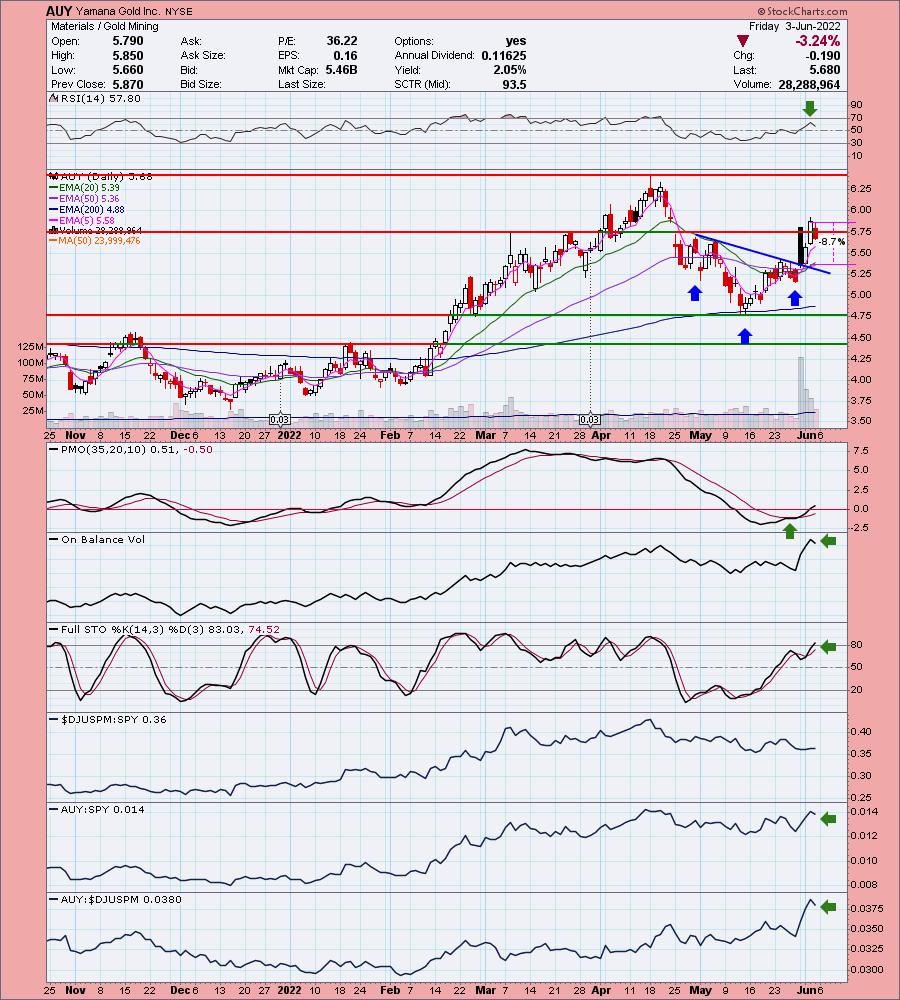
Predefined Scans Triggered: Moved Above Upper Bollinger Band, Stocks in a New Uptrend (Aroon), Moved Above Ichimoku Cloud, Moved Above Upper Price Channel and P&F Double Top Breakout.
Below are the commentary and chart from yesterday (6/2/2022):
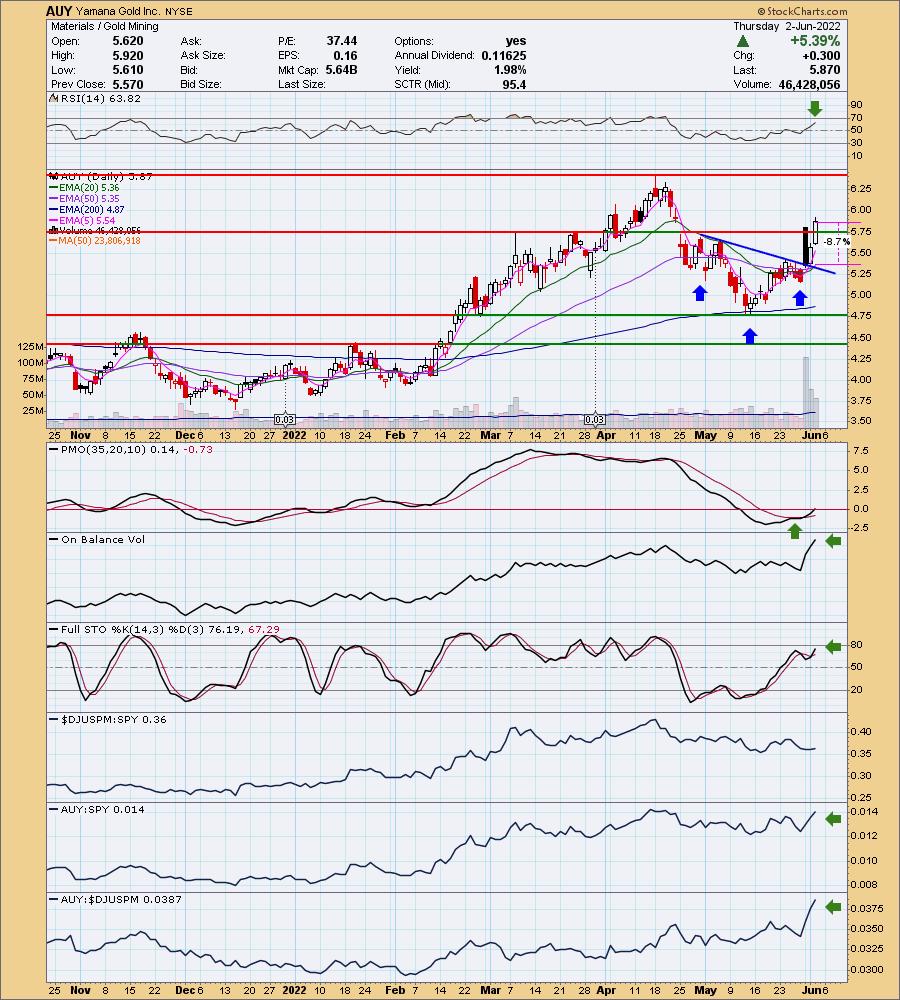
"AUY is down -0.17% in after hours trading. I've covered AUY on December 17th 2020 (Position is closed) and January 21st 2022 (Position closed frustratingly so. The stop barely triggered and then AUY was off to the races. Happens to the best of us.). I've been cautious on Gold Miners, but today's pop is changing my mind. AUY is a low priced Gold Miner so expect some volatility here. It formed a rather messy reverse head and shoulders, but Tuesday's bearish filled black candlestick helped it breakout above the neckline. Despite an ugly candlestick, price moved higher yesterday and then broke above resistance today. We have a Silver Cross BUY signal as the 20-day EMA crossed above the 50-day EMA. Volume is coming in big time. The RSI is positive and not overbought. The PMO is on a BUY signal and hit positive territory today. Stochastics are rising after bottoming in positive territory. Relative strength is kicking in for AUY as it is outperforming the industry group. I've set a deep stop that aligns with the 50-day EMA. I set it deeper partly because of today's 5%+ move and because I know this stock is volatile."
Here is today's chart:
The chart is suspect, but I still believe more upside is likely. This one in particular may not be the best choice given it is in the middle of a buy out/merger with current holders of AUY receiving 0.60 shares of GFI. I say that this one still has a green Sparkle Factor, but I would likely look to another Gold Miner given the shake up on this one.
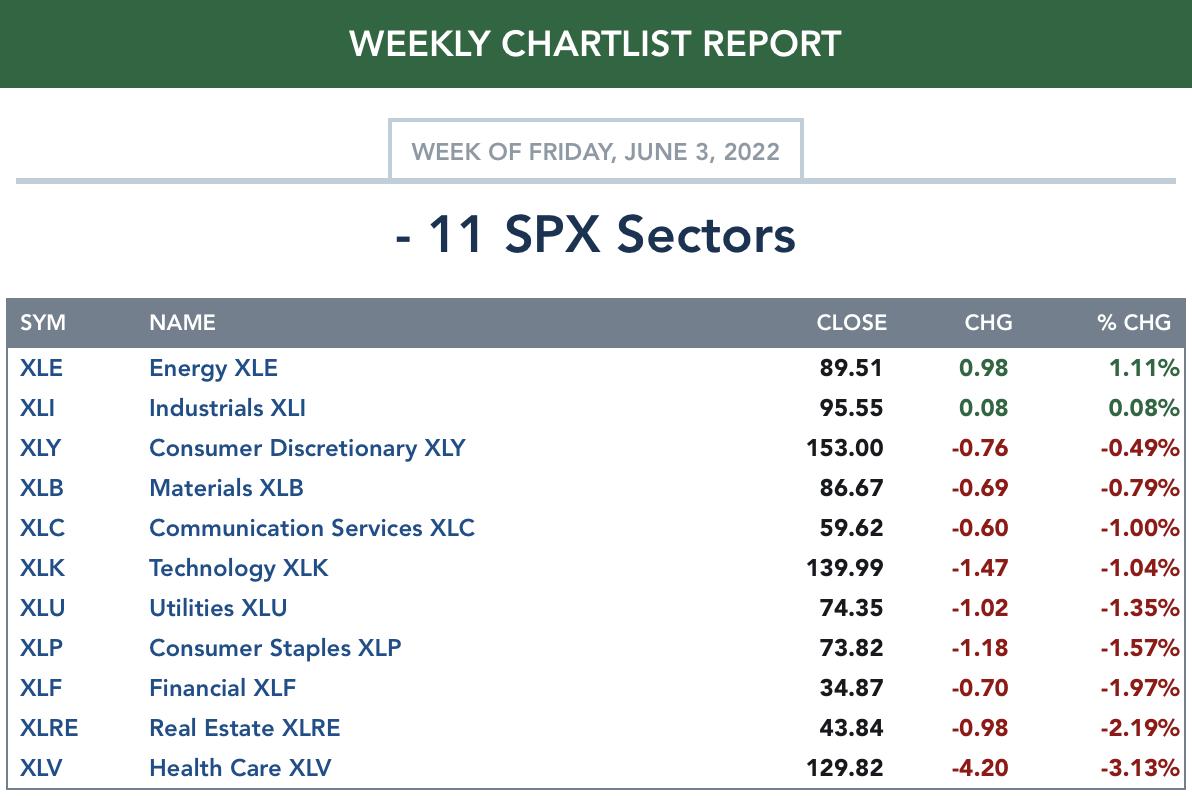
TODAY'S Sector Performance:
DecisionPoint Sector Scoreboard (Mechanical Trend Model Signals):

Click Here to view Carl's annotated Sector ChartList!
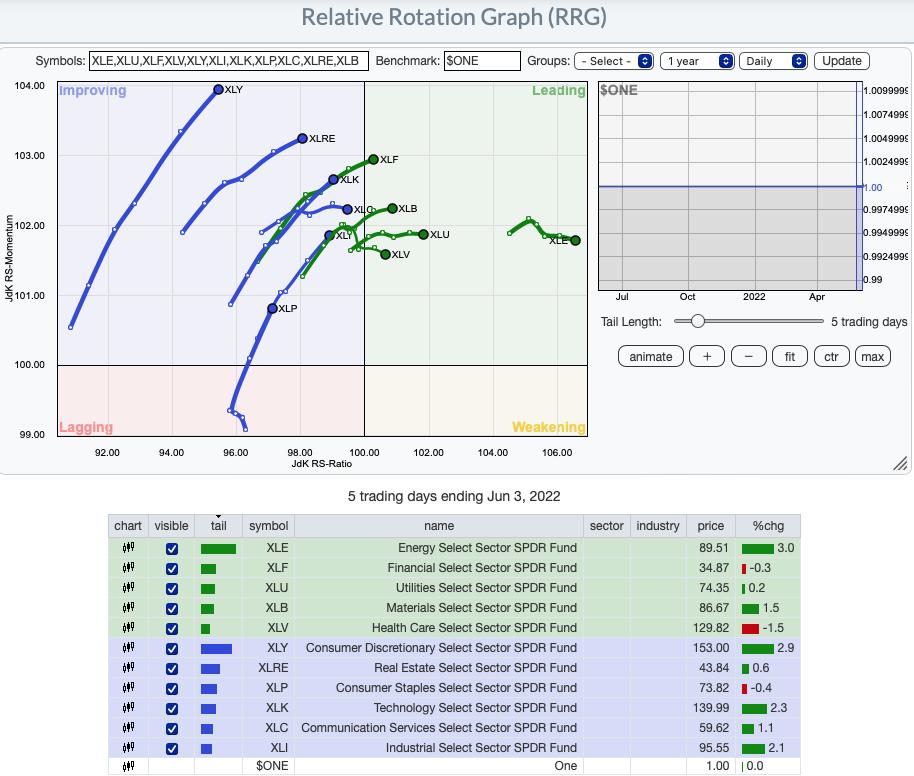
RRG® Daily Chart ($ONE Benchmark):
The daily RRG certainly suggests we are in a bear market rally. All sectors are are within the Improving quadrant or Leading quadrant. Nearly all have bullish northeast headings. Those that do not (XLC, XLV and XLE) are still looking strong given they all have easterly components to their headings.
RRG® Weekly Chart ($ONE Benchmark):
The weekly RRG shows all sectors with bearish southwest headings with the exception of XLE which is reversing back toward the Leading quadrant. We have short-term bullishness (daily RRG), but intermediate-term weakness (weekly RRG).
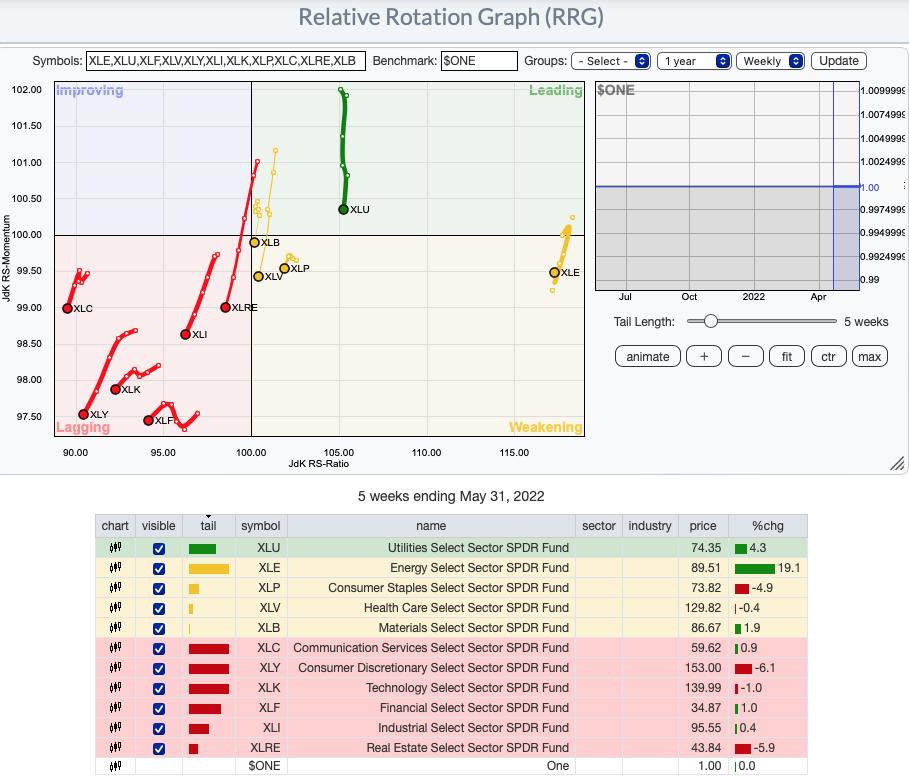
RRG® charts show you the relative strength and momentum for a group of stocks. Stocks with strong relative strength and momentum appear in the green Leading quadrant. As relative momentum fades, they typically move into the yellow Weakening quadrant. If relative strength then fades, they move into the red Lagging quadrant. Finally, when momentum starts to pick up again, they shift into the blue Improving quadrant.
CLICK HERE for an animated version of the RRG charts.
Sector to Watch: Industrials (XLI)
The tipping point for me that moved Industrials ahead of Materials as the "Sector to Watch" was the participation. Price action is pretty good although I would've preferred to see a breakout above the 50-day EMA. The RSI is positive and the PMO is rising strongly out of oversold territory. The SCI has had a positive crossover it signal line. 80% of stocks in XLI have price above the 20-day EMA and more than half are above their 50-day EMA. Both of those percentages are much higher than the SCI which leads me to believe the sector is showing momentum. Stochastics are strong and relative strength is beginning to pick up.
Industry Group to Watch: Water ($DJUSWU)
This is a steady rally on Water. Despite the lengthy rally the RSI is positive and not overbought. The PMO is on a crossover BUY signal. There is a giant double-bottom building. I don't know how drought conditions affect this index, but I know that California is only one of a handful of states that are going to ration water soon. Demand and short supply should keep prices rising. We looked for some stocks in this area. The major player is American Water Works (AWK) which looks much like this chart. Another candidate might be Essential Utilities (WTRG).
Go to our Sector ChartList on DecisionPoint.com to get an in-depth view of all the sectors.
Good Luck & Good Trading!
- Erin
erin@decisionpoint.com
Full Disclosure: I'm 30% exposed.
Watch the latest episode of DecisionPoint with Carl & Erin Swenlin on Mondays 7:00p EST or on the DecisionPoint playlist on the StockCharts TV YouTube channel here!
Technical Analysis is a windsock, not a crystal ball. --Carl Swenlin
NOTE: The stocks reported herein are from mechanical trading model scans that are based upon moving average relationships, momentum and volume. DecisionPoint analysis is then applied to get five selections from the scans. The selections given should prompt readers to do a chart review using their own analysis process. This letter is not a call for a specific action to buy, sell or short any of the stocks provided. There are NO sure things or guaranteed returns on the daily selection of "diamonds in the rough."
Helpful DecisionPoint Links:
DecisionPoint Shared ChartList and DecisionPoint Chart Gallery
Price Momentum Oscillator (PMO)
Swenlin Trading Oscillators (STO-B and STO-V)
(c) Copyright 2022 DecisionPoint.com