
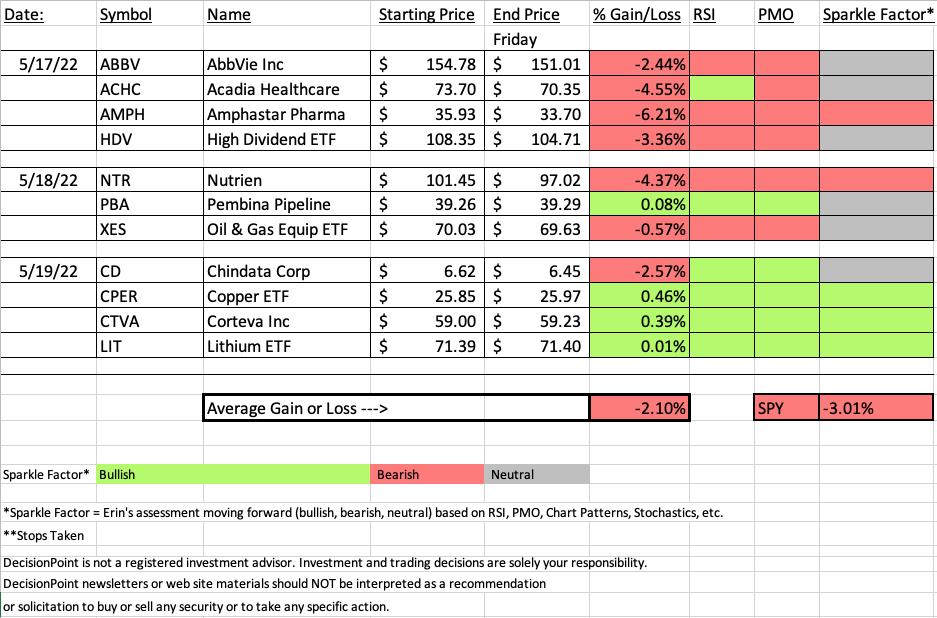
"Diamonds in the Rough" were mostly down on the week, but on average we did better than the SPY. As the title of today's edition implies and Shania Twain sings, "That Don't Impress Me Much". The biggest losers were from Tuesday where I picked Healthcare and a High Dividend ETF. Target upset the apple cart for high dividend payers in Consumer Staples. Healthcare is beginning to see some improvement, but the bear market black hole sucked our "Diamonds in the Rough" into its dark abyss.
There really isn't a "Sector to Watch" this week, but based on participation, I did bring one to the table. We teased out an industry group to watch for the week during today's Diamond Mine trading room that I'll share along with two symbols with fairly good chart setups.
This week's Darling was Copper (CPER) and it looks very good going forward, as does Lithium (LIT).
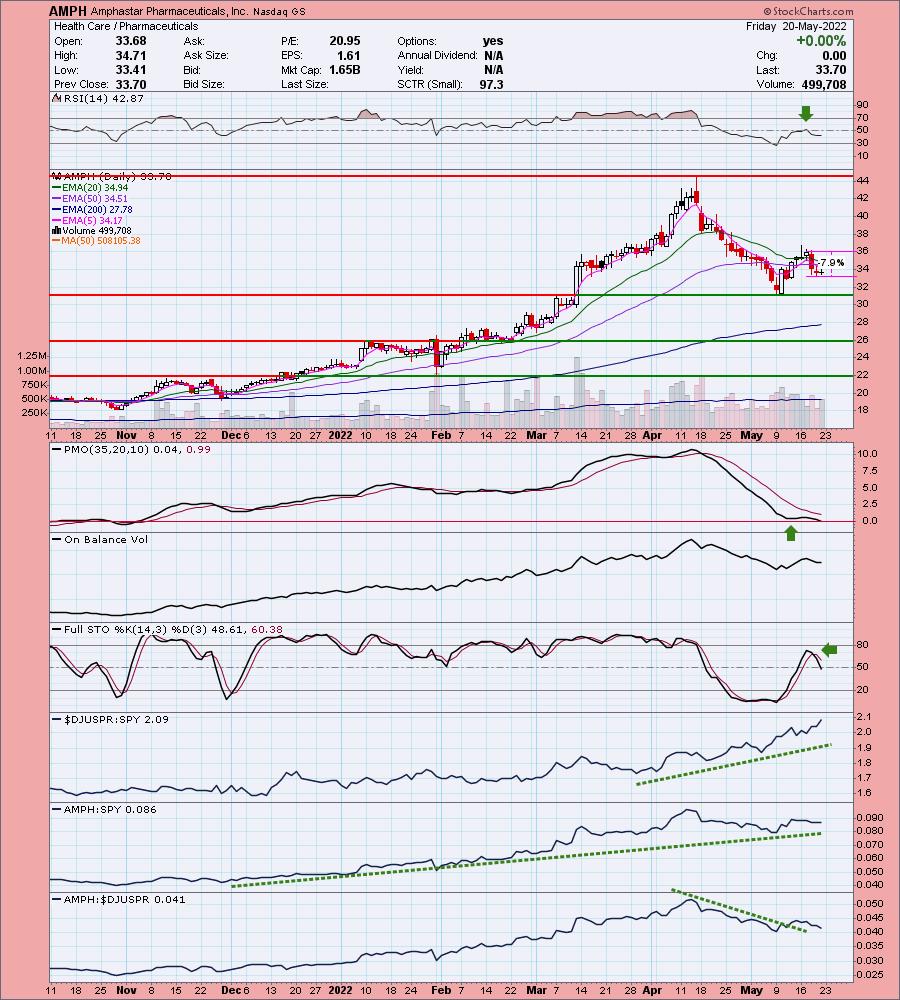
This week's dud was Amphastar Pharmaceuticals (AMPH). It didn't hit its stop level, but the chart went south in a hurry. Most of this week's Diamonds saw PMO tops beneath the signal line. It was clear during the trading room that we weren't the only ones caught in this week's big decline.
I will be traveling next week to Seattle, WA to see John Cleese and visit the StockCharts.com "Mother Ship". Therefore, reports might go out later than normal.
Have a great weekend! See you in Monday's free trading room! Next Diamonds report will be on Tuesday, 5/24.
Erin

RECORDING LINK (5/20/2022):
Topic: DecisionPoint Diamond Mine (5/20/2022) LIVE Trading Room
Start Time: May 20, 2022 09:00 AM
Meeting Recording Link.
Access Passcode: May#the20th
REGISTRATION FOR Friday 5/27 Diamond Mine:
When: May 27, 2022 09:00 AM Pacific Time (US and Canada)
Topic: DecisionPoint Diamond Mine 5/27/2022) LIVE Trading Room
Register in advance for this webinar HERE.
Save the registration confirmation email with login instructions in case Zoom doesn't notify you in time.

Free DP Trading Room (5/16/2022) RECORDING LINK:
Topic: DecisionPoint Trading Room
Start Time: May 16, 2022 08:59 AM
Meeting Recording Link.
Access Passcode: MondayMay#16
For best results, copy and paste the access code to avoid typos.
A few items about the spreadsheet: I've put on the spreadsheet whether the RSI is positive (green) or negative (red). The PMO column tells you if it is rising (green) or falling (red). Finally I've added my own "Sparkle Factor" that gives you my assessment going forward, bullish (green), bearish (red) or neutral (gray). The Sparkle Factor is basically my thoughts on whether I expect it to rise or fall. A neutral means it could really go either way so it could be added to a watch list. If you're in a stock I consider "neutral" going forward, the ball is in your court.
Darling:
United States Copper Fund (CPER)
EARNINGS: N/A
CPER tracks a rules-based index of copper futures contracts selected based on the shape of the copper futures curve. For more information click here.
Predefined Scans Triggered: Elder Bar Turned Green, Bullish MACD Crossovers, P&F Double Bottom Breakout and P&F Bull Trap.
Below are the commentary and chart from Thursday (5/19):
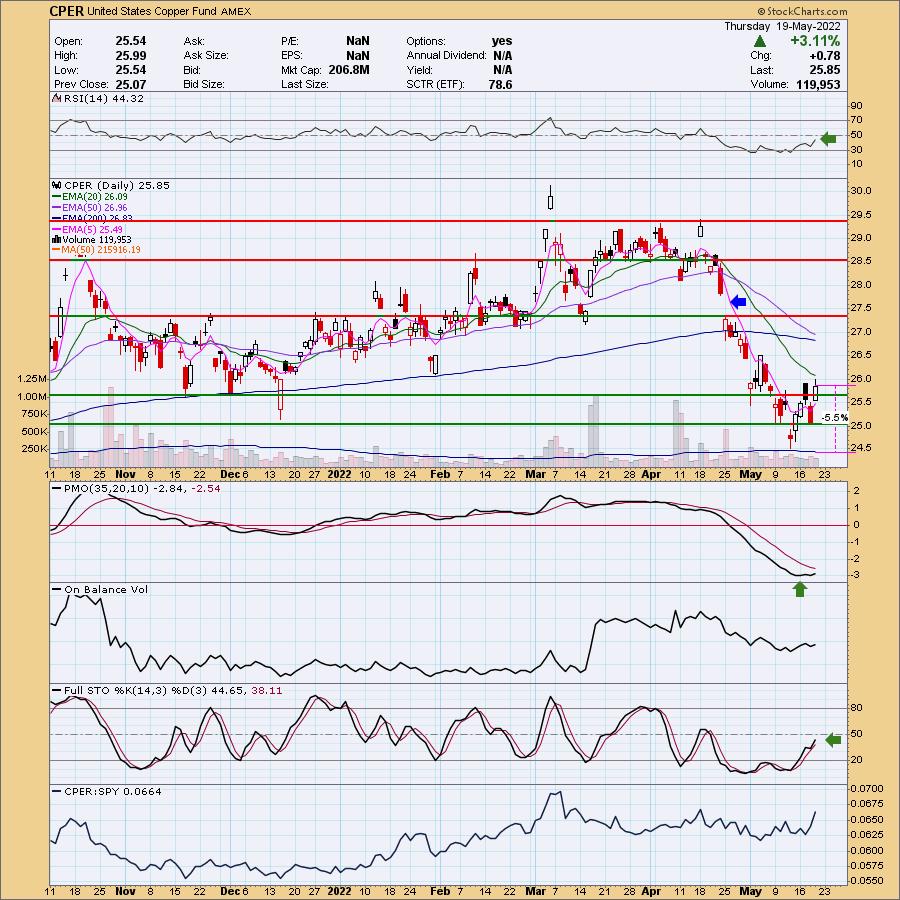
"CPER is down -0.31% in after hours trading. This one also has some serious overhead resistance to overcome as far as the EMAs. I can make out a short-term reverse head and shoulders. It's a rising neckline so the pattern hasn't executed yet. It will require price to overcome the 20-day EMA. Indicators are improving so this is entirely possible. The RSI is negative but rising toward net neutral (50). The PMO has turned up and is slowly making its way toward a crossover BUY signal. Stochastics are rising and should hit positive territory very soon. The stop can be tightly set at 5.5% beneath the May low."
Here is today's chart:
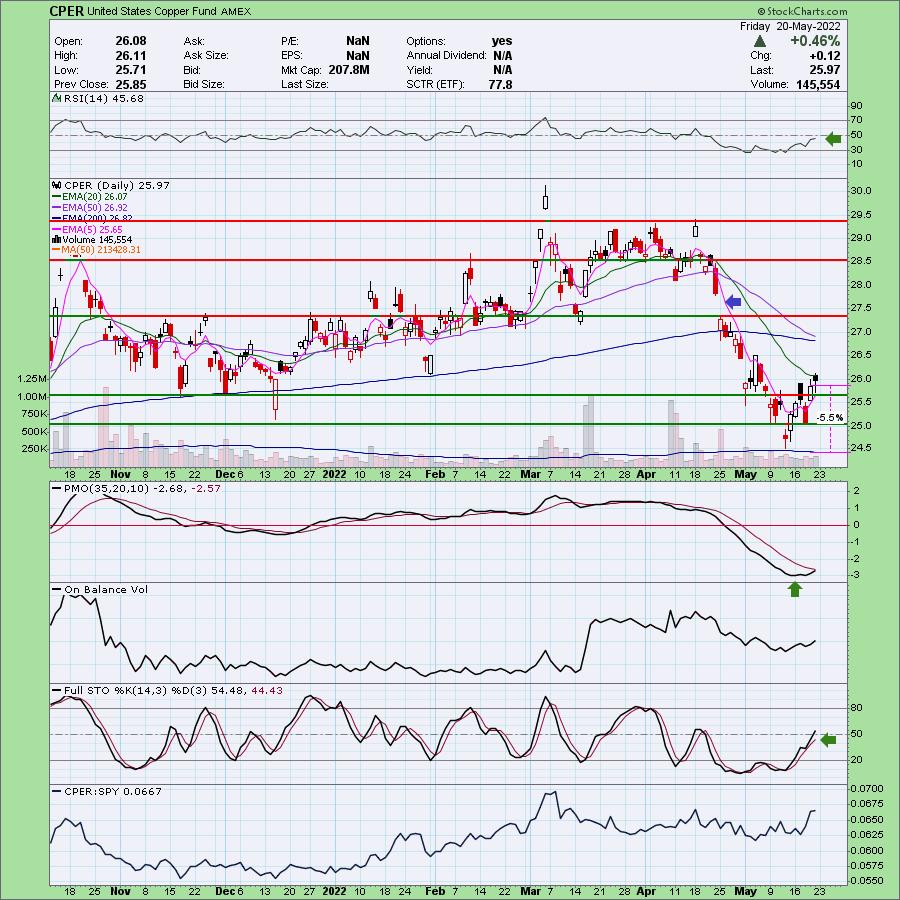
This price bottom looks good. Today filled black candlestick that occurred just below the 20-day EMA isn't very encouraging, but the indicators continue to firm up with a PMO crossover BUY signal just about to trigger. Stochastics continue to rise.
Don't forget, on Thursdays I look at reader-requested symbols, so shoot me an email at erin@decisionpoint.com. I read every email I receive and try to answer them all!
Dud:
Amphastar Pharmaceuticals, Inc. (AMPH)
EARNINGS: 8/8/2022 (AMC)
Amphastar Pharmaceuticals, Inc. engages in developing, manufacturing, marketing, and selling technically challenging generic and proprietary injectable, inhalation, and intranasal products, and insulin active pharmaceutical ingredient. It operates through Finished Pharmaceutical Products and Active Pharmaceutical Ingredients Products segments. The Finished Pharmaceutical Products segment manufactures, markets, and distributes Primatene Mist, enoxaparin, naloxone, phytonadione, lidocaine, and other critical and non-critical care drugs. The Active Pharmaceutical Ingredients Products segment offers RHI API and porcine insulin API for external customers and internal product development. The company was founded by Zi-Ping Luo and Yong Feng Zhang on February 29, 1996 and is headquartered in Rancho Cucamonga, CA.
Predefined Scans Triggered: Bullish MACD Crossovers.
Below are the commentary and chart from Tuesday 5/17:
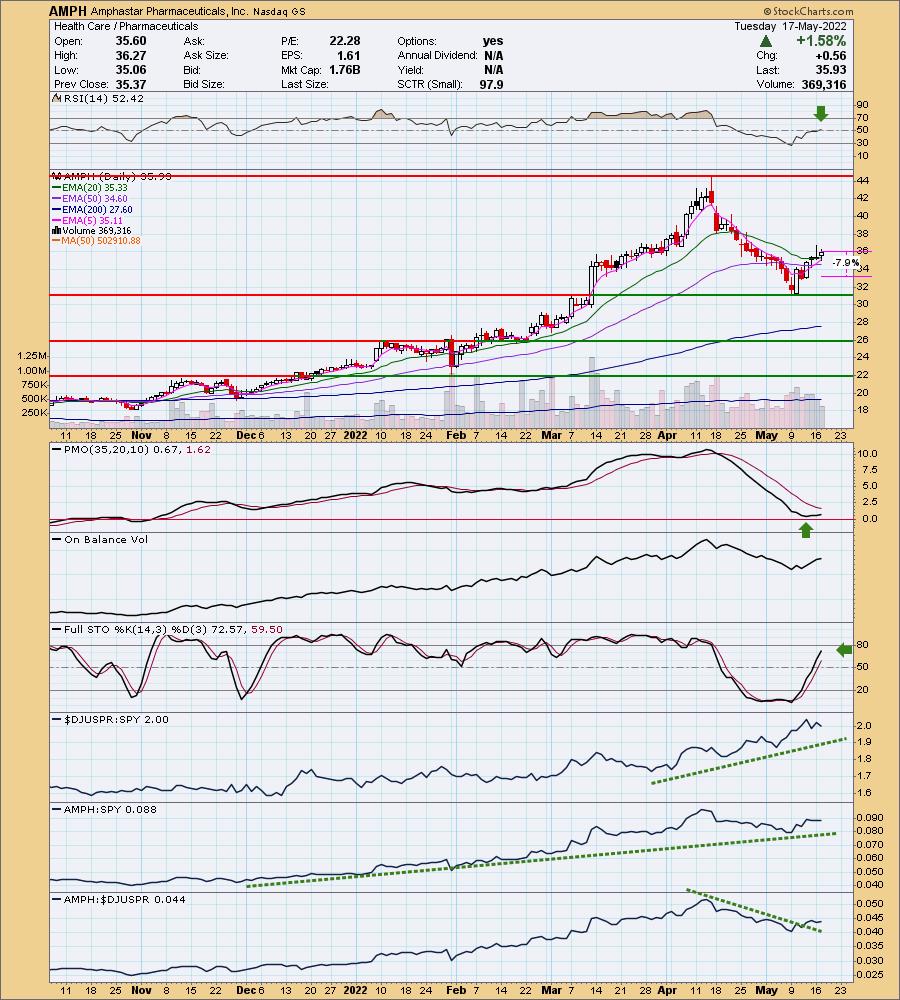
"AMPH is down -0.14% in after hours trading. It appears we have a "V" bottom developing. These patterns tell us that when we have 1/3rd retracement of the left side of the "V", we can expect a rally and breakout above the top of the left side of the "V". The RSI just moved into positive territory. Price has overcome resistance at key moving averages. The PMO bottomed above the signal line and is rising toward a crossover BUY signal. Note that the MACD did have a positive crossover today based on the predefined scan that triggered today. Stochastics are rising nicely and should get above 80 soon. The group is seeing strength and AMPH is outperforming the SPY. It hasn't been the best performer among its peers in the group, but that appears to be changing. The stop can be set tighter below the 50-day EMA, but I opted to stretch it out a bit more to avoid being stopped out if we see more volatility within the market."
Here is today's chart:
I should've ditched this one when I saw that it was underperforming its group but it did appear ready to break that declining trend on the relative strength line. It wasn't good enough. The stop nearly triggered today. I expect it will on Monday given the PMO is now about to cross below the zero line and RSI is flat and firmly in negative territory below net neutral (50). The PMO, like many of this week's "Diamonds in the Rough", topped below its signal line which adds another bearish layer. It could be interesting to put on a watch list as a successful test of $31 might make this a good short-term trade.
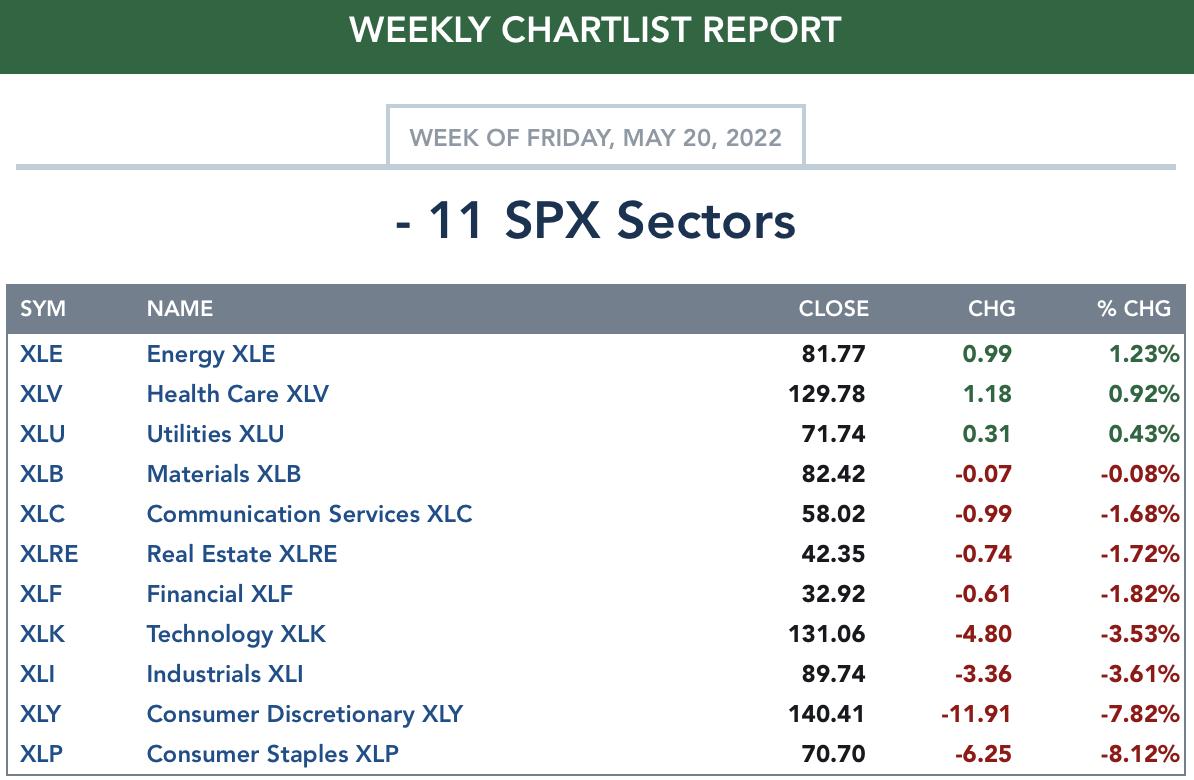
TODAY'S Sector Performance:
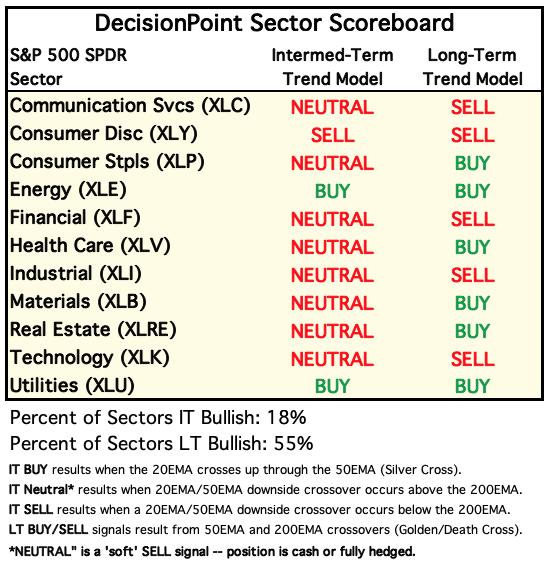
DecisionPoint Sector Scoreboard (Mechanical Trend Model Signals):
Click Here to view Carl's annotated Sector ChartList!
$ONE is the current benchmark on the RRGs:
It occurred to Carl and I that using the SPY as a benchmark is useless right now. The SPY is in a bear market so sectors could be moving lower, but still outperform the SPY. One way to get around this problem is to use $ONE was the benchmark. By using $ONE, you get to see ACTUAL performance in relation to other sectors. The picture is completely different, but far more accurate. We have decided to only use the $ONE Daily and Weekly version of the RRG.
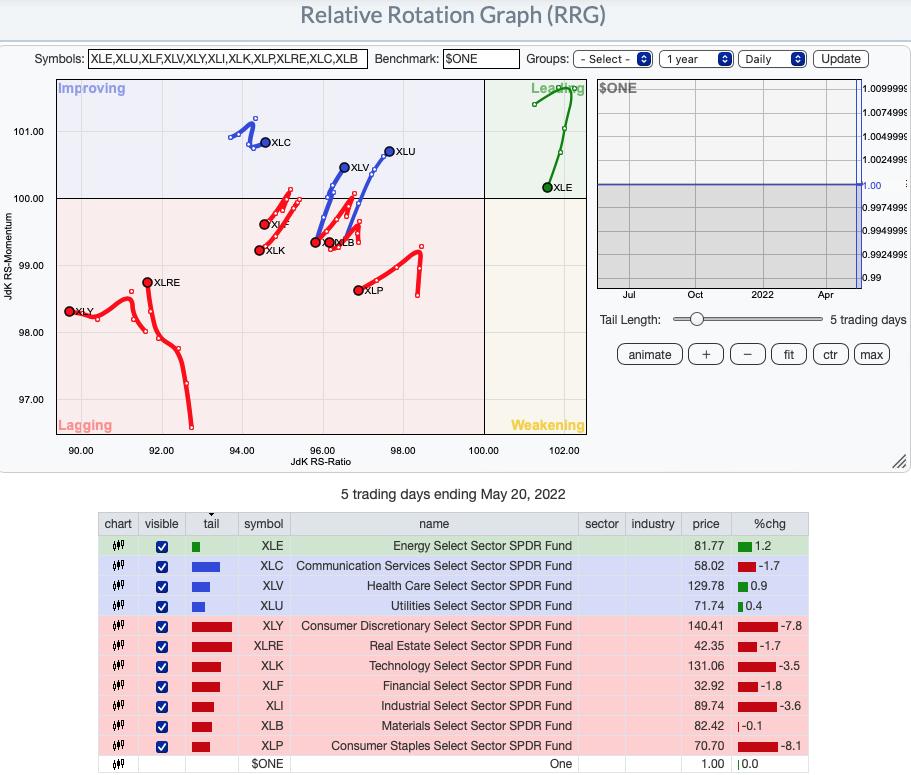
RRG® Daily Chart ($ONE Benchmark):
The daily RRG tells us that the most bullish sectors are Energy (XLE) which resides in the Leading quadrant and Communication Services (XLC), Healthcare (XLV) and Utilities (XLU). Of the four, XLE has a bearish southwest heading and should hit the Weakening quadrant soon if the rally doesn't resume. The other three are not yet in the Leading quadrant, but they do have bullish northeast headings. Of the four, XLU is nearest to Leading and has a slight advantage over the other two.
The remaining sectors are all in the Lagging quadrant. XLRE is showing improvement as it moves northward toward the Improving quadrant, but all of the others have bearish southwest headings.
RRG® Weekly Chart ($ONE Benchmark):
None of the sectors have bullish northeast headings with the exception of XLC which has reversed and is headed toward the Improving quadrant.
Of those in the Leading quadrant, XLB is maintaining a precarious position in the quadrant. XLV and XLU are headed toward the Weakening quadrant where they will join XLP and XLE. XLE is moving quickly into Weakening. Crude Oil has been consolidating sideways which likely has affected the position of XLE. XLP does have a northward component to its heading. However, it will need more than what it is seeing if it wants to enter the Leading quadrant.
The remaining sectors are in the Lagging quadrant. We already noted XLC's bullish northeast heading. XLF and XLK are also swinging back toward Improving. Unfortunately, it will take a lot of improvement to get into the Improving quadrant and looking at those sector charts leaves us pessimistic.
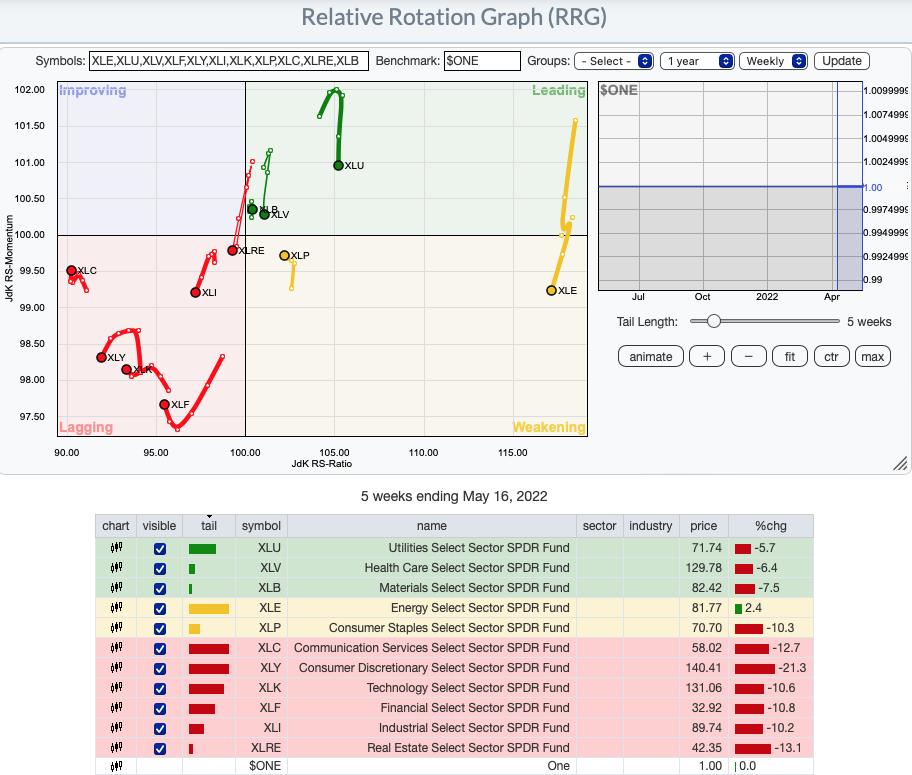
RRG® charts show you the relative strength and momentum for a group of stocks. Stocks with strong relative strength and momentum appear in the green Leading quadrant. As relative momentum fades, they typically move into the yellow Weakening quadrant. If relative strength then fades, they move into the red Lagging quadrant. Finally, when momentum starts to pick up again, they shift into the blue Improving quadrant.
CLICK HERE for an animated version of the RRG charts.
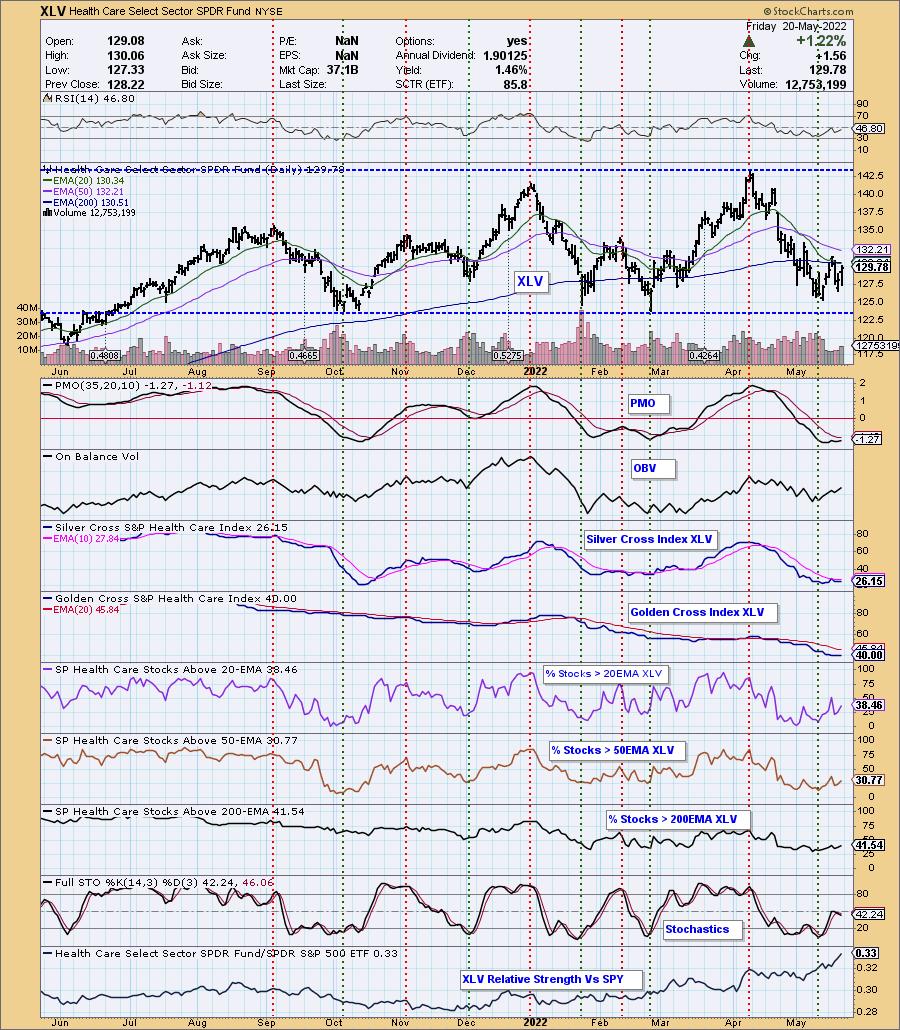
Sector to Watch: Healthcare (XLV)
After reviewing all of indicators on all of the sectors, I narrowed it down to XLC, XLV and XLU. There were two reasons I was swayed toward XLV. First, participation is improving with %Stocks > 20-day EMA higher than %Stocks > 50-day EMA (XLU doesn't have this). Next was a foundation of participation, meaning %Stocks > 20/50/200-day EMAs were above 30%. XLC has %Stocks > 20-day EMA above the %Stocks > 50-day EMA, but overall participation is in the "teens".
Overhead resistance is still a problem for XLV at the 200-day EMA. The RSI is still negative and Stochastics have turned down in negative territory (this is true for all of the sectors). If you're going to nibble, this is a sector to consider, but overall it's a good idea to keep exposure low.
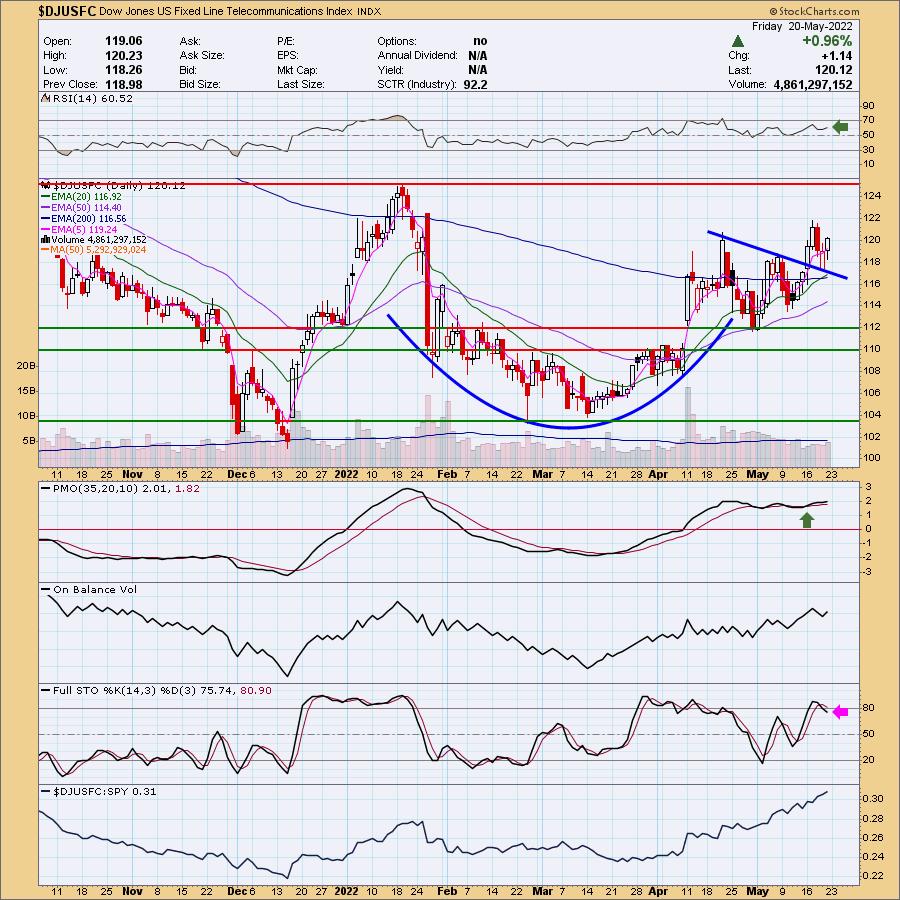
Industry Group to Watch: Fixed Line Telecom ($DJUSFC)
I went outside of Healthcare for this group as the groups within Healthcare are okay with Pharma looking best. This is one of the few industry groups with a bullish configuration. I like the cup and handle pattern that is executing on the latest rising trend. The PMO is rising and the RSI is positive. Stochastics have topped which isn't great, but you can see the outperformance here. Two symbols I liked this morning were AT&T (T) and Telefonica Brasil SA (VIV).
Go to our Sector ChartList on DecisionPoint.com to get an in-depth view of all the sectors.
Good Luck & Good Trading!
- Erin
erin@decisionpoint.com
Full Disclosure: I'm 25% exposed to the market with 15% on the short side.
Watch the latest episode of DecisionPoint with Carl & Erin Swenlin on Mondays 7:00p EST or on the DecisionPoint playlist on the StockCharts TV YouTube channel here!
Technical Analysis is a windsock, not a crystal ball. --Carl Swenlin
NOTE: The stocks reported herein are from mechanical trading model scans that are based upon moving average relationships, momentum and volume. DecisionPoint analysis is then applied to get five selections from the scans. The selections given should prompt readers to do a chart review using their own analysis process. This letter is not a call for a specific action to buy, sell or short any of the stocks provided. There are NO sure things or guaranteed returns on the daily selection of "diamonds in the rough."
Helpful DecisionPoint Links:
DecisionPoint Shared ChartList and DecisionPoint Chart Gallery
Price Momentum Oscillator (PMO)
Swenlin Trading Oscillators (STO-B and STO-V)
(c) Copyright 2022 DecisionPoint.com