
Materials (XLB) was the winning sector today. It beat out second place Healthcare (XLV) by over a half percent. It didn't surprise me to see some Materials stocks on the lists of readers. I also have an interesting request from the beat down Technology sector.
I have to say that all of these stocks today are 'reversal plays'. These stocks are not in intermediate-term rising trends. Most of them are testing support. However, I'm with the readers, Materials are showing promise. I didn't have any Gold Miners requested, but that group just got a big boost today at an important support level. It is a big time reversal play so position size wisely if you're going in on a beat down stock or ETF.
Hope to see you in the Diamond Mine trading room tomorrow at Noon ET! It promises to be an interesting trading day to finish out the week. Remember you'll find all the links to recordings and trading room registration links in EVERY DP Diamonds report. Also, if you don't get an email, all of our reports are on the "Blogs and Links" page on DecisionPoint.com. You can also find links there to our archive of reports going back to 2019. See what the indicators and picks looked like during key pivot points in the market by going through these archives.
Here is the link to tomorrow's trading room. It is also below.
Good Luck & Good Trading,
Erin
Today's "Diamonds in the Rough": CD, CPER, CTVA and LIT.

RECORDING LINK (5/13/2022):
Topic: DecisionPoint Diamond Mine (5/13/2022) LIVE Trading Room
Start Time: May 13, 2022 09:00 AM
Meeting Recording Link.
Access Passcode: May@0513
REGISTRATION FOR Friday 5/20 Diamond Mine:
When: May 20, 2022 09:00 AM Pacific Time (US and Canada)
Topic: DecisionPoint Diamond Mine (5/20/2022) LIVE Trading Room
Register in advance for this webinar HERE.
** Save the registration confirmation email with login instructions in case Zoom doesn't notify you in time.**

Free DP Trading Room (5/16) RECORDING LINK:
Topic: DecisionPoint Trading Room
Start Time: May 16, 2022 08:59 AM
Meeting Recording Link.
Access Passcode: MondayMay#16
For best results, copy and paste the access code to avoid typos.
Welcome to DecisionPoint Daily Diamonds, wherein I highlight ten "Diamonds in the Rough" per week. These are selected from the results of my DecisionPoint Scans, which search for stocks that could benefit from the trend and condition of the market. Remember, these are not recommendations to buy or sell, but are the most interesting of the stocks that surfaced in my scans. My objective is to save you the work of the initial, tedious culling process, but you need to apply your own analysis to see if these stocks pique your interest as well. There are no guaranteed winners here!
"Predefined Scans Triggered" are taken from StockCharts.com using the "Symbol Summary" option instead of a "SharpChart" on the workbench.
Chindata Group Holdings Ltd. (CD)
EARNINGS: 5/26/2022 (BMO)
Chindata Group Holdings Ltd. engages in the operation of internet data centers. It provides carrier-neutral hyperscale data center solutions in Asia-Pacific emerging markets, focusing on the China, India and Southeast Asia markets. The company was founded by Jing Ju in 2015 and is headquartered in Beijing, China.
Predefined Scans Triggered: Elder Bar Turned Green.
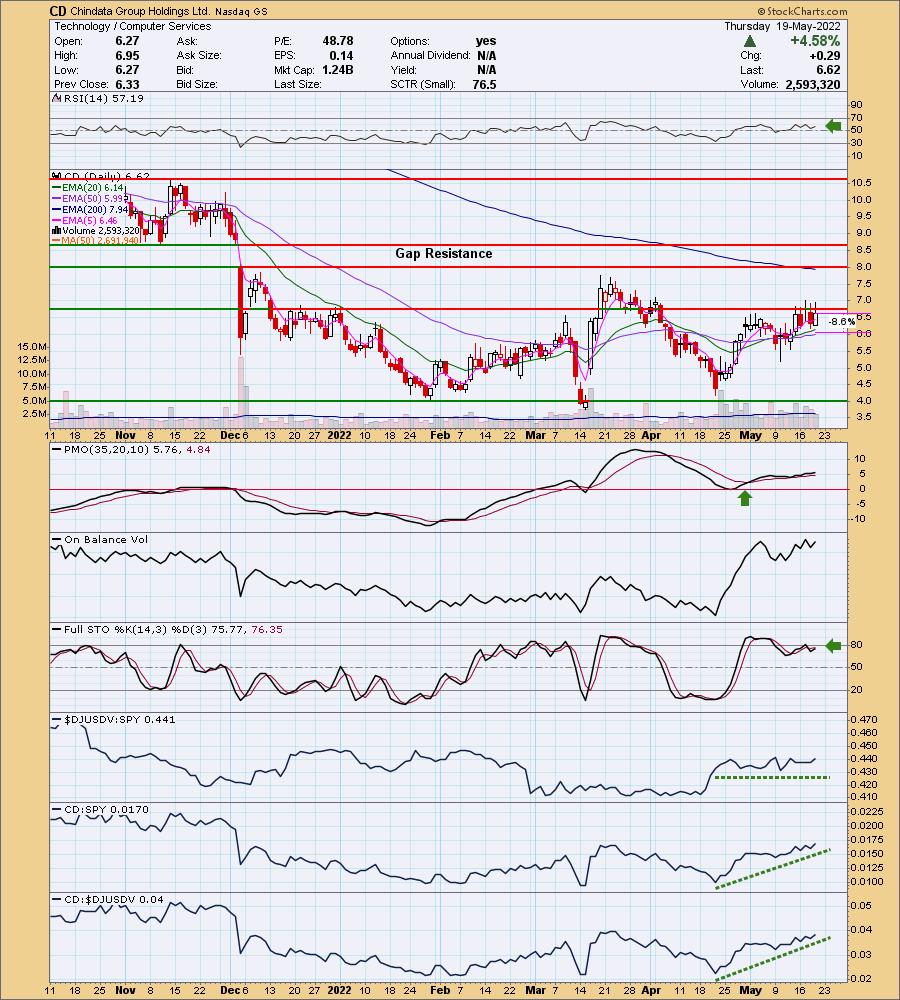
CD is up +3.32% in after hours trading so this reader is on to something if we see follow-through tomorrow. The only thing I don't like on this chart is that overhead resistance hasn't been overcome in the short term and gap resistance lies around the 200-day EMA. However, everything else suggests a successful trade. The RSI is positive and not overbought. The PMO is on a crossover BUY signal. It is flat due to the mostly steady rise in price. Stochastics are oscillating in positive territory above net neutral (50). The group isn't doing that great, but CD is outperforming both the group and the SPY. The stop is a bit deep, but I have it aligned with the 20/50-day EMAs.
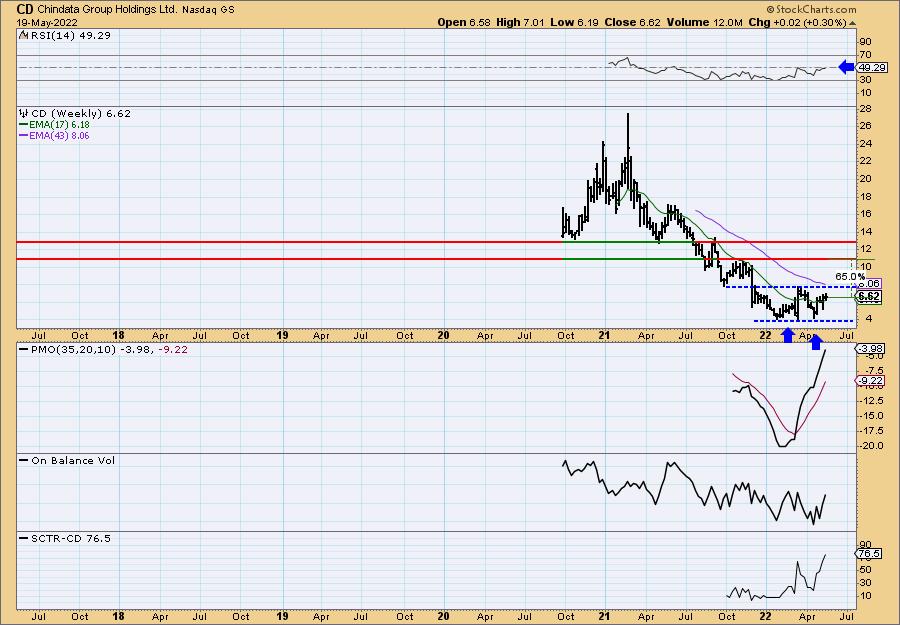
The weekly price chart shows the declining trend is now being consolidated. There is a messy double-bottom, but it does appear ready to execute. The RSI is nearly in positive territory and the SCTR is rising quickly suggesting strong internal and relative strength. The upside target of the chart pattern is 65% away. Not sure we'll see that kind of follow-through, but this does look interesting.
United States Copper Fund (CPER)
EARNINGS: N/A
CPER tracks a rules-based index of copper futures contracts selected based on the shape of the copper futures curve. For more information click here.
Predefined Scans Triggered: Elder Bar Turned Green, Bullish MACD Crossovers, P&F Double Bottom Breakout and P&F Bull Trap.
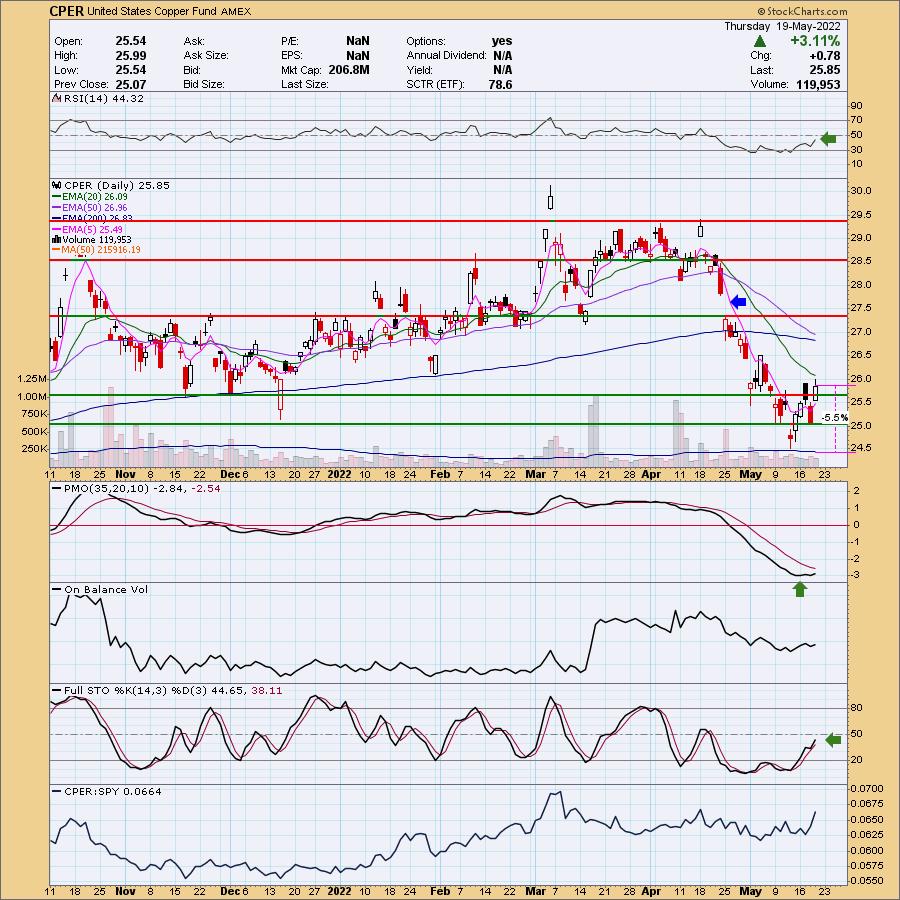
CPER is down -0.31% in after hours trading. This one also has some serious overhead resistance to overcome as far as the EMAs. I can make out a short-term reverse head and shoulders. It's a rising neckline so the pattern hasn't executed yet. It will require price to overcome the 20-day EMA. Indicators are improving so this is entirely possible. The RSI is negative but rising toward net neutral (50). The PMO has turned up and is slowly making its way toward a crossover BUY signal. Stochastics are rising and should hit positive territory very soon. The stop can be tightly set at 5.5% beneath the May low.
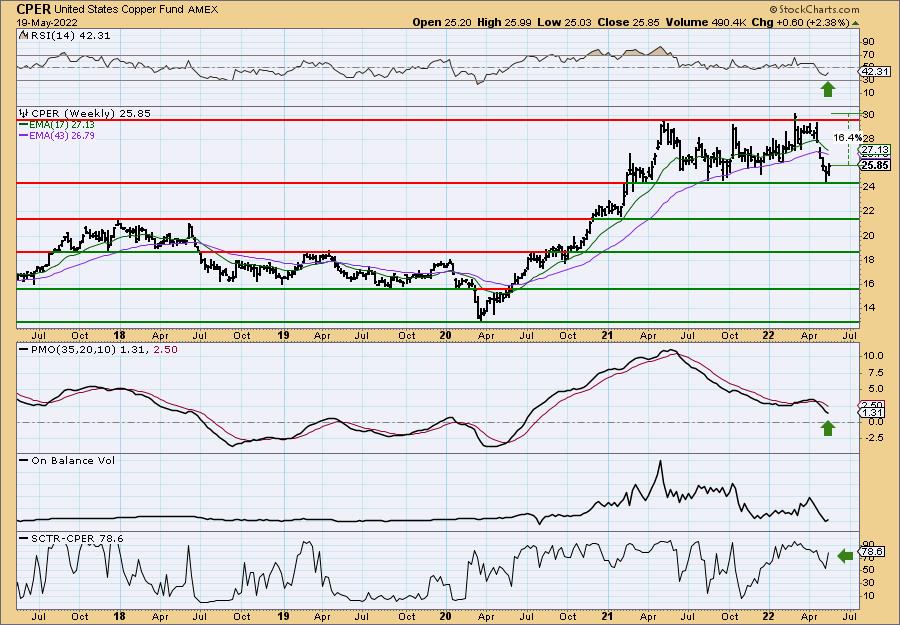
CPER has been in a trading range most of this year. I like this because we are looking for an entry right off the bottom of the range. The weekly RSI has turned up and the weekly PMO is beginning to slow its descent somewhat. The SCTR is above 75 suggesting it is in the upper quartile of its ETF "universe". If it can reach all-time highs, that would be an over 16% gain. Given the stop is thin, I like this win/loss ratio.
Corteva Inc. (CTVA)
EARNINGS: 8/3/2022 (AMC)
Corteva, Inc. is a global provider of seed and crop protection solutions focused on the agriculture industry and contributing to food supply. The firm operates through the following segments: Seed and Crop Protection. The Seed segment is engaged in the developing and supplying of advanced germplasm and traits that produce yield for farms. The Crop Protection segment is involved in offering the global agricultural input industry with products that protect against weeds, insects, other pests, and diseases, and that improve overall crop health both above and below ground via nitrogen management and seed-applied technologies. The company was founded in 1802 and is headquartered in Indianapolis, IN.
Predefined Scans Triggered: P&F Low Pole.
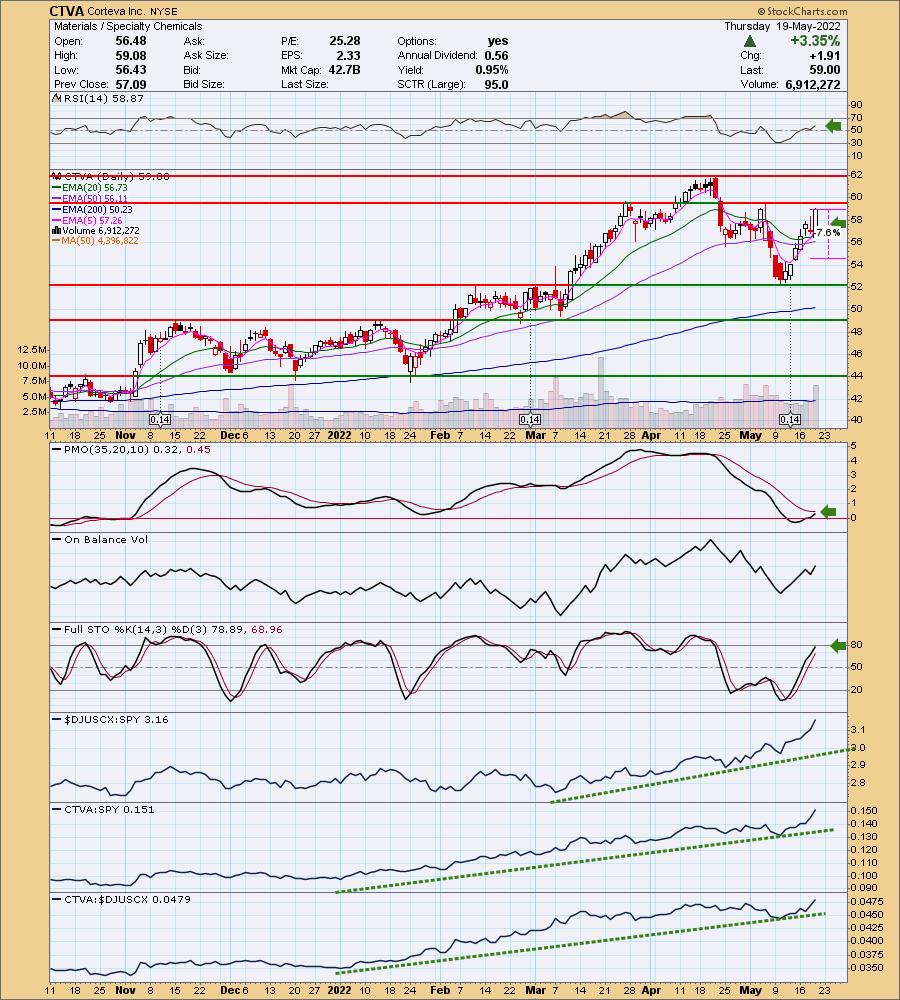
CTVA is unchanged in after hours trading. I covered CTVA on February 10th 2022. The position is currently up +15.8%, but it was up over 21% at the top. Price is up against resistance but today's candlestick was a bullish engulfing which suggests higher prices tomorrow. The RSI is positive and the PMO is nearing a crossover BUY signal. Stochastics should reach above 80 tomorrow. Relative performance is top-notch. The stop can be set tighter below the 50-day EMA or set deeper at about 11% below the May low. I opted to set it right between those two levels.
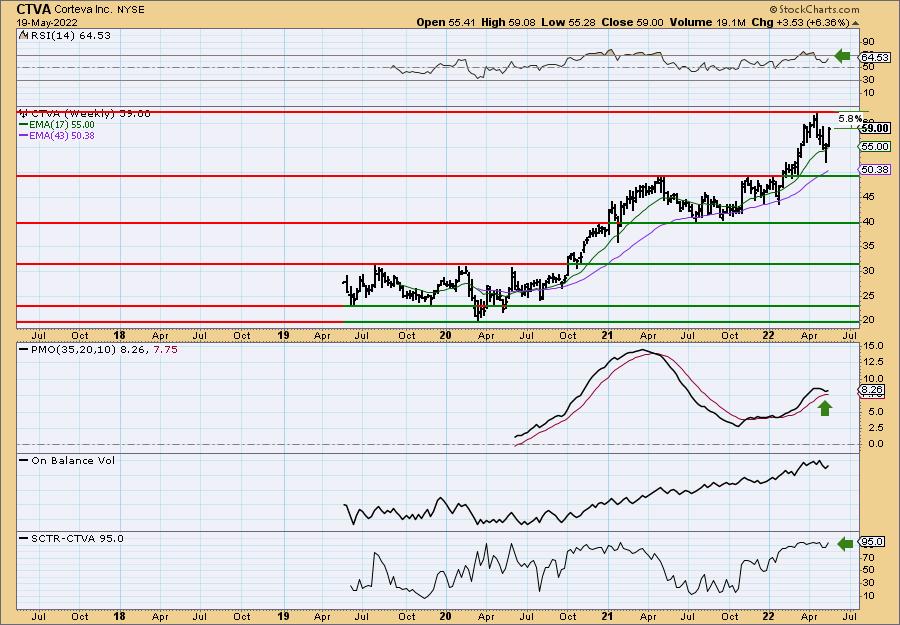
The weekly chart shows us that this bounce occurred above the support line which is very encouraging. The weekly RSI is positive and not overbought. The weekly PMO has bottomed above its signal line which is especially bullish. The SCTR is 95.0, meaning CTVA is in the top 5% of large-cap stocks based on internal and relative strength.
Global X Lithium ETF (LIT)
EARNINGS: N/A
LIT tracks a market-cap-weighted index of global lithium miners and battery producers. For more information click HERE.
Predefined Scans Triggered: Moved Above Upper Bollinger Band, P&F Double Top Breakout and P&F Bullish Triangle.
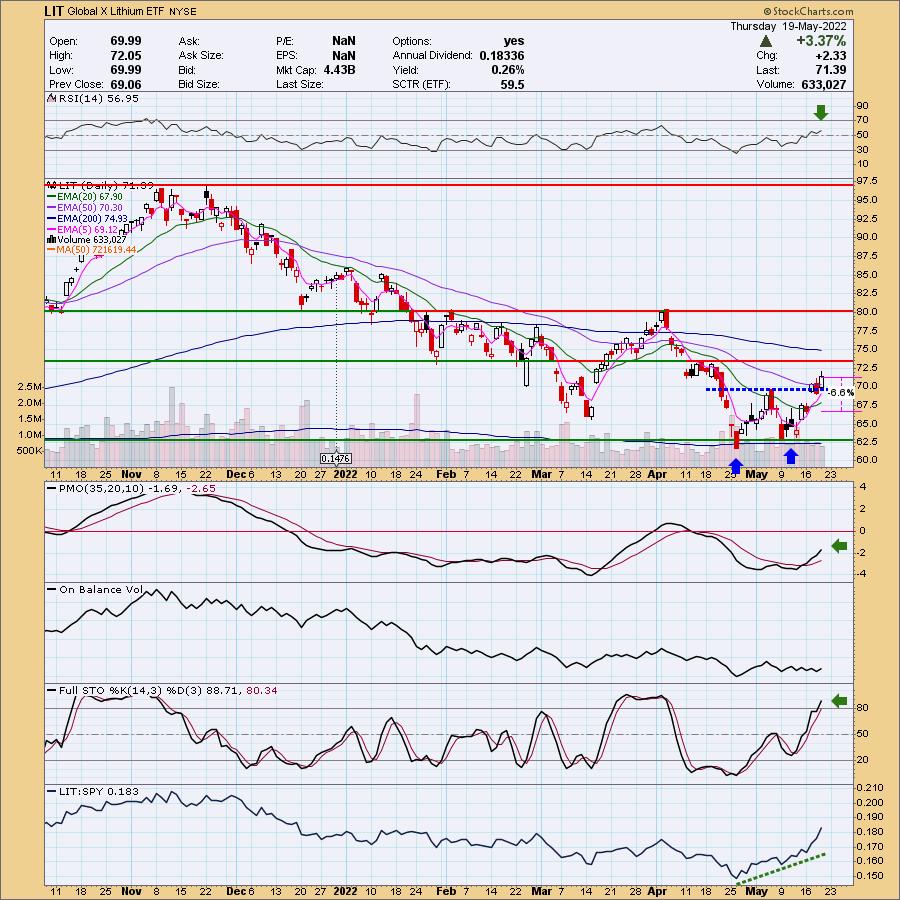
LIT is down -0.43% in after hours trading. I covered LIT on January 20th 2021. The position is closed. There is a double-bottom formation and price confirmed the pattern today with a breakout above the confirmation line and 50-day EMA. The RSI is positive and the PMO is on a BUY signal and rising. Stochastics are rising above 80. Relative strength is starting to kick in. The stop is set halfway down the double-bottom pattern.
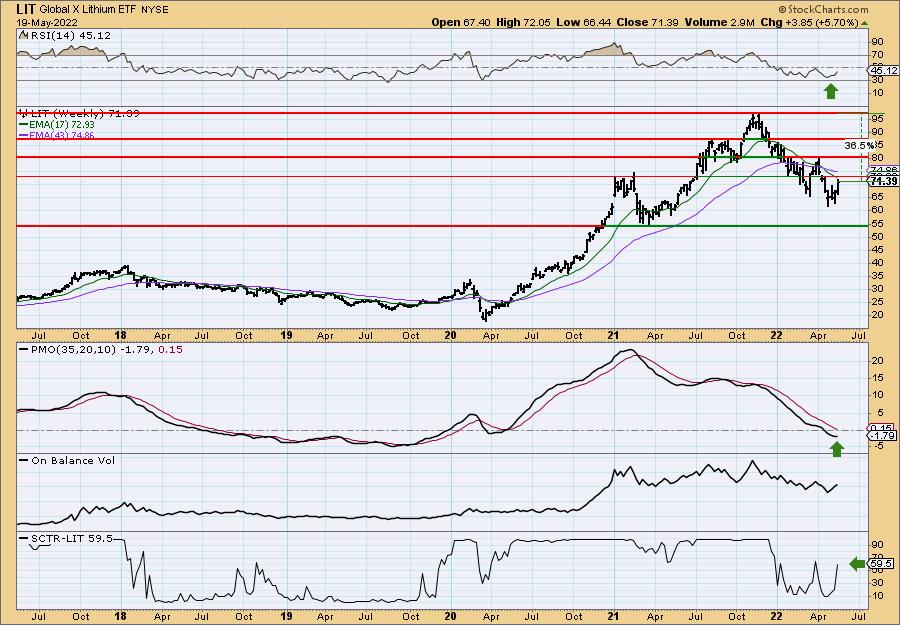
Price has reversed before reaching support at $55. However, we haven't overcome the early 2021 top. The weekly RSI is negative but is rising toward positive territory above net neutral (50). The weekly PMO is beginning to turn back up and the SCTR has improved. It's still a low 59.5, but certainly not bad given the decline out of the 2021 top. If it can make it back up there, that would be a 36.5% gain.
Don't forget, on Thursdays I look at reader-requested symbols, click HERE to shoot me an email. I read every email I receive and try to answer them all!
Current Market Outlook:
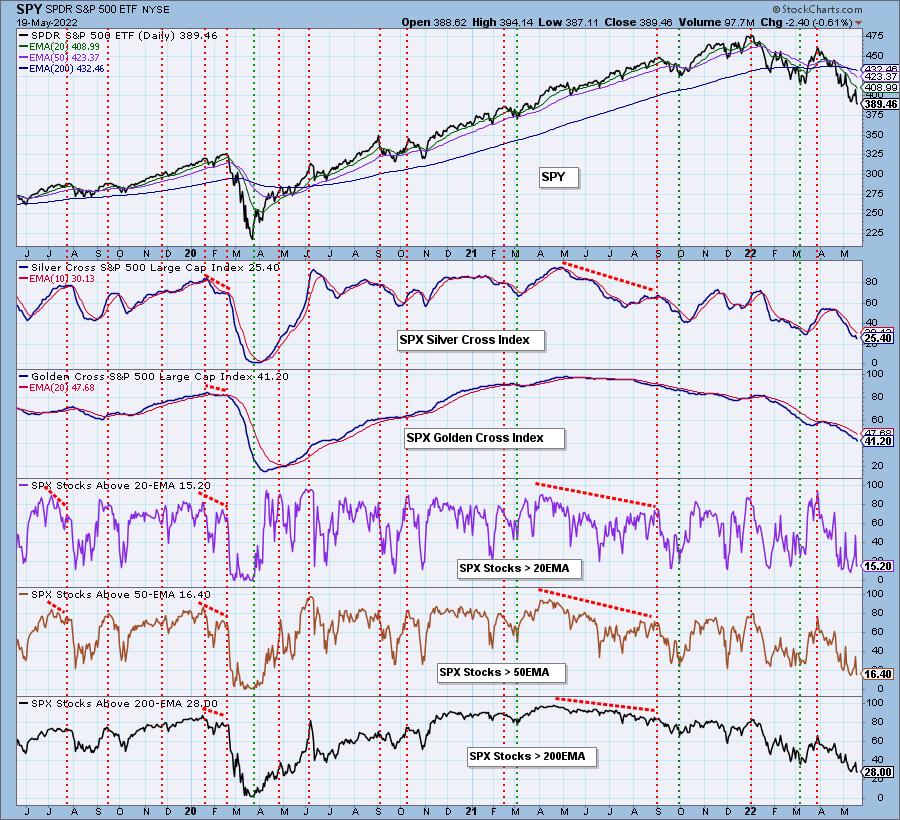
Market Environment: It is important to consider the odds for success by assessing the market tides. The following chart uses different methodologies for objectively showing the depth and trend of participation for intermediate- and long-term time frames.
- The Silver Cross Index (SCI) shows the percentage of SPX stocks on IT Trend Model BUY signals (20-EMA > 50-EMA)
- The Golden Cross Index (GCI) shows the percentage of SPX stocks on LT Trend Model BUY signals (50-EMA > 200-EMA)
Don't forget that as a "Diamonds" member, you have access to our GCI/SCI curated ChartList on DecisionPoint.com. You'll find it under "Members Only" links on the left side on the Blogs and Links Page.
Here is the current chart:
Full Disclosure: I'm 20% exposed with 10% hedge.
I'm required to disclose if I currently own a stock and/or may buy/short it within the next 72 hours.
"Technical Analysis is a windsock, not a crystal ball." - Carl Swenlin
(c) Copyright 2022 DecisionPoint.com
Watch the latest episode of DecisionPoint with Carl & Erin Swenlin on Mondays 7:00p EST or on the DecisionPoint playlist on the StockCharts TV YouTube channel here!
NOTE: The stocks reported herein are from mechanical trading model scans that are based upon moving average relationships, momentum and volume. DecisionPoint analysis is then applied to get five selections from the scans. The selections given should prompt readers to do a chart review using their own analysis process. This letter is not a call for a specific action to buy, sell or short any of the stocks provided. There are NO sure things or guaranteed returns on the daily selection of "Diamonds in the Rough."
Helpful DecisionPoint Links:
DecisionPoint Shared ChartList and DecisionPoint Chart Gallery
Price Momentum Oscillator (PMO)
Swenlin Trading Oscillators (STO-B and STO-V)
For more links, go to DecisionPoint.com