
The market finished all over the place today with the Dow up +0.15% against the SPY which closed down -0.81% and the Nasdaq which ended the day down -2.35%. Last week's "industry group to watch" and the two stock symbols I presented in my write-up on Friday did well Monday and Tuesday.
Fixed Telecom is continuing to perform well. In particular, I mentioned AT&T (T) and Telefonica Brazil (VIV). T is up +3.73% so far this week and VIV is up +4.55%. I decided to share the AT&T chart as an official "Diamond in the Rough" and found Orange (ORAN) another fixed telecom chart for you to look at. VIV still looks good, I just like the weekly charts on T and ORAN better.
Utilities are beginning to come around. Both XLU and XLV landed in my Diamond PMO scan results. I decided to also include a Utilitiy with promise.
Thank you for your patience as my publishing schedule is different due to travel in Seattle.
Good Luck & Good Trading,
Erin
Today's "Diamonds in the Rough": EVRG, ORAN and T.
Stocks to Review: BCI, EXPD, BIP, CACI and ADM.

RECORDING LINK (5/20/2022):
Topic: DecisionPoint Diamond Mine (5/20/2022) LIVE Trading Room
Start Time: May 20, 2022 09:00 AM
Meeting Recording Link.
Access Passcode: May#the20th
REGISTRATION FOR Friday 5/27 Diamond Mine:
When: May 27, 2022 09:00 AM Pacific Time (US and Canada)
Topic: DecisionPoint Diamond Mine 5/27/2022) LIVE Trading Room
Register in advance for this webinar HERE.
** Save the registration confirmation email with login instructions in case Zoom doesn't notify you in time.**

Free DP Trading Room (5/23) RECORDING LINK:
Topic: DecisionPoint Trading Room
Start Time: May 23, 2022 09:00 AM
Meeting Recording Link.
Access Passcode: MayDP@23
For best results, copy and paste the access code to avoid typos.
Welcome to DecisionPoint Daily Diamonds, wherein I highlight ten "Diamonds in the Rough" per week. These are selected from the results of my DecisionPoint Scans, which search for stocks that could benefit from the trend and condition of the market. Remember, these are not recommendations to buy or sell, but are the most interesting of the stocks that surfaced in my scans. My objective is to save you the work of the initial, tedious culling process, but you need to apply your own analysis to see if these stocks pique your interest as well. There are no guaranteed winners here!
"Predefined Scans Triggered" are taken from StockCharts.com using the "Symbol Summary" option instead of a "SharpChart" on the workbench.
Evergy, Inc. (EVRG)
EARNINGS: 8/4/2022 (BMO)
Evergy, Inc. is a holding company, which engages in the provision of electricity through its subsidiaries. It focuses on the regulation of electric utilities and development of electric transmission projects. The company was founded in 2017 and is headquartered in Kansas City, MO.
Predefined Scans Triggered: New CCI Buy Signals and Moved Above Upper Bollinger Band
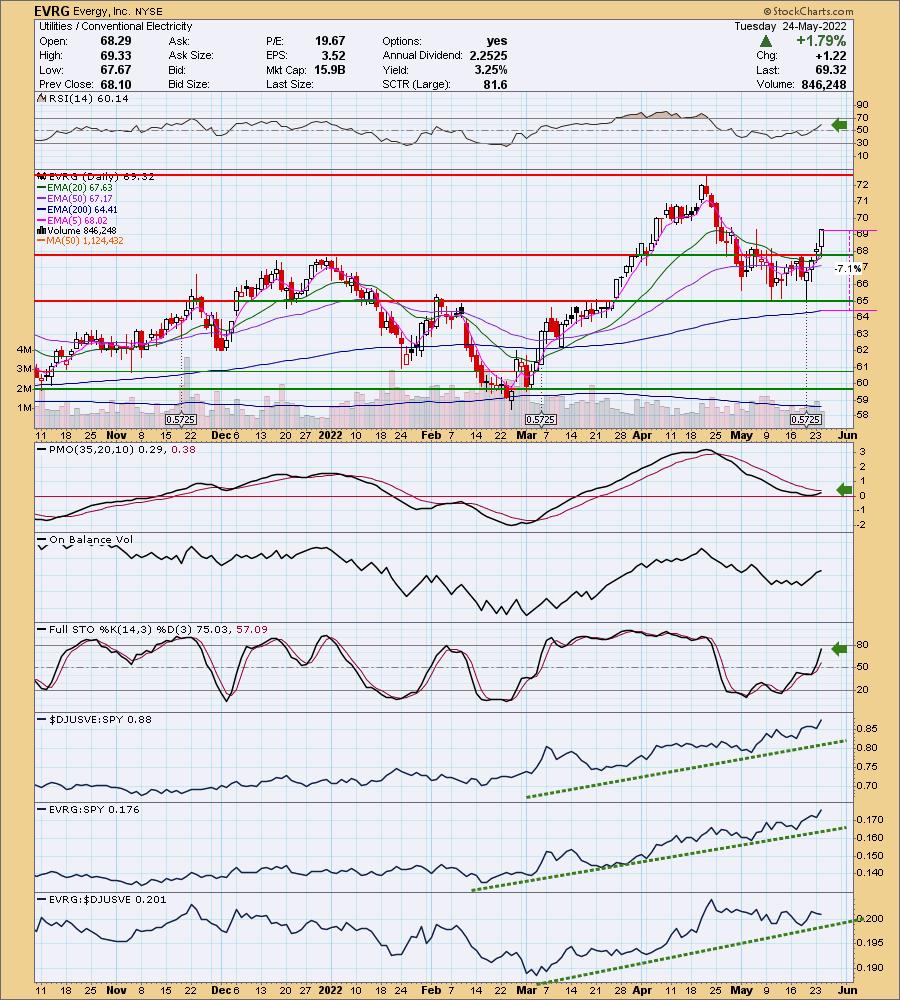
EVRG is unchanged in after hours trading. Yesterday it broke out of a trading range and above the 20-day EMA. Today new support held and it had follow-through on yesterday's breakout move. There is ST Trend Model BUY signal as the 5-day EMA crossed above the 20-day EMA. The RSI is positive and rising. The PMO is nearing a crossover BUY signal. Stochastics are rising and should reach above 80 soon. Relative strength is excellent against the SPY. It isn't one of the best relative performers within the industry group, but it certainly is a strong performer against the SPY. The stop is set below the 200-day EMA.
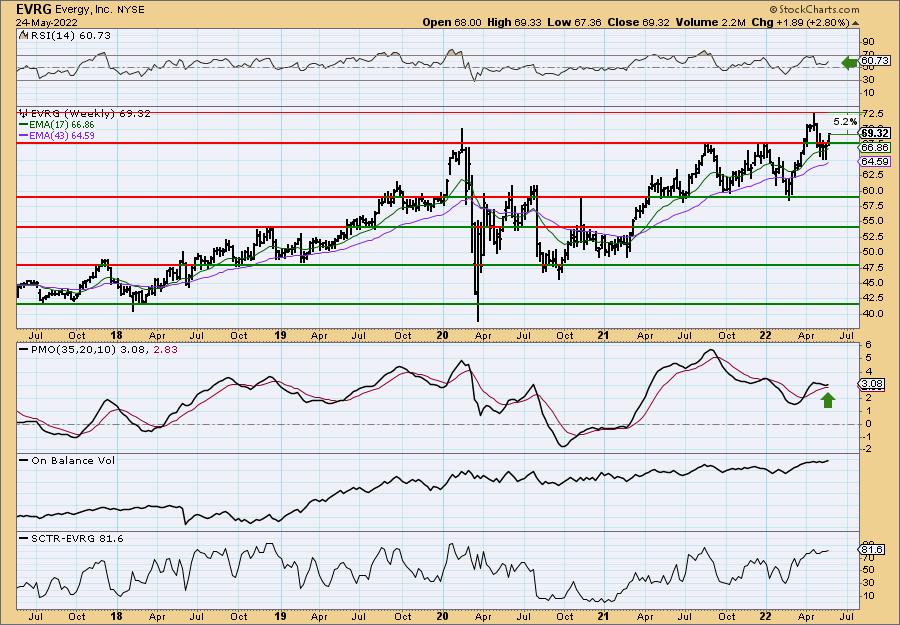
Price broke back above the 2021 highs. The weekly RSI is positive and not overbought. The weekly PMO has bottomed above the signal line which is especially bullish. It's only about 5% away from new all-time highs, so consider an upside target around 15% at $79.72.
Orange (ORAN)
EARNINGS: 7/28/2022 (BMO)
Orange SA engages as a telecommunication services company, which operates mobile and internet services. It provides telecommunication services to multinational companies, under the brand Orange Business Services. The company was founded in 1794 and is headquartered in Paris, France.
Predefined Scans Triggered: Moved Above Upper Keltner Channel, New 52-week Highs, Moved Above Upper Bollinger Band, P&F Ascending Triple Top Breakout and P&F Double Top Breakout.
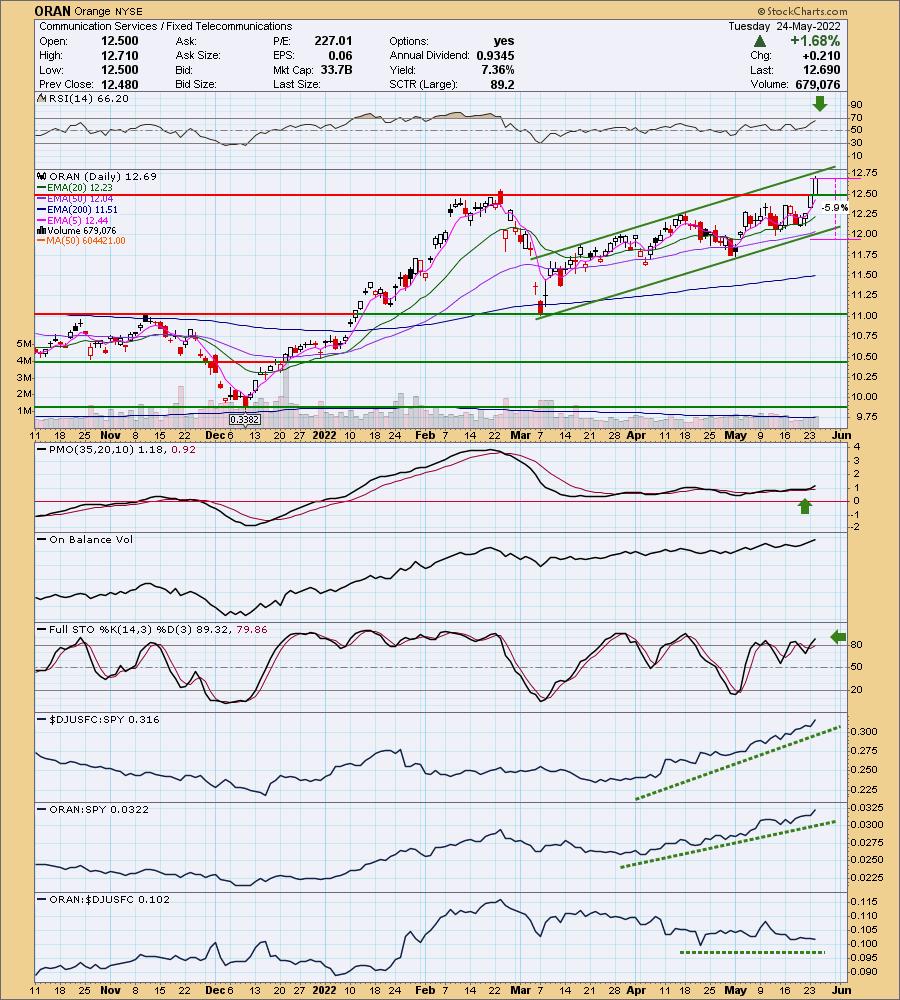
ORAN is unchanged in after hours trading. ORAN broke out above overhead resistance at the February high. It is in a nice rising trend channel that suggest price will move even higher. The RSI is positive and the PMO is accelerating higher. Stochastics are above 80 and have been oscillating in positive territory all month. We see how well the industry group is performing and ORAN, while not a great performer within its group is doing very well against the SPY. The stop can be set thinly below the 50-day EMA which would imply a breakdown of the rising trend.
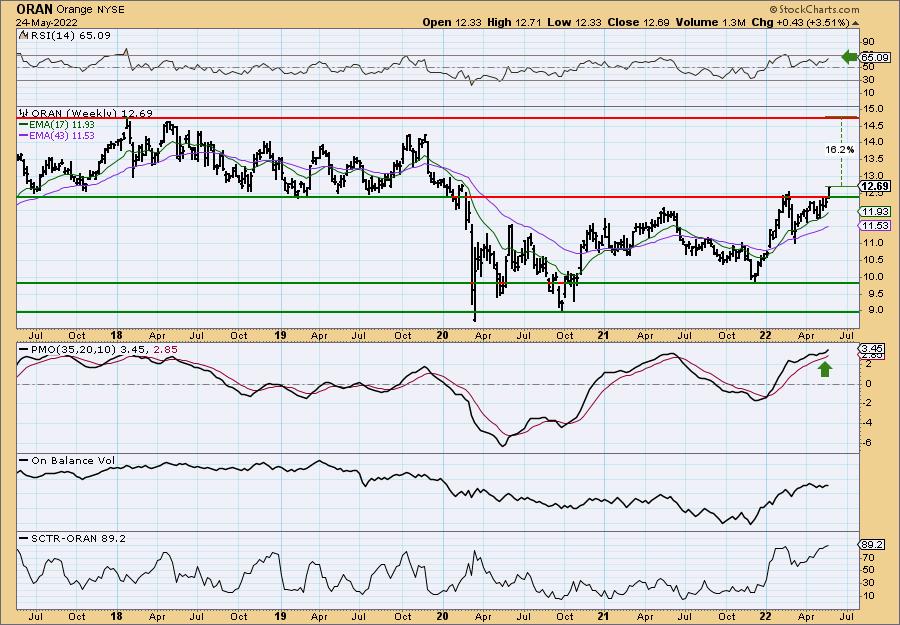
The weekly chart impressed me. Price not only broke above resistance in the short term on the daily chart, this is a very strong level of resistance in the long term. It makes the breakout especially bullish. The weekly RSI is positive and not overbought. The weekly PMO is rising after bottoming multiple times above the signal line. Very strong chart with an upside target around 16%.
AT&T, Inc. (T)
EARNINGS: 7/21/2022 (BMO)
AT&T, Inc. is a holding company, which engages in the provision of telecommunications media and technology service. It operates through the following segments: Communications, WarnerMedia, and Latin America. The Communications segment offers services to businesses and consumers located in the U.S., or in U.S. territories, and businesses globally. The WarnerMedia segment develops, produces, and distributes feature films, television, gaming and other content over various physical and digital formats. The Latin America segment is involved in entertainment and wireless services outside of the U.S. The company was founded in 1983 and is headquartered in Dallas, TX.
Predefined Scans Triggered: Moved Above Upper Keltner Channel, New 52-week Highs, Moved Above Upper Bollinger Band and P&F Double Top Breakout.
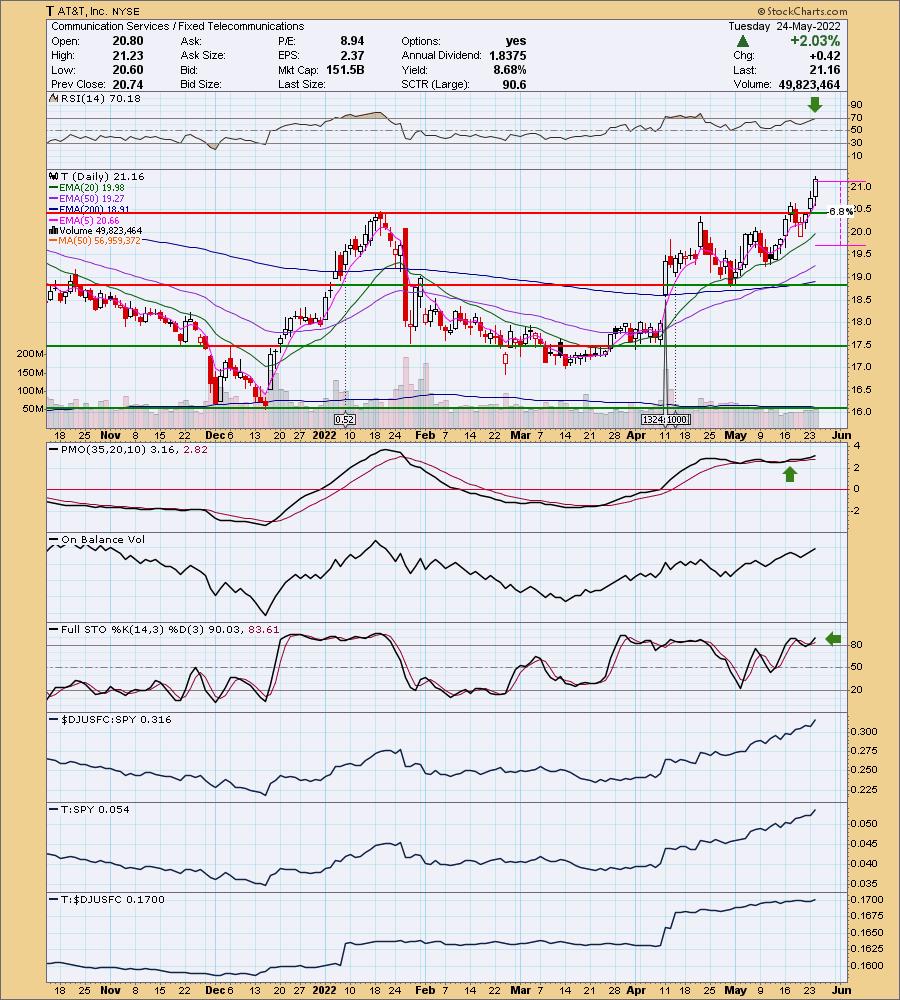
T is up +0.14% in after hours trading. Nice breakout above resistance at the January high. The RSI is a tiny bit overbought, but T doesn't seem to be allergic to overbought conditions; it can hold those conditions for days. The PMO is rising on a crossover BUY signal. Stochastics are oscillating above 80 and relative strength is excellent all the way around. Notice also that T has a big 8.68% yield. The stop is set about halfway down the prior trading range.
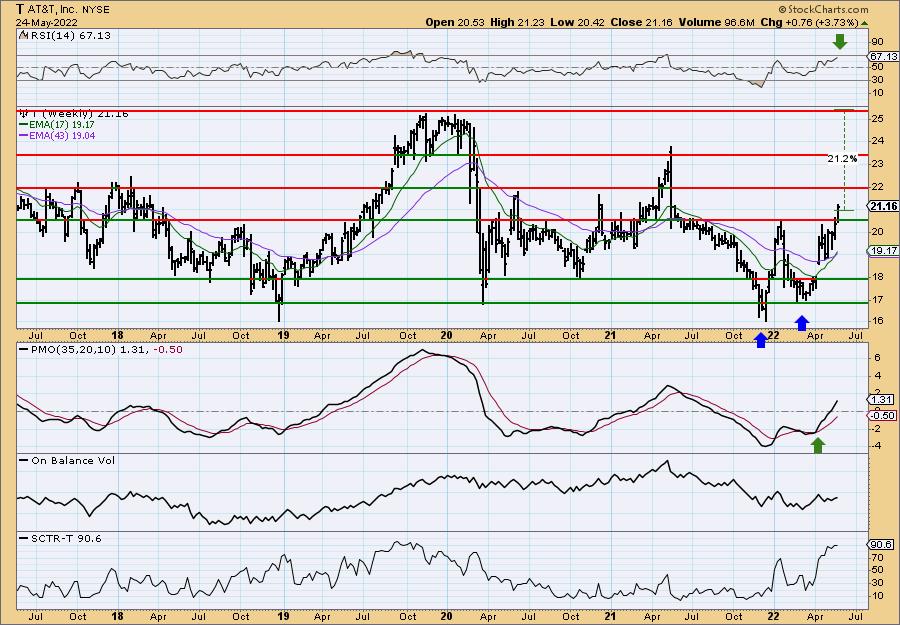
Upside potential on the weekly chart is excellent at over 21%. It could certainly get hung up at the 2021 high, but we have a double-bottom chart pattern. That formation's upside target is conservatively $25 and that tells us it should reach that level. This one is on my radar.
Don't forget, on Thursdays I look at reader-requested symbols, click HERE to shoot me an email. I read every email I receive and try to answer them all!
Current Market Outlook:
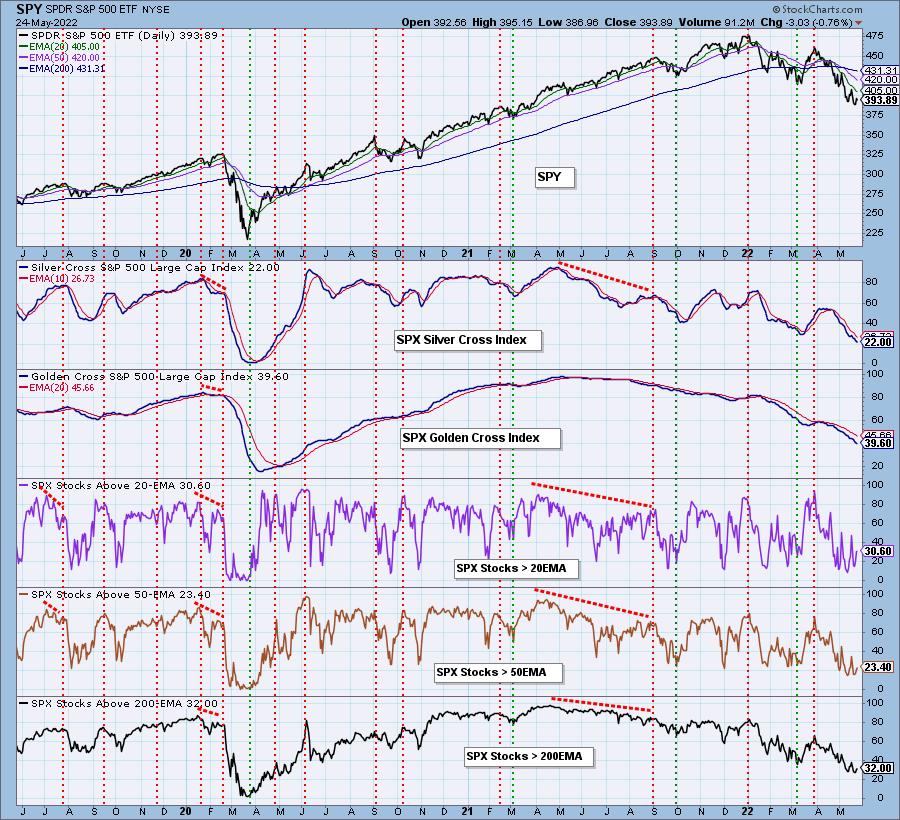
Market Environment: It is important to consider the odds for success by assessing the market tides. The following chart uses different methodologies for objectively showing the depth and trend of participation for intermediate- and long-term time frames.
- The Silver Cross Index (SCI) shows the percentage of SPX stocks on IT Trend Model BUY signals (20-EMA > 50-EMA)
- The Golden Cross Index (GCI) shows the percentage of SPX stocks on LT Trend Model BUY signals (50-EMA > 200-EMA)
Don't forget that as a "Diamonds" member, you have access to our GCI/SCI curated ChartList on DecisionPoint.com. You'll find it under "Members Only" links on the left side on the Blogs and Links Page.
Here is the current chart:
Full Disclosure: I'm 20% exposed with 10% hedge. I'm considering a purchase of AT&T (T).
I'm required to disclose if I currently own a stock and/or may buy/short it within the next 72 hours.
"Technical Analysis is a windsock, not a crystal ball." - Carl Swenlin
(c) Copyright 2022 DecisionPoint.com
Watch the latest episode of DecisionPoint with Carl & Erin Swenlin on Mondays 7:00p EST or on the DecisionPoint playlist on the StockCharts TV YouTube channel here!
NOTE: The stocks reported herein are from mechanical trading model scans that are based upon moving average relationships, momentum and volume. DecisionPoint analysis is then applied to get five selections from the scans. The selections given should prompt readers to do a chart review using their own analysis process. This letter is not a call for a specific action to buy, sell or short any of the stocks provided. There are NO sure things or guaranteed returns on the daily selection of "Diamonds in the Rough."
Helpful DecisionPoint Links:
DecisionPoint Shared ChartList and DecisionPoint Chart Gallery
Price Momentum Oscillator (PMO)
Swenlin Trading Oscillators (STO-B and STO-V)
For more links, go to DecisionPoint.comIAMONDS