
I love Reader Request Day for two reasons: 1) I don't have to tease out five stocks from hundreds of scan results, and 2) I get to see not only what's on your mind, but find "Diamonds in the Rough" from those interesting selections. I will admit that one of today's symbols isn't actually a Reader Request. However, I decided to go on the hunt within an industry group that the original request was in. I like what I found! I've put the remainder of requests in the "Stocks to Review" section. While I don't believe they are all "Diamond" material, I think you might find it interesting to see what stocks are on your fellow Diamond subscriber's minds.
Tomorrow is the Diamond Mine trading room. If you haven't registered yet, the link is below and HERE too! Looking forward to seeing the regulars and hopefully a few new faces as well! Remember the recording and registration information is in every DP Diamonds report.
Today's "Diamonds in the Rough": AAL, BWB, GLPI, KAMN and UVV.
Stocks to Review: KIE, PSCE, UEC, ATER, APA, SOYB, CAR, HCA, MOH, THC, CMRE, GRIN, LUV, SBLK and PLD.

Diamond Mine RECORDING LINK (4/14/2022):
Topic: DecisionPoint Diamond Mine (4/14/2022) LIVE Trading Room
Start Time: Apr 14, 2022 09:00 AM
Meeting Recording Link.
Access Passcode: April@14
REGISTRATION FOR 4/22 Diamond Mine:
When: Apr 22, 2022 09:00 AM Pacific Time (US and Canada)
Topic: DecisionPoint Diamond Mine (4/22/2022) LIVE Trading Room
Register in advance for this webinar HERE.
** Save the registration confirmation email with login instructions in case Zoom doesn't notify you in time.**

Free DP Trading Room (4/18) RECORDING LINK:
Topic: DecisionPoint Trading Room
Start Time: Apr 18, 2022 08:59 AM
Meeting Recording Link.
Access Passcode: April#18th
For best results, copy and paste the access code to avoid typos.
Welcome to DecisionPoint Daily Diamonds, wherein I highlight ten "Diamonds in the Rough" per week. These are selected from the results of my DecisionPoint Scans, which search for stocks that could benefit from the trend and condition of the market. Remember, these are not recommendations to buy or sell, but are the most interesting of the stocks that surfaced in my scans. My objective is to save you the work of the initial, tedious culling process, but you need to apply your own analysis to see if these stocks pique your interest as well. There are no guaranteed winners here!
"Predefined Scans Triggered" are taken from StockCharts.com using the "Symbol Summary" option instead of a "SharpChart" on the workbench.
American Airlines Group Inc. (AAL)
EARNINGS: 4/21/2022 (BMO)
American Airlines Group, Inc. is a holding company, which engages in the operation of a network carrier through its principal wholly-owned mainline operating subsidiary, American. The firm offers air transportation for passengers and cargo. It operates through the following geographical segments: Department of Transportation Domestic, Department of Transportation Latin America, Department of Transportation Atlantic, and Department of Transportation Pacific. The company was founded on December 9, 2013 and is headquartered in Fort Worth, TX.
Predefined Scans Triggered: Moved Above Upper Keltner Channel, Moved Above Upper Bollinger Band, Filled Black Candles, Moved Above Upper Price Channel and P&F Double Top Breakout.
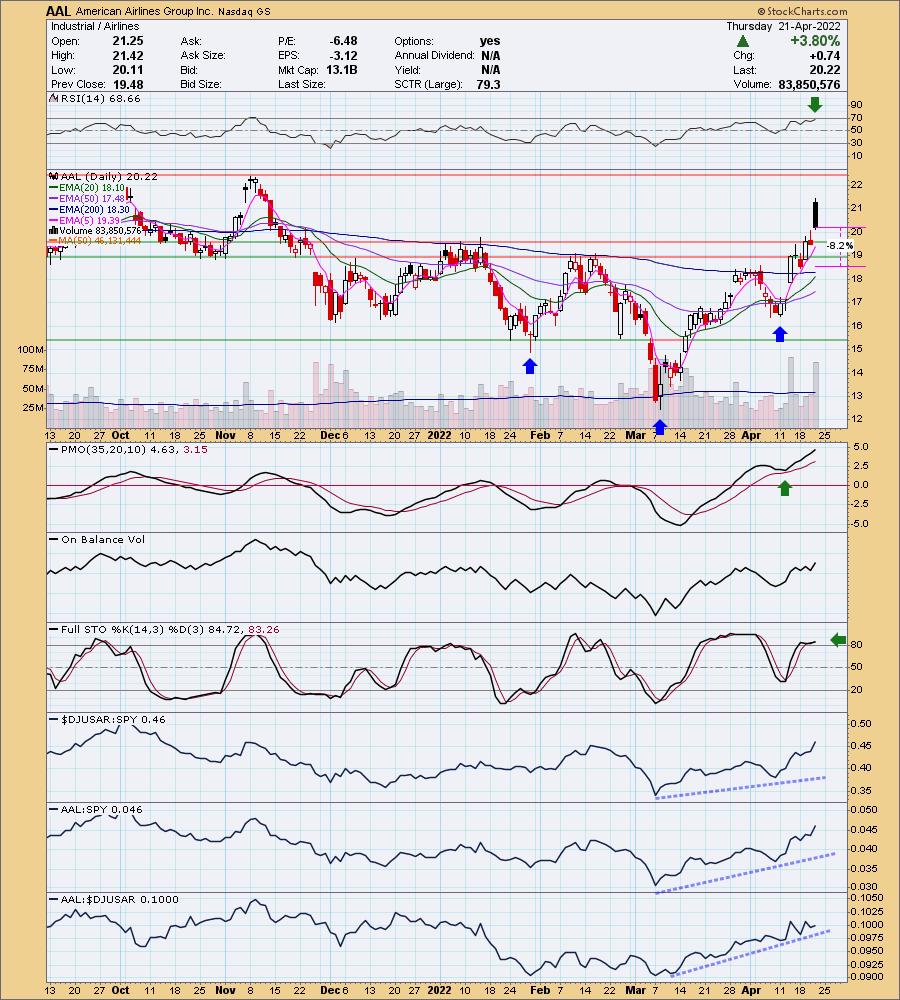
AAL is down -0.25% in after hours trading. I've covered AAL twice before on May 18th 2021 and January 13th 2022, both positions stopped out. The stock that was actually requested was Southwest Airlines (LUV), but I really liked this chart better as it is a leader within the group right now based on relative strength. I do not like today's filled black candlestick on earnings, but overall it fared well so I expect follow-through. Overhead resistance is nearing so we need to be cautious. The RSI is positive and the PMO is on a BUY signal after recently topping above its signal line. I see a possible bullish reverse head and shoulders pattern that was confirmed with today's breakout. I've set the stop below strong support at October/November lows and January/February highs.
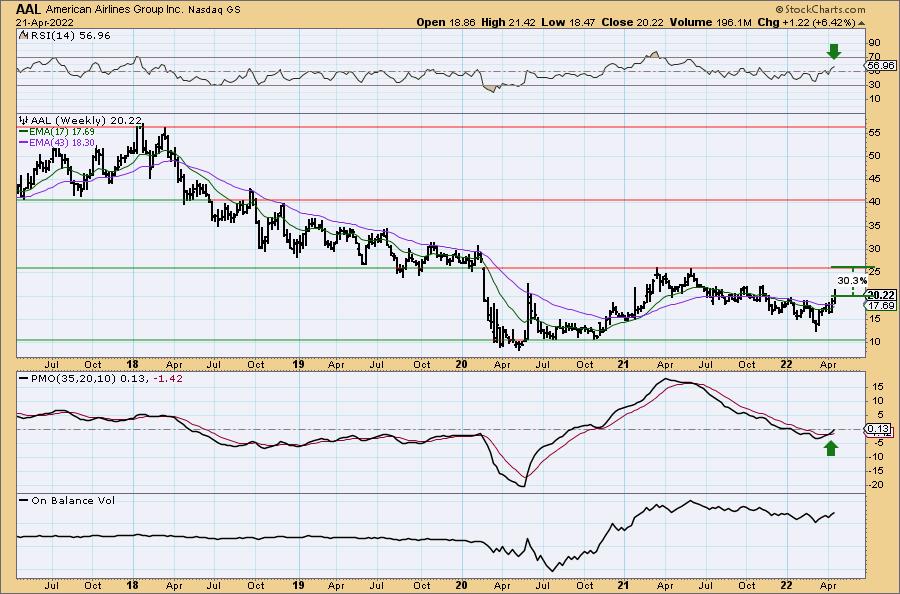
Upside potential is great. The minimum upside target based on the head and shoulders would take price to overhead resistance at the 2021 high. That would be a 30%+ gain. The weekly PMO just had a crossover BUY signal and the weekly RSI is positive.
Bridgewater Bancshares, Inc. (BWB)
EARNINGS: 4/28/2022 (BMO)
Bridgewater Bancshares, Inc. is a holding company, which provides retail and commercial loan and deposit services. It offers deposits, lending, professional services, and business services. The company was founded by Jerry J. Baack and Jeffrey D. Shellberg in 2005 and is headquartered in Bloomington, MN.
Predefined Scans Triggered: None.
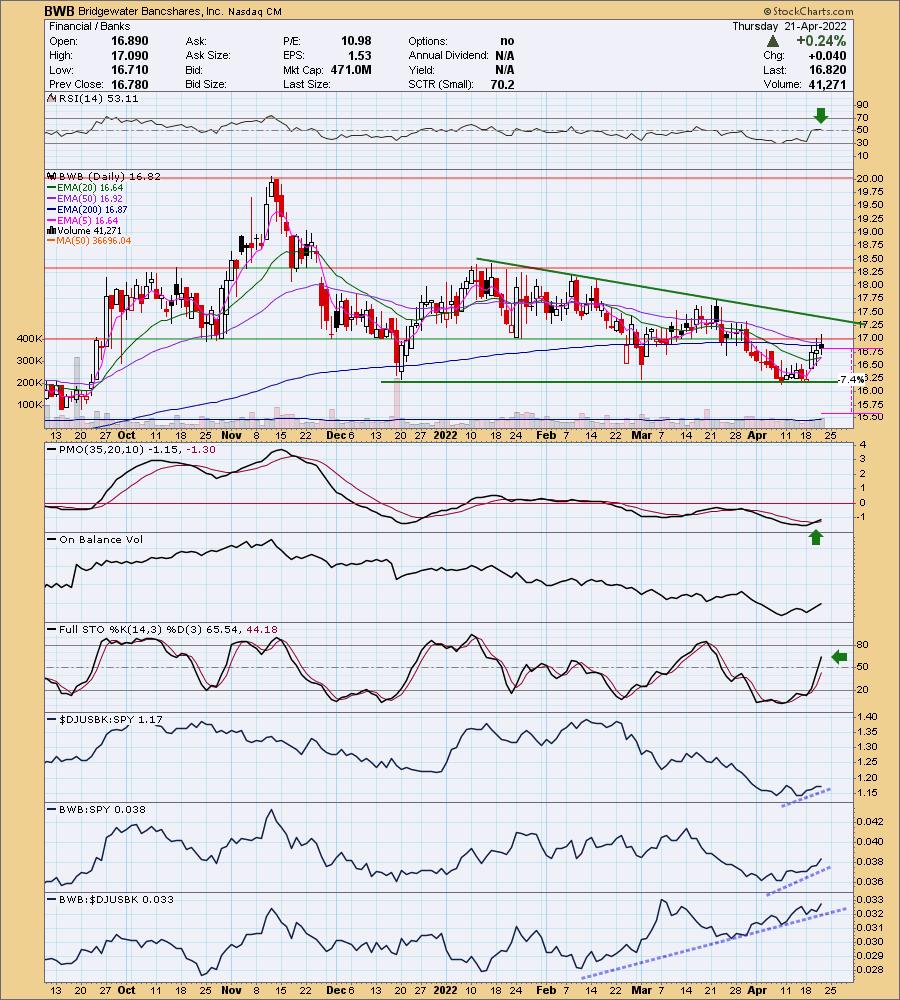
BWB is down -0.32% in after hours trading. Today BWB triggered a ST Trend Model BUY signal as the 5-day EMA crossed above the 20-day EMA. My big concern would be the large bearish descending triangle that has developed. However, if price does break out of the declining tops trendline, that would be a bullish execution of a bearish pattern which would be exceptionally bullish. It has some work to do. The RSI is positive, Stochastics are rising strongly and the PMO just triggered a crossover BUY signal. Indicators suggest it will break out which is why I included it in today's report. Relative strength is strong across the board. The stop can be set very thin below the chart pattern, but I went ahead and set it below the September lows.
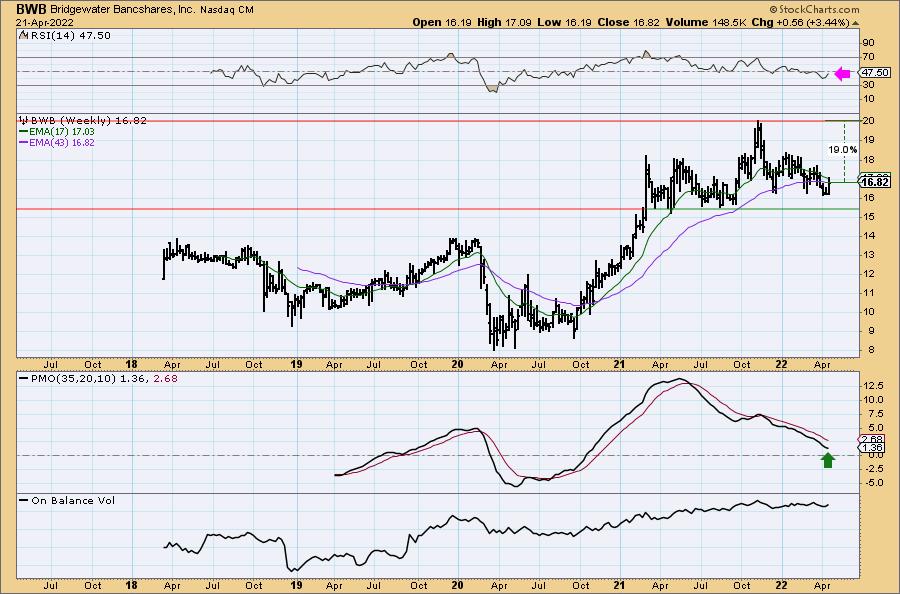
The weekly chart is suspect given the weekly RSI is negative. However, it is rising. The weekly PMO is on a SELL signal but it appears to be decelerating its decline. This is a great opportunity for BWB to breakout if it can break that declining trend. Upside target is about 19%.
Gaming and Leisure Properties, Inc. (GLPI)
EARNINGS: 4/28/2022 (AMC)
Gaming & Leisure Properties, Inc. is engaged in acquiring, financing, and owning real estate property to be leased to gaming operators in triple net lease arrangements. It operates through the GLP Capital and TRS Properties segments. The GLP Capital segment consists of the leased real property and represents the majority of business. The TRS Properties segment includes Hollywood Casino Perryville and Hollywood Casino Baton Rouge. The company was founded on February 13, 2013, and is headquartered in Wyomissing, PA.
Predefined Scans Triggered: None.
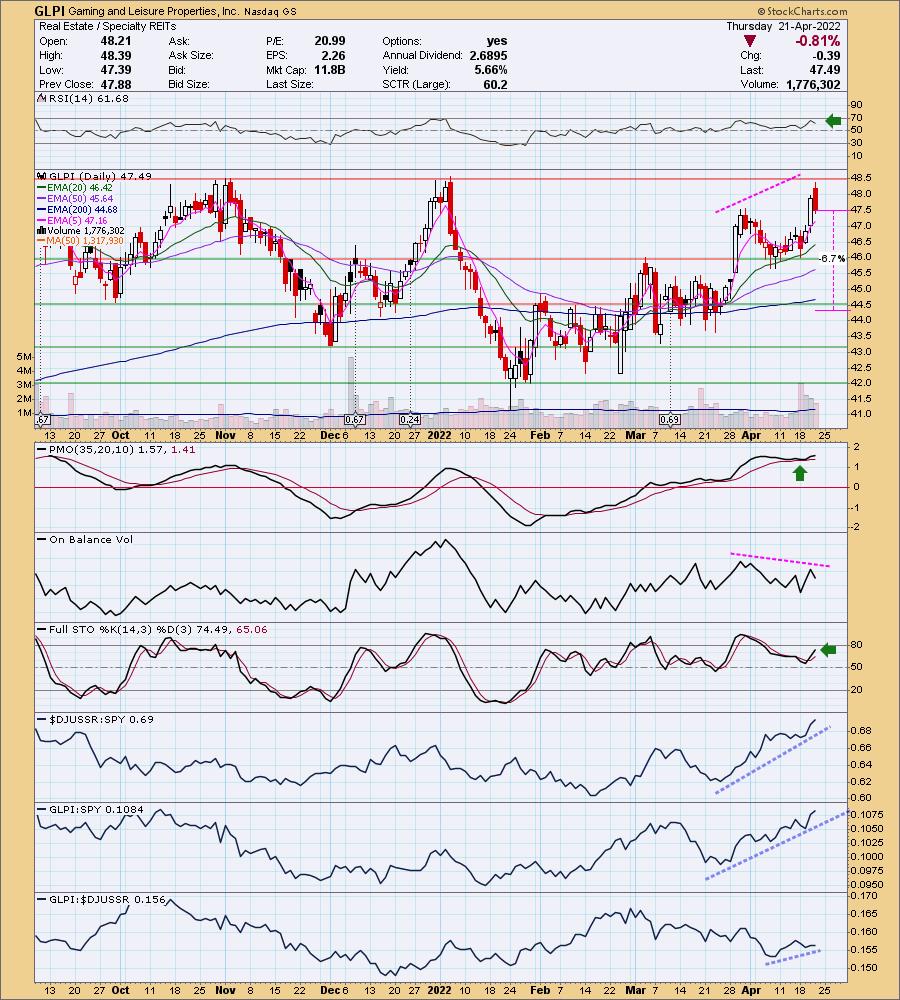
GLPI is down -0.65% in after hours trading. This one isn't perfect, but I still like the set-up enough to include it. Let's start with the not so good characteristics. First, price is now hitting overhead resistance and second, there is a negative OBV divergence. However, the favorable indicators made this worth presenting. The RSI is positive and the PMO is rising on a crossover BUY signal. Stochastics reversed in positive territory and are headed toward 80. Relative strength of the group has been excellent and GLPI is a clear outperformer within the group and against the SPY. I've set the stop below the September low and 200-day EMA.
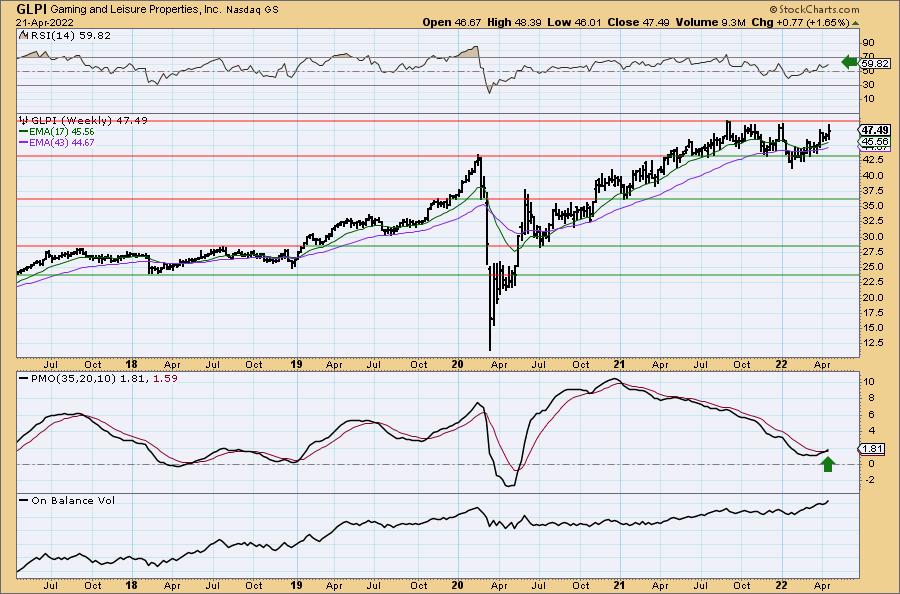
The weekly chart suggests a breakout ahead. The weekly PMO is now on a crossover BUY signal. It is pushing at all-time highs so consider an upside target of 14% around $54.14.
Kaman Corp. (KAMN)
EARNINGS: 5/4/2022 (AMC)
Kaman Corp. engages in the design, manufacture and distribution of aircrafts, aircraft parts and components. It operates through the following three segments: Engineered Products, Precision Products and Structures. The firm produces and markets proprietary aircraft bearings and components, super precision, miniature ball bearings, proprietary spring energized seals, springs and contacts, complex metallic and composite aero structures for commercial, military, and general aviation fixed and rotary wing aircraft, and safe and arming solutions for missile and bomb systems for the U.S. and allied militaries. The company was founded by Charles H. Kaman in 1945 and is headquartered in Bloomfield, CT.
Predefined Scans Triggered: New CCI Buy Signals and Shooting Star.
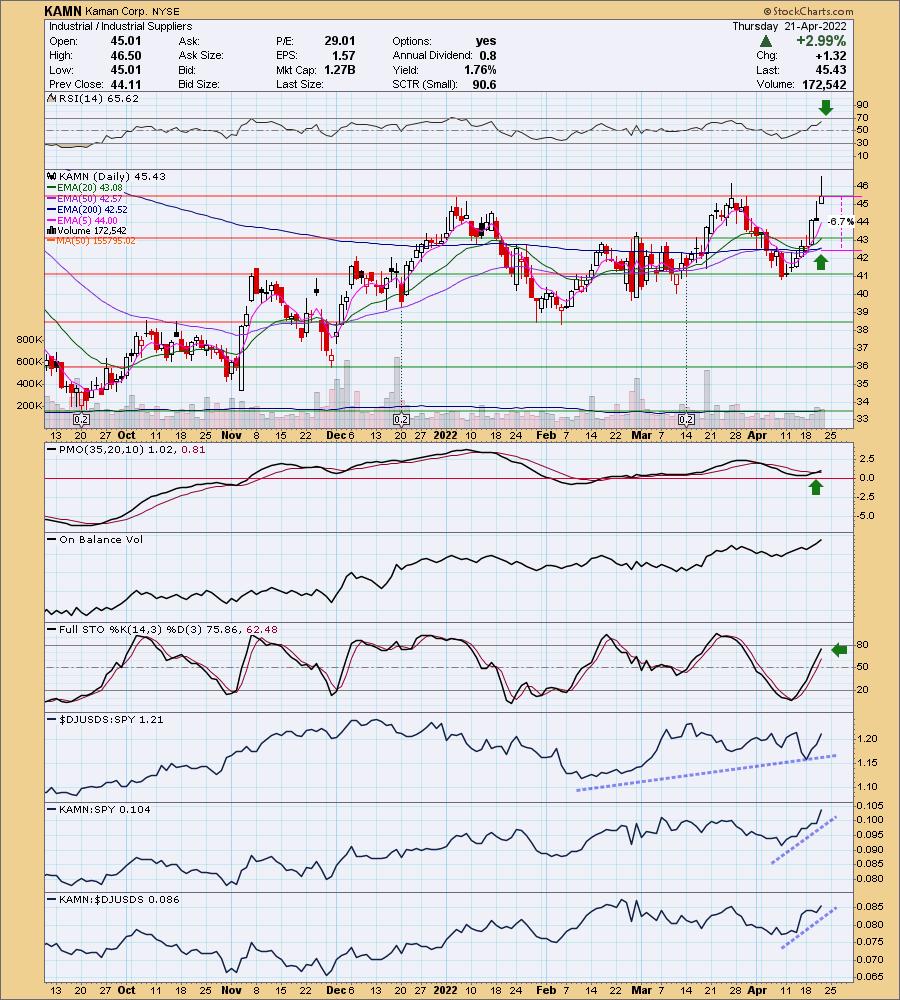
KAMN is unchanged in after hours trading. I never like to see a bearish shooting star candlestick. However, the rest of the chart is quite favorable. KAMN saw an LT Trend Model "Golden Cross" BUY signal as the 50-day EMA crossed above the 200-day EMA. The RSI is positive, rising and not overbought. The PMO just had a crossover BUY signal. The OBV is confirming today's intraday breakout as it set a higher high too. Stochastics are rising strongly with no hesitation. Overall relative performance in the short term is very good. The stop is set below the 50/200-day EMAs.
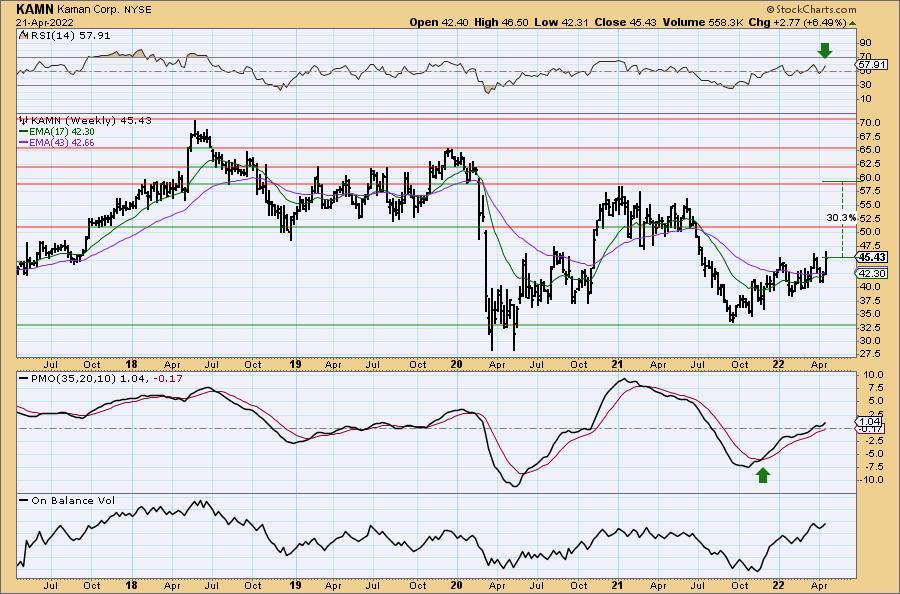
The weekly RSI is positive and rising. The weekly PMO is on a crossover BUY signal and just moved above the zero line. Overhead resistance is on its way at the 2019 lows, but given the bullish indicators, I think it will overcome. If it does, the upside target is over 30%.
Universal Corp. (UVV)
EARNINGS: 5/25/2022 (AMC)
Universal Corp. is a business-to-business agro-products supplier to consumer product manufacturers that sources and processes leaf tobacco and plant-based ingredients. It operates through the following segments: Tobacco Operations and Ingredients Operations. The Tobacco Operations segment includes selecting, procuring, processing, packing, storing, shipping, and financing leaf tobacco for sale to, or for the account of, manufacturers of consumer tobacco products throughout the world. The Ingredients Operations segment provides customers with a variety of plant-based ingredients for both human and pet consumption. The company was founded in 1918 and is headquartered in Richmond, VA.
Predefined Scans Triggered: New 52-week Highs, P&F Double Top Breakout and P&F Bullish Triangle.
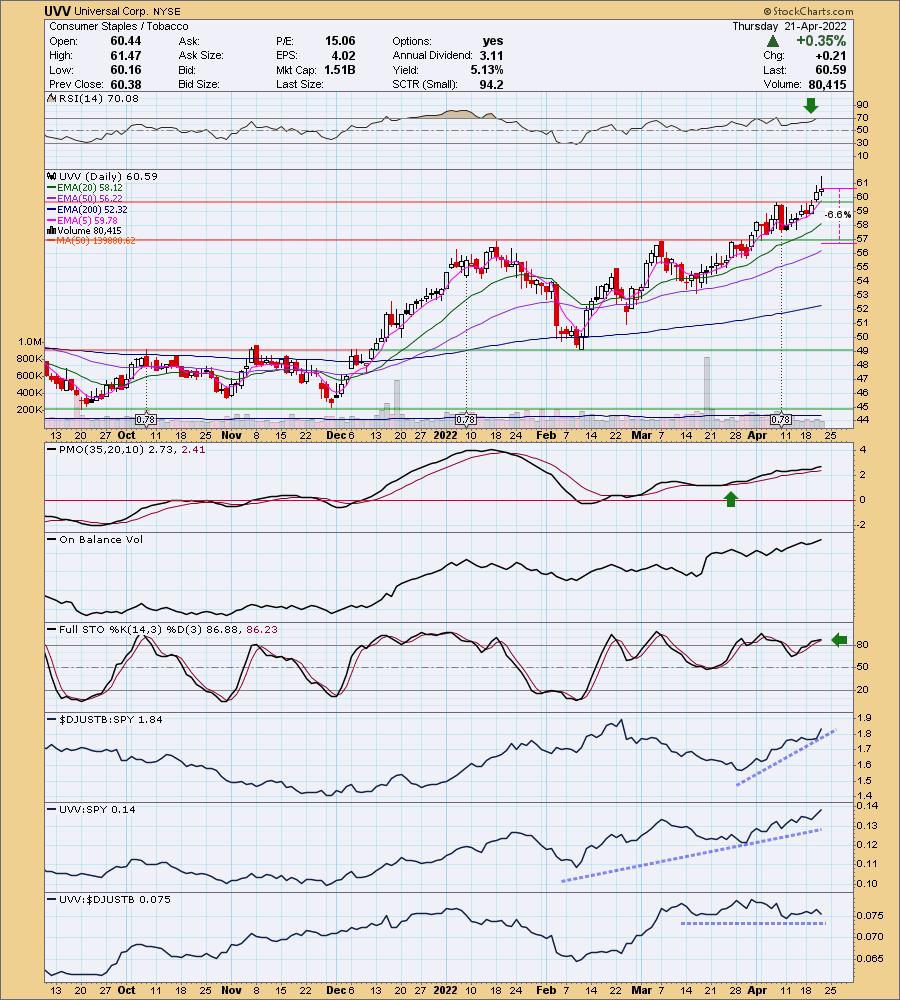
UVV is up +0.81% in after hours trading. It's probably my favorite reader request today as everything is going right for it. The RSI is positive and rising, albeit somewhat overbought. That doesn't worry me based on the length of time it remained overbought in December and January. The PMO is rising slowly on a whipsaw crossover BUY signal and is not overbought. Stochastics are oscillating above 80 again. Relative strength for the group and stock against the SPY is excellent. UVV is performing in line with the group which is working to its advantage against the SPY. The stop can be set fairly tight below support at the January/March highs.
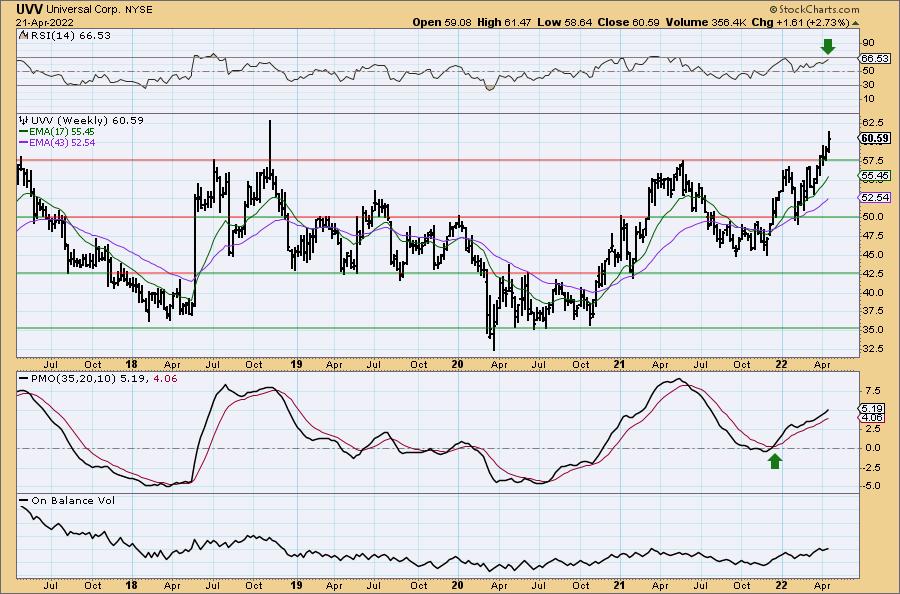
We have a strong breakout on UVV on the weekly chart. The weekly RSI is positive and rising and the weekly PMO is rising on a crossover BUY signal and is not overbought. It is near all-time highs, so consider a 14% upside target around $69.07.
Get Erin's FREE Presentation Recording from Synergy Trader's "Tech Wizards" Event!
Hurry! You will not be able to download the recording after tonight!
Erin presented Tuesday at the "Tech Wizards" Panel Event. She covered the DecisionPoint Analysis Process followed by her "trading rules" for timing entries and exits. Click HERE to get the recording. Thank you for your support of our work!
Don't forget, on Thursdays I look at reader-requested symbols, click HERE to shoot me an email. I read every email I receive and try to answer them all!
Current Market Outlook:
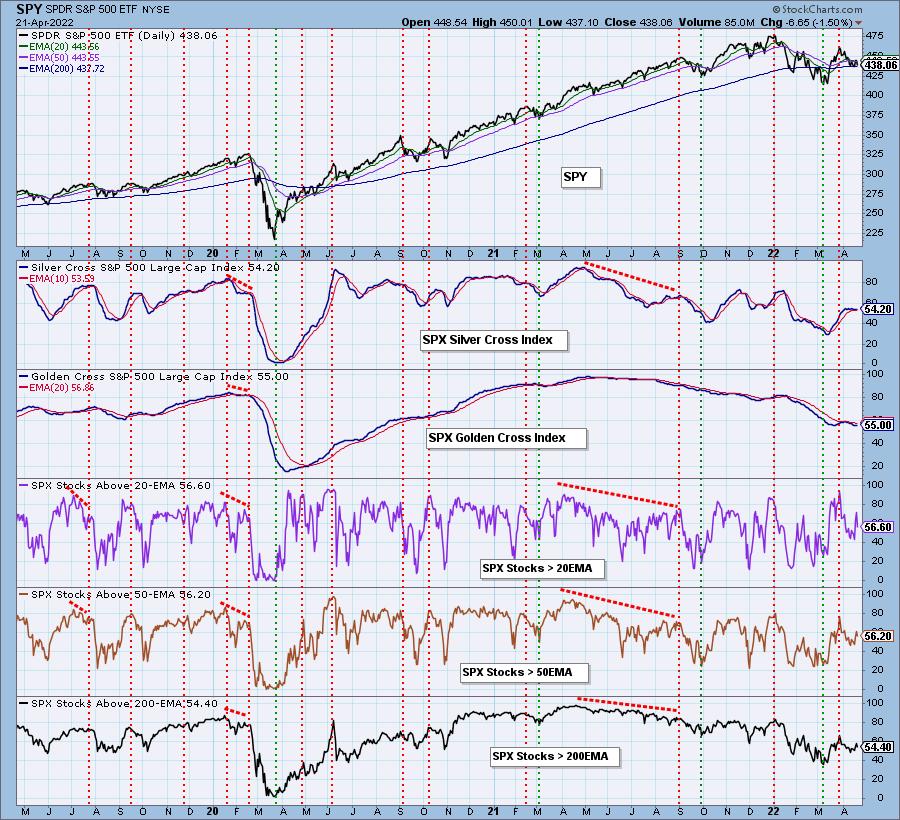
Market Environment: It is important to consider the odds for success by assessing the market tides. The following chart uses different methodologies for objectively showing the depth and trend of participation for intermediate- and long-term time frames.
- The Silver Cross Index (SCI) shows the percentage of SPX stocks on IT Trend Model BUY signals (20-EMA > 50-EMA)
- The Golden Cross Index (GCI) shows the percentage of SPX stocks on LT Trend Model BUY signals (50-EMA > 200-EMA)
Don't forget that as a "Diamonds" member, you have access to our GCI/SCI curated ChartList on DecisionPoint.com. You'll find it under "Members Only" links on the left side on the Blogs and Links Page.
Here is the current chart:
Full Disclosure: I'm 20% invested and 80% is in 'cash', meaning in money markets and readily available to trade with.
I'm required to disclose if I currently own a stock and/or may buy it within the next 72 hours.
Good Luck and Good Trading!
- Erin
"Technical Analysis is a windsock, not a crystal ball." - Carl Swenlin
(c) Copyright 2022 DecisionPoint.com
Watch the latest episode of DecisionPoint with Carl & Erin Swenlin on Mondays 7:00p EST or on the DecisionPoint playlist on the StockCharts TV YouTube channel here!
NOTE: The stocks reported herein are from mechanical trading model scans that are based upon moving average relationships, momentum and volume. DecisionPoint analysis is then applied to get five selections from the scans. The selections given should prompt readers to do a chart review using their own analysis process. This letter is not a call for a specific action to buy, sell or short any of the stocks provided. There are NO sure things or guaranteed returns on the daily selection of "Diamonds in the Rough."
Helpful DecisionPoint Links:
DecisionPoint Shared ChartList and DecisionPoint Chart Gallery
Price Momentum Oscillator (PMO)
Swenlin Trading Oscillators (STO-B and STO-V)
For more links, go to DecisionPoint.com