
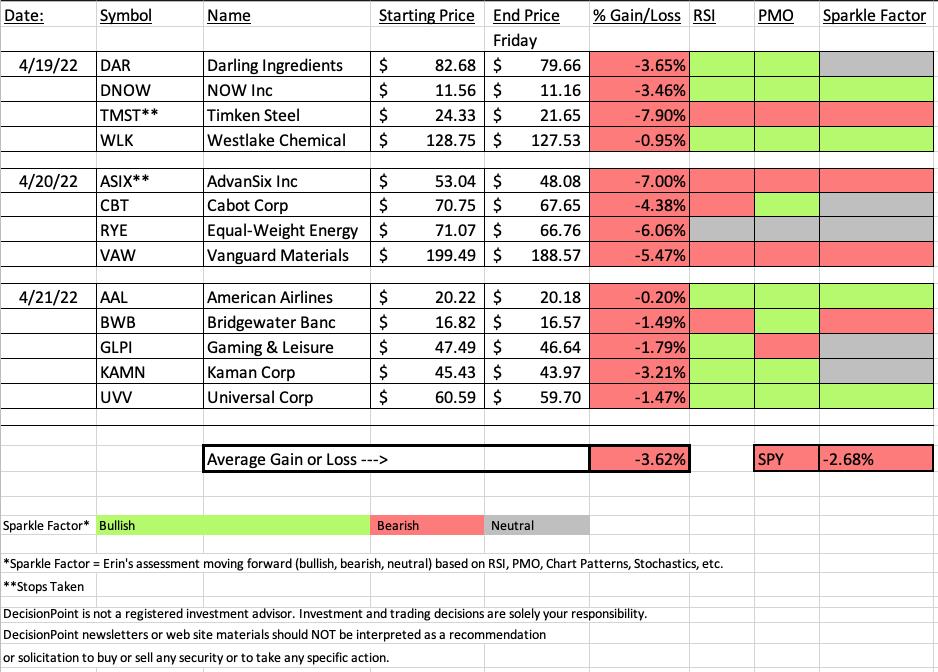
The market tanked this week and unfortunately most "Diamonds in the Rough" fell prey to overall downside pressure of the bear market. I'll be seriously considering the addition of inverse ETFs next week, but it is always darkest before the dawn.
This week's "Darling" was American Air Lines (AAL). If you'd told me that at the beginning of the week, I wouldn't really believe you. However, after reporting solid earnings and with the increase in air travel, airlines are now looking fairly good.
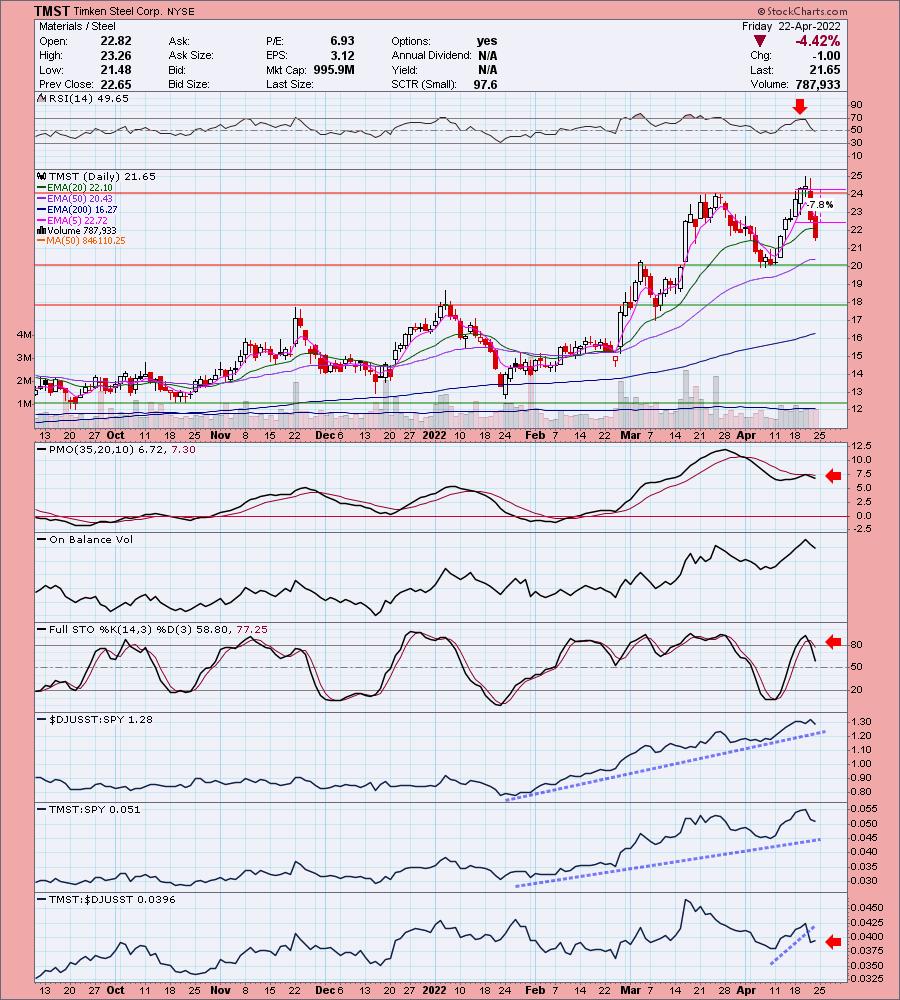
We had to take two stops this week so picking the "Dud" came down to which was actually down furthest without taking the stop. That award goes to Timken Steel (TMST). This is another that crashed unexpectedly. Had we not set a stop of -7.9%, the position would've been down -11.02%!
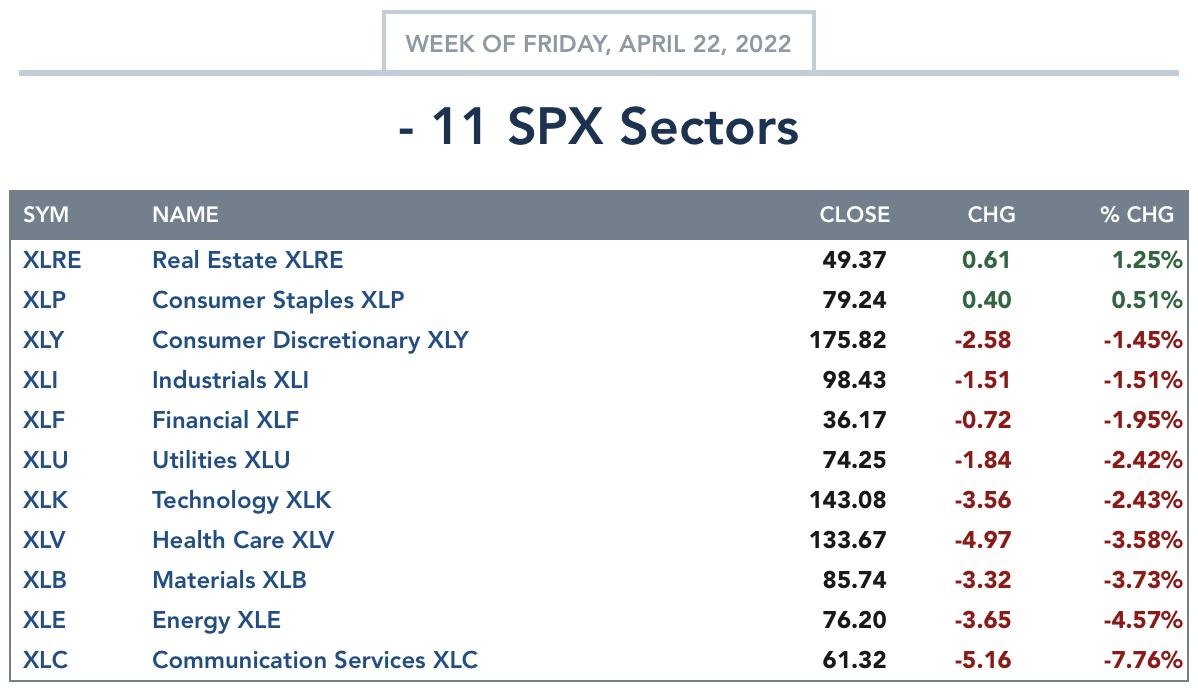
All of the sectors looks sickly right now, but of them all, Consumer Staples (XLP) looks the best--not that bullish, but the best of the eleven SPDR sector ETFs.
Signing off! See you in Monday's Free DP Trading Room or catch the next DP Diamonds Report on Tuesday!
Have a great weekend!
Erin

RECORDING LINK (4/22/2022):
Topic: DecisionPoint Diamond Mine (4/22/2022) LIVE Trading Room
Start Time: Apr 22, 2022 09:00 AM PT
Meeting Recording Link.
Access Passcode: April%22
REGISTRATION FOR Friday 4/29 Diamond Mine:
When: Apr 29, 2022 09:00 AM Pacific Time (US and Canada)
Topic: DecisionPoint Diamond Mine (4/29/2022) LIVE Trading Room
Register in advance for this webinar HERE.
Save the registration confirmation email with login instructions in case Zoom doesn't notify you in time.

Free DP Trading Room (4/18/2022) RECORDING LINK:
Topic: DecisionPoint Trading Room
Start Time: Apr 18, 2022 09:00 AM PT
Meeting Recording Link.
Access Passcode: April#18th
For best results, copy and paste the access code to avoid typos.
A few items about the spreadsheet: I've put on the spreadsheet whether the RSI is positive (green) or negative (red). The PMO column tells you if it is rising (green) or falling (red). Finally I've added my own "Sparkle Factor" that gives you my assessment going forward, bullish (green), bearish (red) or neutral (gray). The Sparkle Factor is basically my thoughts on whether I expect it to rise or fall. A neutral means it could really go either way so it could be added to a watch list. If you're in a stock I consider "neutral" going forward, the ball is in your court.
Darling:
American Airlines Group Inc. (AAL)
EARNINGS: 4/21/2022 (BMO)
American Airlines Group, Inc. is a holding company, which engages in the operation of a network carrier through its principal wholly-owned mainline operating subsidiary, American. The firm offers air transportation for passengers and cargo. It operates through the following geographical segments: Department of Transportation Domestic, Department of Transportation Latin America, Department of Transportation Atlantic, and Department of Transportation Pacific. The company was founded on December 9, 2013 and is headquartered in Fort Worth, TX.
Predefined Scans Triggered: Moved Above Upper Keltner Channel, Moved Above Upper Bollinger Band, Filled Black Candles, Moved Above Upper Price Channel and P&F Double Top Breakout.
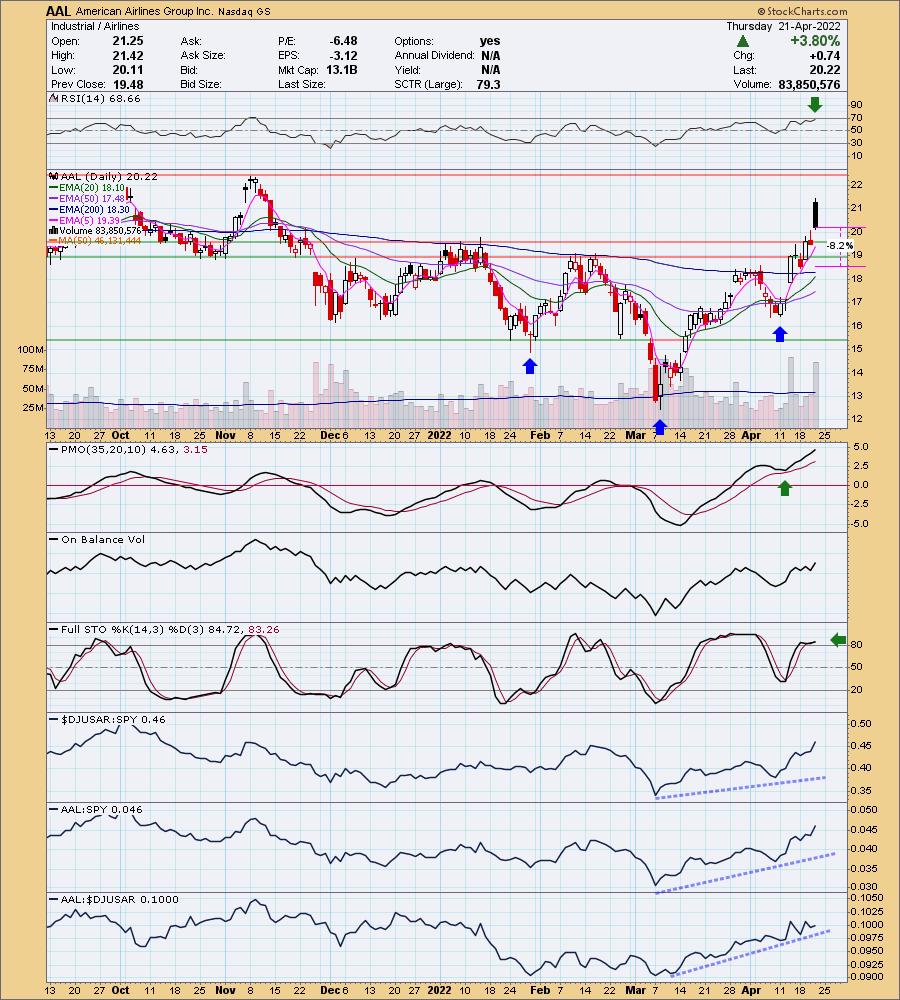
Chart and Commentary from Thursday (4/21):
"AAL is down -0.25% in after hours trading. I've covered AAL twice before on May 18th 2021 and January 13th 2022, both positions stopped out. The stock that was actually requested was Southwest Airlines (LUV), but I really liked this chart better as it is a leader within the group right now based on relative strength. I do not like today's filled black candlestick on earnings, but overall it fared well so I expect follow-through. Overhead resistance is nearing so we need to be cautious. The RSI is positive and the PMO is on a BUY signal after recently topping above its signal line. I see a possible bullish reverse head and shoulders pattern that was confirmed with today's breakout. I've set the stop below strong support at October/November lows and January/February highs."
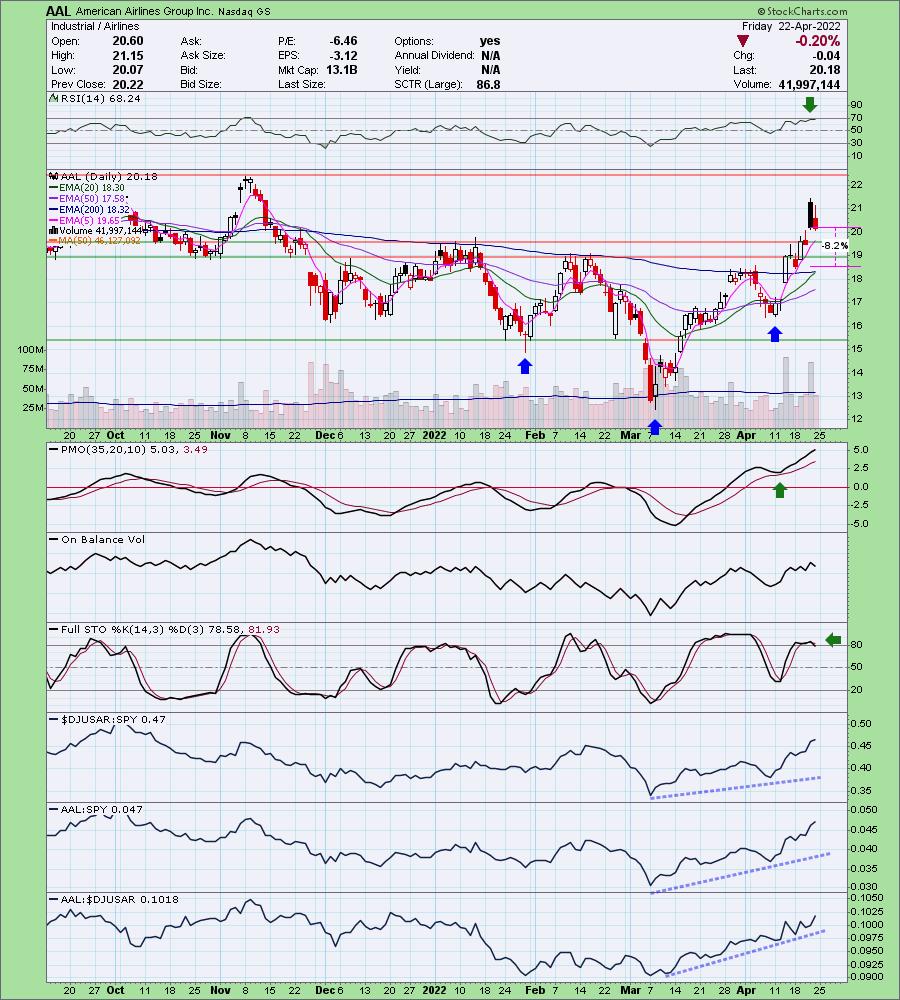
Here is today's chart:
Yesterday's bearish filled black candlestick "won" the day, pushing price a bit lower with no challenge of yesterday's intraday high. I still like AAL but it is getting near overhead resistance. I've annotated a reverse head and shoulders pattern and indicators are mostly strong, the exception being topping Stochastics. I think it definitely deserves a place in your watch lists. I know it will be on mine.
Don't forget, on Thursdays I look at reader-requested symbols, so shoot me an email at erin@decisionpoint.com. I read every email I receive and try to answer them all!
Dud:
Timken Steel Corp. (TMST)
EARNINGS: 5/5/2022 (AMC)
TimkenSteel Corp. engages in the manufacture of alloy, carbon and micro-alloy steel products. The firm's products includes special bar quality steel, seamless mechanical tubing, gears, grades of steel, jumbo bloom vertical caster, TimkenSteel ultrapremium technology, and TimkenSteel endurance steels. Its services include thermal treatment, value added components, technical support and testing, supply chain, and TimkenSteel portal. The company was founded on October 24, 2013 and is headquartered in Canton, OH.
Predefined Scans Triggered: New 52-week Highs, New CCI Buy Signals, Moved Above Upper Keltner Channel and Moved Above Upper Price Channel.
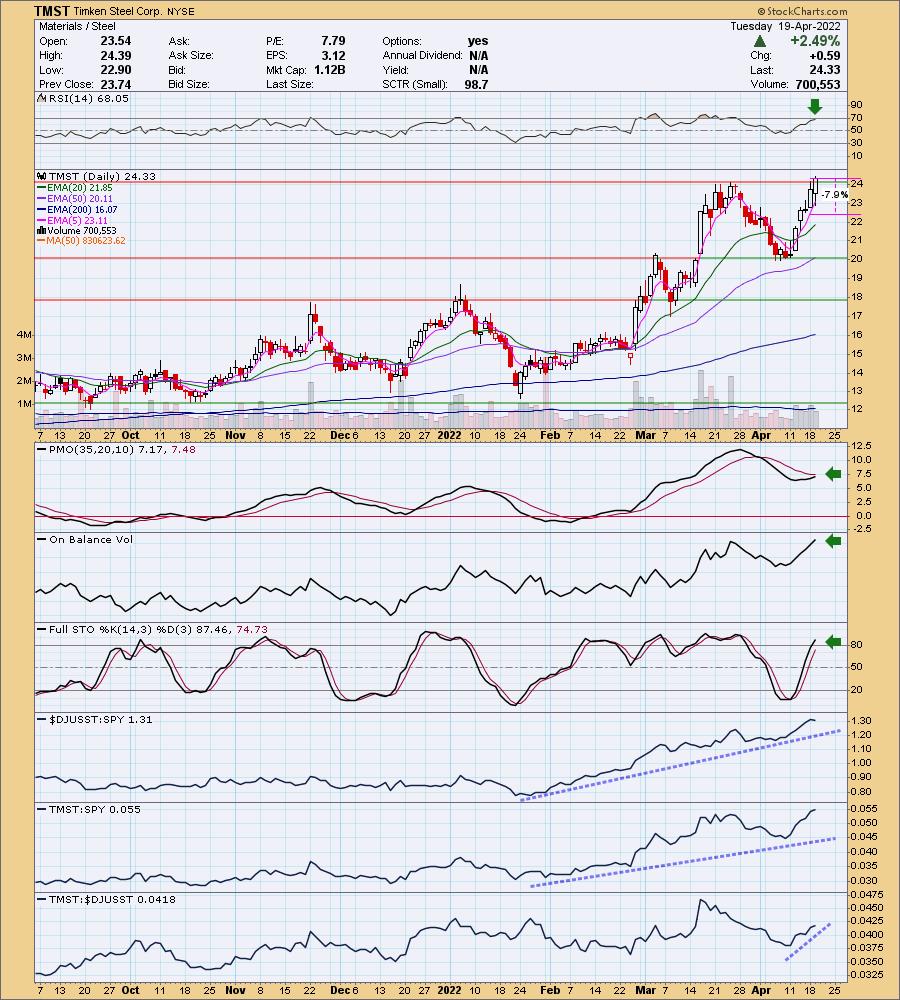
Chart and Commentary from Tuesday (4/19):
"TMST is down -0.95% in after hours trading. I wasn't happy to see given I picked this one primarily for its breakout today. However, I still think this one has potential if Steel is going to continue to outperform. I like this group and there are plenty of choices within so you can go with this one or find one you like. The RSI is positive and the PMO is going in for a crossover BUY signal. Stochastics have now moved above 80 suggesting internal strength. The OBV made a new high as price did so it is confirming the breakout. Relative performance of the group is strong. TMST has begun to outperform the group and has been a winner against the SPY since February. The stop is set at around 8% somewhat arbitrarily given I don't see a support level."
Here is today's chart:
Despite a strong StockCharts Technical Rank (SCTR), this one completely collapsed. I don't know the fundamentals here, but the industry group fell over 5.3% today. TMST fell a day earlier than the industry group. Nothing is going well on the chart now. I wouldn't consider it a shorting candidate because support is nearby. At the same time, I don't think it deserves a spot in your watch list either due to the bearish double-top pattern.
TODAY'S Sector Performance:
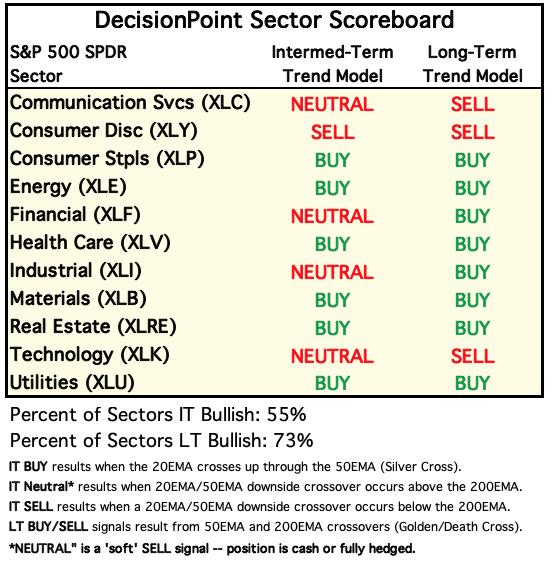
DecisionPoint Sector Scoreboard (Mechanical Trend Model Signals):
Click Here to view Carl's annotated Sector ChartList!
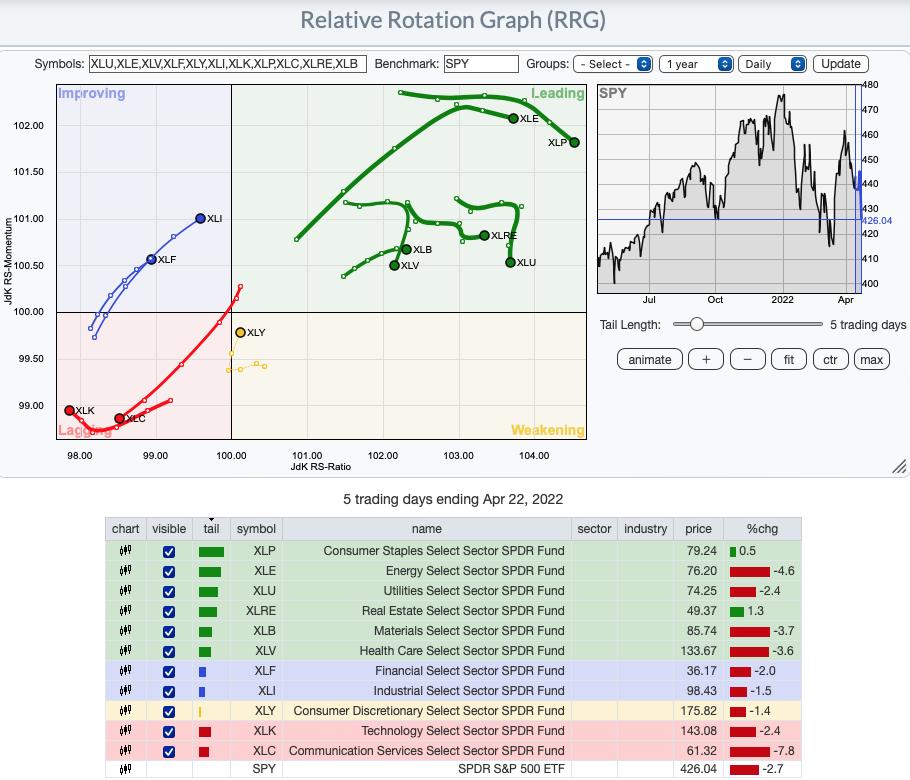
Short-term (Daily) RRG:
"Most Improved" award goes to Industrials (XLI) and Financials (XLF). Both are traveling strongly in the bullish northeast direction and are in the Improving quadrant.
Consumer Discretionary (XLY) has reversed headings and now has a bullish northeast heading as it moves toward Leading out of Weakening quadrant.
Most bearish are Technology (XLK) and Communication Services (XLC). Both are the only residents in the Lagging quadrant. XLK looks slightly better as it is at least trying to hook around toward the Improving quadrant.
The remainder are in the Leading quadrant. Currently Real Estate (XLRE) and Materials (XLB) have the most bullish heading (northeast). However, the others are comfortably seated in the Leading quadrant and don't appear ready to drop into the Weakening quadrant just yet.
Intermediate-Term (Weekly) RRG:
The longer-term RRG doesn't completely agree with the shorter-term, daily RRG.
XLK has a bearish southwest heading in the Lagging quadrant. On the daily version, it has a more bullish heading of northwest. XLC is in the Improving quadrant, not Lagging, but I wouldn't hold out much hope even in the longer term. XLY is healthier on weekly RRG given it is headed north toward the Improving quadrant.
Financials (XLF) is very bearish on the weekly RRG. With its bearish southwest heading, it should hit the Lagging quadrant very soon.
The others are situated in the Leading quadrant, similar to daily RRG. However, all but Energy (XLE) have bullish northeast headings in the longer term. XLE has shown leadership for so long, but it appears it is cooling.
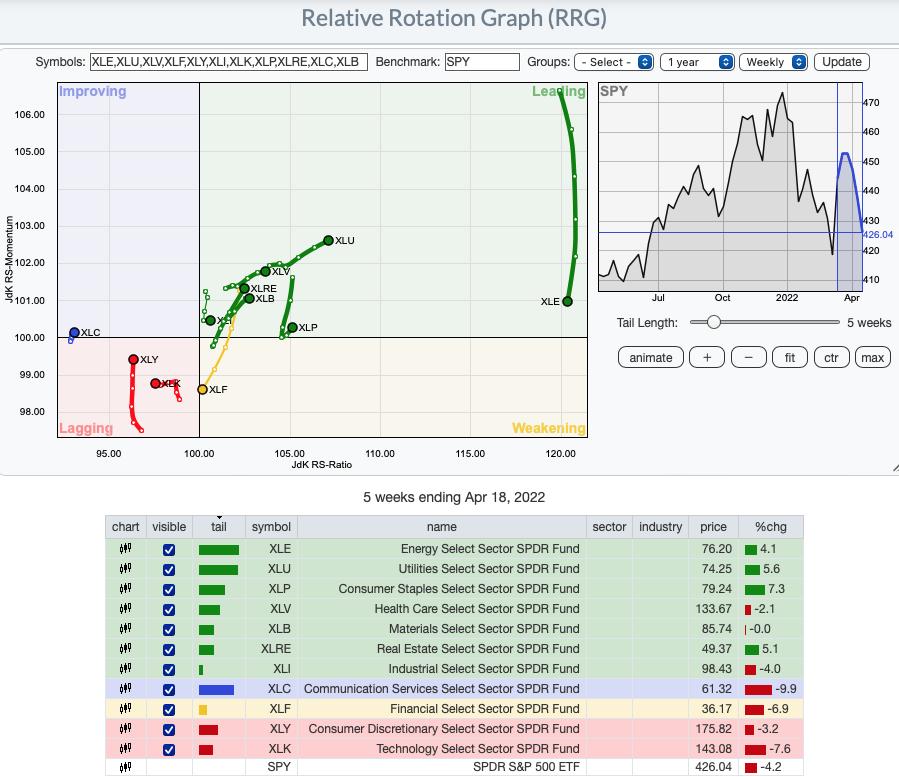
RRG® charts show you the relative strength and momentum for a group of stocks. Stocks with strong relative strength and momentum appear in the green Leading quadrant. As relative momentum fades, they typically move into the yellow Weakening quadrant. If relative strength then fades, they move into the red Lagging quadrant. Finally, when momentum starts to pick up again, they shift into the blue Improving quadrant.
CLICK HERE for an animated version of the RRG charts.
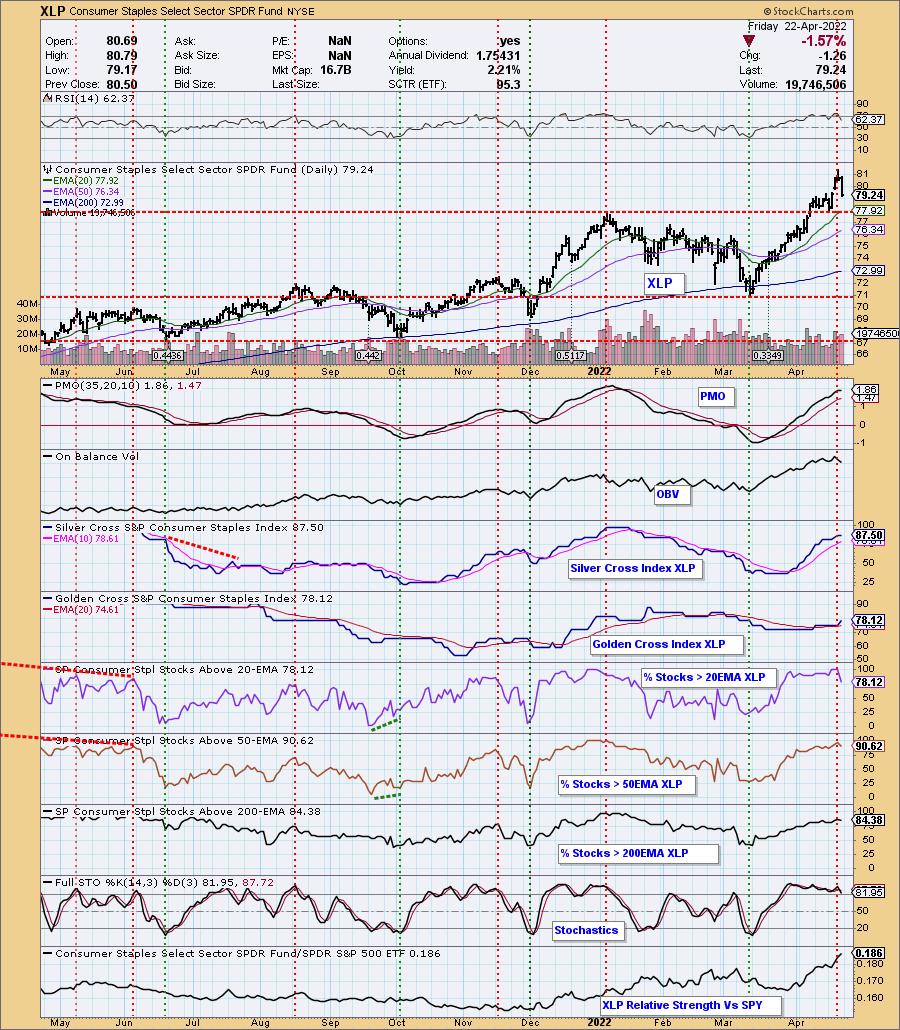
Sector to Watch: Consumer Staples (XLP)
None of the sectors look especially healthy, but I'm going with Consumer Staples as it is a defensive sector and if this decline is going to continue, it could see some strength. However, overall, pockets of strength are getting nearly impossible to find. The Silver Cross/Golden Cross Indexes (SCI/GCI) are both above 70% and are rising. We're not seeing much deterioration in participation of stock above their 20/50/200-day EMAs. The RSI is now out of overbought territory. The PMO is still rising, but is overbought. Stochastics are holding above 80, barely. As you can the sector is performing well against the SPY.
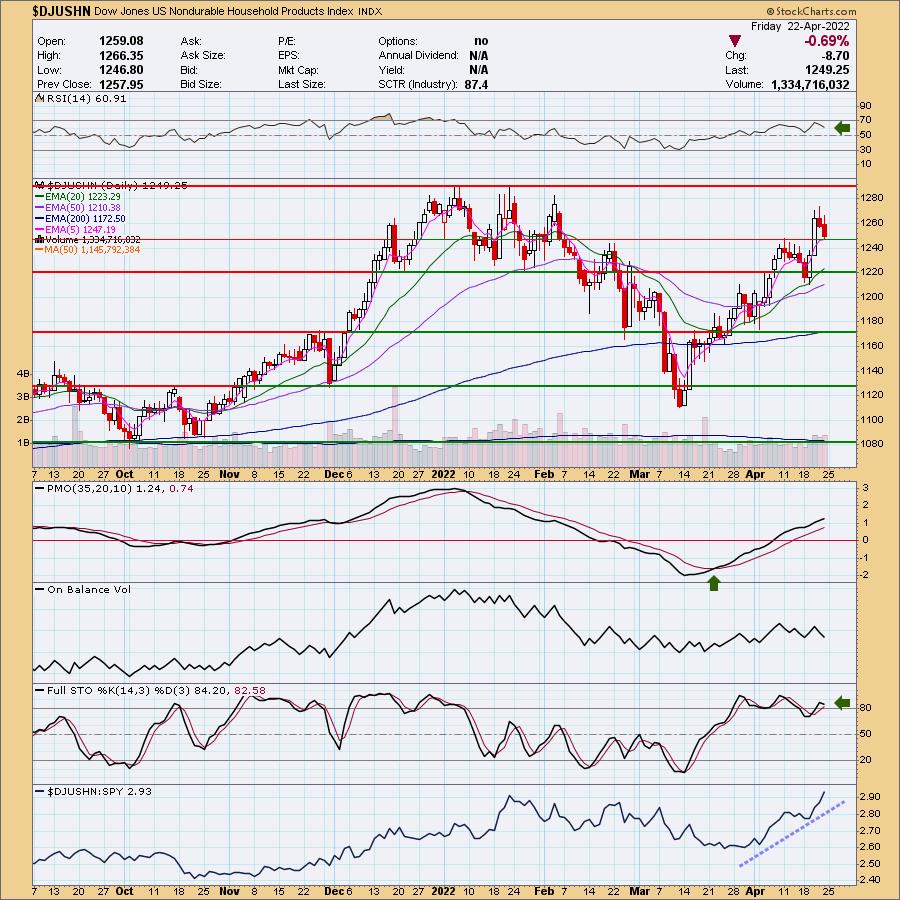
Industry Group to Watch: Nondurable Household Products ($DJUSHN)
I changed my mind since the Diamond Mine trading room. I decided I liked this one best. It pulled back, but that has been its personality on this rally. Considering the market was down much further the last two day, I like that it has pulled back only to support. The RSI is positive and the PMO is rising nicely. Stochastics are still above 80 and it is clearly an outperforming industry group against the SPY.
Go to our Sector ChartList on DecisionPoint.com to get an in-depth view of all the sectors.
Good Luck & Good Trading!
- Erin
erin@decisionpoint.com
Full Disclosure: I'm 20% exposed to the market, but I likely pare back down to 10-15% next week.
Watch the latest episode of DecisionPoint with Carl & Erin Swenlin on Mondays 7:00p EST or on the DecisionPoint playlist on the StockCharts TV YouTube channel here!
Technical Analysis is a windsock, not a crystal ball. --Carl Swenlin
NOTE: The stocks reported herein are from mechanical trading model scans that are based upon moving average relationships, momentum and volume. DecisionPoint analysis is then applied to get five selections from the scans. The selections given should prompt readers to do a chart review using their own analysis process. This letter is not a call for a specific action to buy, sell or short any of the stocks provided. There are NO sure things or guaranteed returns on the daily selection of "diamonds in the rough."
Helpful DecisionPoint Links:
DecisionPoint Shared ChartList and DecisionPoint Chart Gallery
Price Momentum Oscillator (PMO)
Swenlin Trading Oscillators (STO-B and STO-V)
(c) Copyright 2022 DecisionPoint.com