
Again, the "Diamond PMO Scan" came through today. I was able to easily find some great "Diamonds in the Rough" today to add to the four from yesterday that all finished higher on the day. The most interesting are two ETFs that take advantage of the relative strength in Energy and Materials.
I've considered doing an "ETF Day" in DP Diamonds reports, but to be honest, some days there are no ETFs that show up in the scan results. I'm attempting to make a better effort to include a few each week. With that in mind, today's theme was Energy ETFs and a Materials ETF. They both are showing increasing relative strength when compared to their SPDR Sector ETFs. I believe one or both will be in my portfolio tomorrow.
Tomorrow is Reader Request Day, so send those ChartLists or symbol requests by tomorrow morning. If you'd like to send a StockCharts ChartList, use my StockCharts email: erinh@stockcharts.com. All other requests should be sent HERE.
Today's "Diamonds in the Rough": ASIX, CBT, RYE and VAW.
Stocks to Review: FXZ, MTDR, CW and SU.

Diamond Mine RECORDING LINK (4/14/2022):
Topic: DecisionPoint Diamond Mine (4/14/2022) LIVE Trading Room
Start Time: Apr 14, 2022 09:00 AM
Meeting Recording Link.
Access Passcode: April@14
REGISTRATION FOR 4/22 Diamond Mine:
When: Apr 22, 2022 09:00 AM Pacific Time (US and Canada)
Topic: DecisionPoint Diamond Mine (4/22/2022) LIVE Trading Room
Register in advance for this webinar HERE.
** Save the registration confirmation email with login instructions in case Zoom doesn't notify you in time.**

Free DP Trading Room (4/18) RECORDING LINK:
Topic: DecisionPoint Trading Room
Start Time: Apr 18, 2022 08:59 AM
Meeting Recording Link.
Access Passcode: April#18th
For best results, copy and paste the access code to avoid typos.
Welcome to DecisionPoint Daily Diamonds, wherein I highlight ten "Diamonds in the Rough" per week. These are selected from the results of my DecisionPoint Scans, which search for stocks that could benefit from the trend and condition of the market. Remember, these are not recommendations to buy or sell, but are the most interesting of the stocks that surfaced in my scans. My objective is to save you the work of the initial, tedious culling process, but you need to apply your own analysis to see if these stocks pique your interest as well. There are no guaranteed winners here!
"Predefined Scans Triggered" are taken from StockCharts.com using the "Symbol Summary" option instead of a "SharpChart" on the workbench.
AdvanSix, Inc. (ASIX)
EARNINGS: 5/6/2022 (BMO)
Advansix, Inc. engages in the development and production of nylon resin products and other additives. The firm's products include nylon resin, caprolactam, ammonium sulfate fertilizer and chemical intermediates. It offers products to carpet, engineering plastic, food packaging, building and construction, composites, plant nutrition, paints and coating markets. The company was founded on May 4, 2016 and is headquartered in Parsippany, NJ.
Predefined Scans Triggered: New CCI Buy Signals and P&F Low Pole.
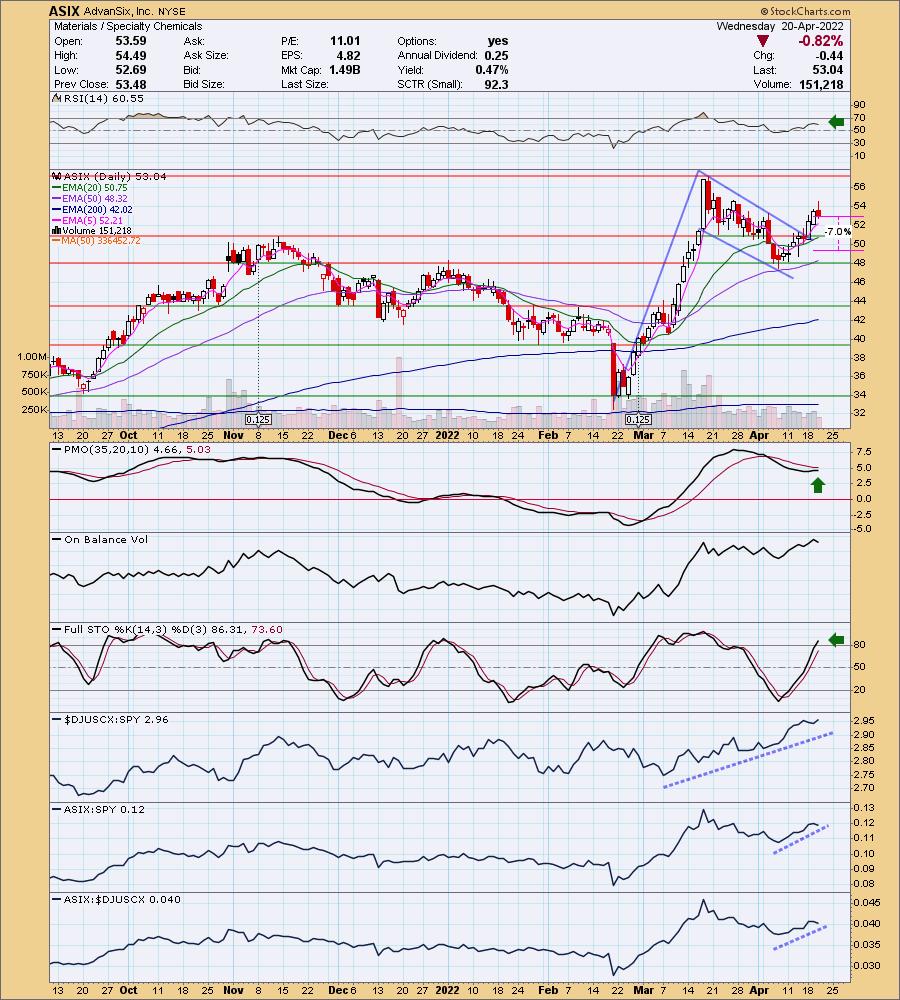
ASIX is unchanged in after hours trading. I covered ASIX on April 27th 2020. The timing was perfect. The position is still open and is up an incredible 404.2% since! And no, I sadly do not own it. I don't know if my timing will be as good here, but this breakout from a bullish flag formation looks pretty bullish. Today's nearly 1% decline makes it even more attractive. The RSI is positive and the PMO is still rising toward a crossover BUY signal. Stochastics are now above 80. Relative strength is excellent as far as the group and ASIX is gaining relative strength against the group and the SPY in the short term. The stop is set below the November high.
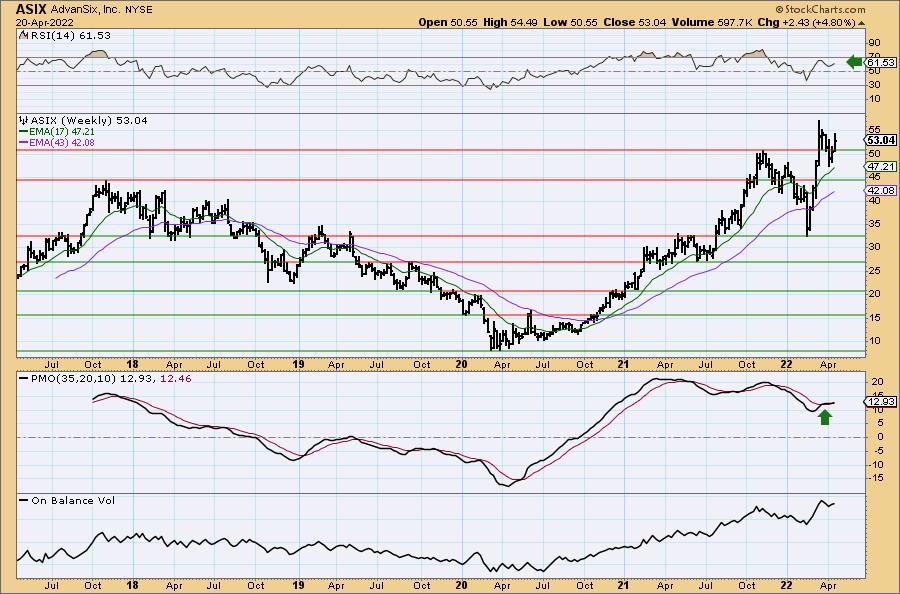
You can see that large flag formation and the rebound off the 17-week EMA. The weekly PMO is on a crossover BUY signal and the weekly RSI is positive, rising and not overbought. This one is near all-time highs so consider an upside target of 15% around $61.00.
Cabot Corp. (CBT)
EARNINGS: 5/2/2022 (AMC)
Cabot Corp. is a global specialty chemicals and performance materials company. Its products are rubber and specialty grade carbon blacks, specialty compounds, fumed metal oxides, activated carbons, inkjet colorants, and aerogel. The company operates through the following segments: Reinforcement Materials, Performance Chemicals, and Purification Solutions. The Reinforcement Materials segment involves the rubber blacks and elastomer composites product lines. The Performance Chemicals segment combines the specialty carbons and compounds and inkjet colorants product lines into the specialty carbons and formulations business. The Purification Solutions segment refers to the activated carbon business and the specialty fluids segment. The company was founded by Godfrey Lowell Cabot in 1882 and is headquartered in Boston, MA.
Predefined Scans Triggered: New CCI Buy Signals, Moved Above Ichimoku Cloud and P&F Low Pole.
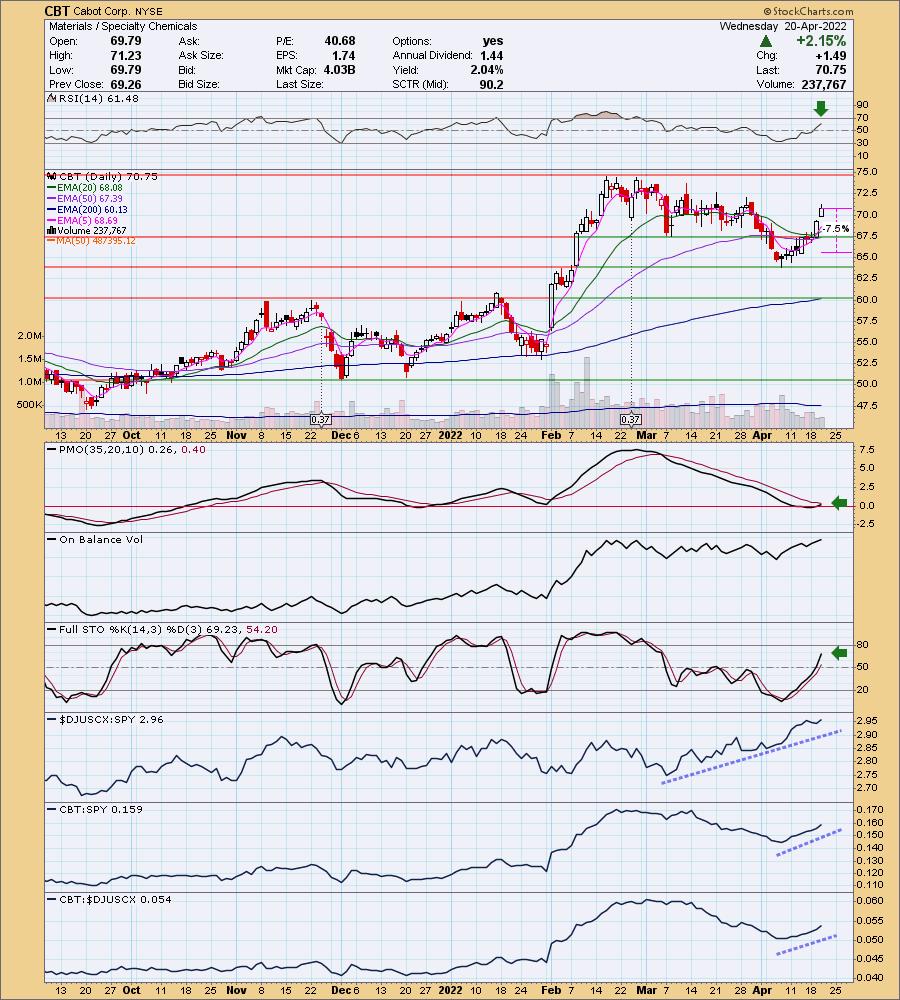
CBT is unchanged in after hours trading. I covered CBT on February 23rd 2021. The position is still open and is up +40.5%. While this price bottom isn't coming off strong support on the daily chart, you'll see in the weekly chart that it is strong support at 2018 highs and 2021 high. The RSI is positive, rising and not overbought. The PMO is about to trigger a crossover BUY signal. Stochastics are rising in positive territory. Relative strength is positive against the group and SPY. The group is doing well too. The stop is set a little more than halfway down the previous trading range. If you can stomach it, a 9.5% stop should bring you under the April low.
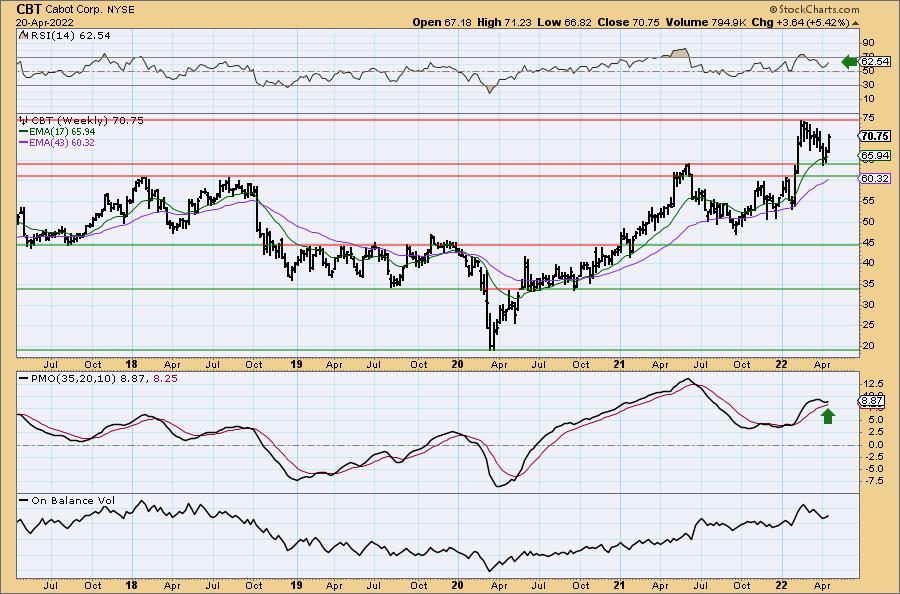
Now you can see the strong support zone this bounce is coming off. The weekly RSI is rising in positive territory and isn't overbought. The weekly PMO just bottomed above its signal which is especially bullish. Add to that, the PMO is not overbought. It is near all-time highs, so consider a 15% stop around $81.36.
Invesco S&P 500 Equal Weight Energy ETF (RYE)
EARNINGS: N/A
RYE tracks an equal-weighted index of US energy companies in the S&P 500.
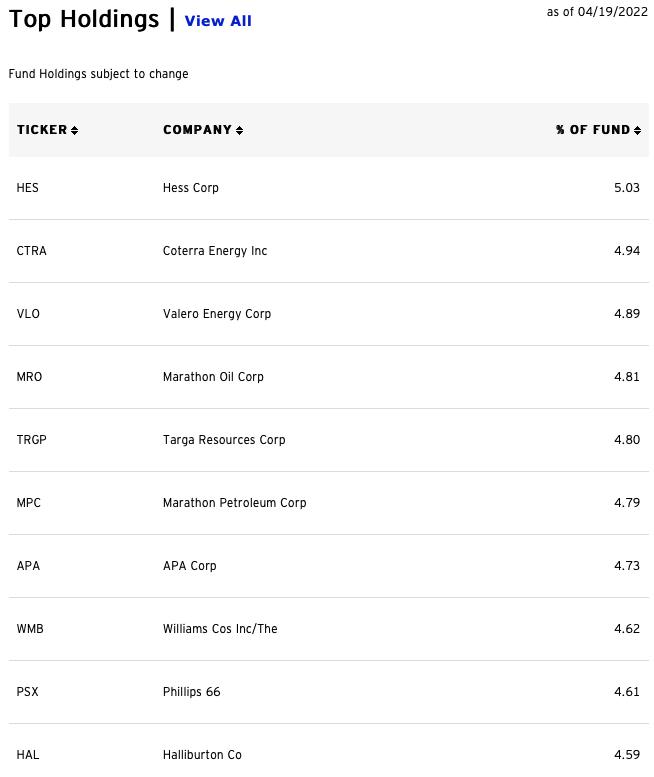
Predefined Scans Triggered: Filled Black Candles, P&F Double Top Breakout and P&F Triple Top Breakout.
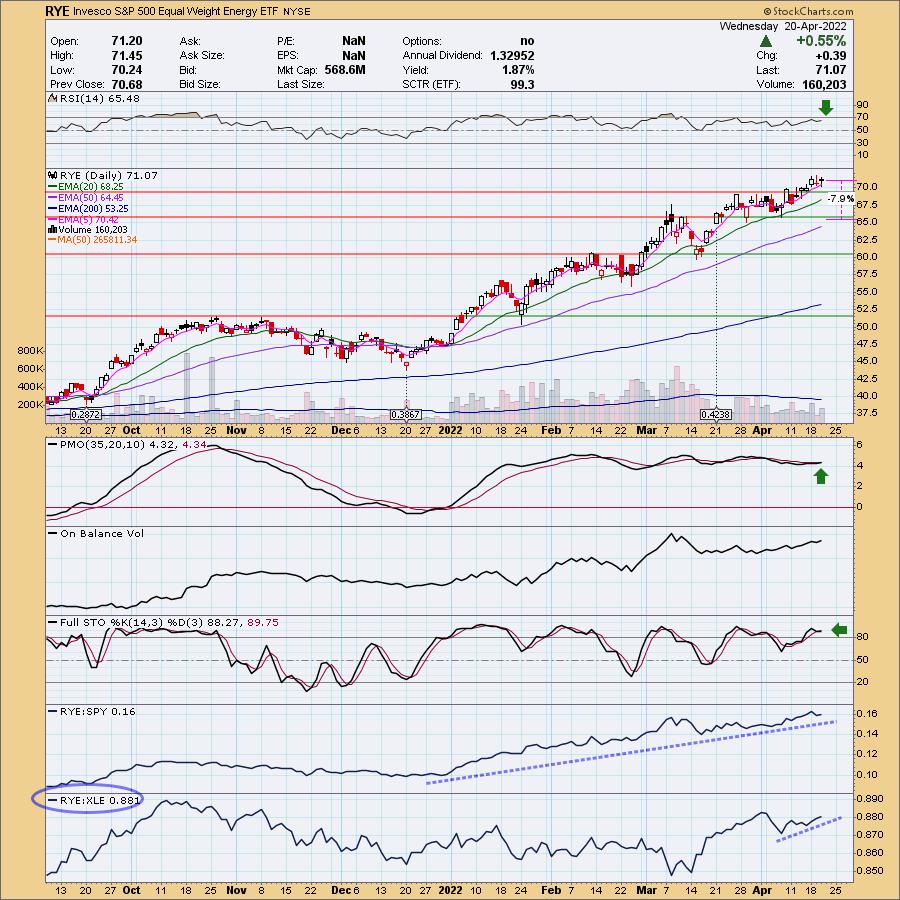
RYE is the equal-weight version of the Energy SPDR (XLE). I note that in after hours trading, RYE is down -1.49% while XLE is up +0.10%. This is the rub of equal-weight ETFs: They will go up faster than cap-weighted indexes, but will fall faster than the cap-weighted indexes. That is typical, not a rule. I picked RYE because it is beginning to outperform XLE on this rally. It broke out, but finished with a black candlestick today. Based on after hours trading, that is being fulfilled. I still like this ETF, but watch your 5-minute candlestick chart tomorrow if you want to buy it. The RSI is positive and the PMO should trigger a crossover BUY signal. The PMO has been flat most of the year, but that is due to the steady rising trend that isn't showing acceleration nor deceleration. Stochastics are above 80 and oscillating. Relative strength against the SPY is great and it has been outperforming XLE since mid-March minus the early April plunge. The stop is set beneath support at 7.9%.
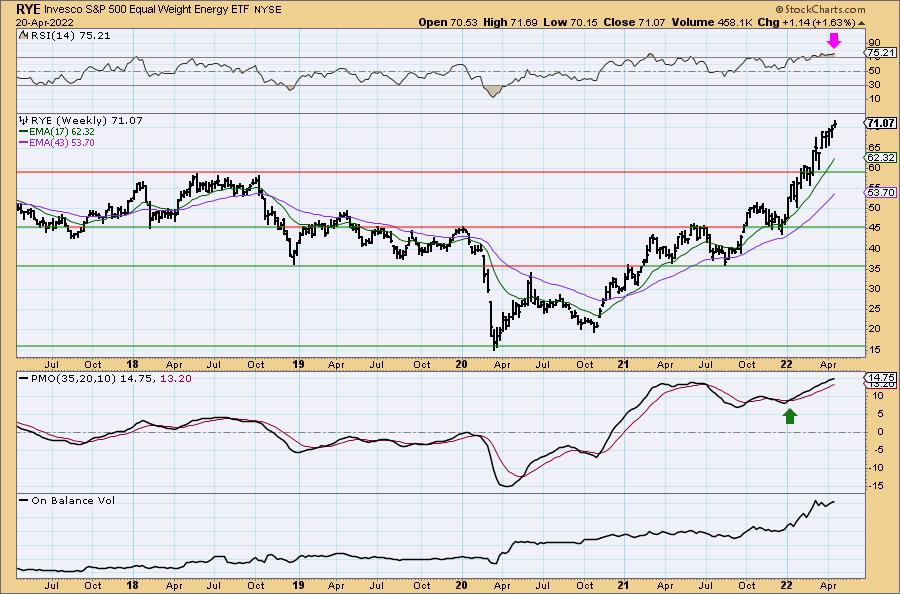
The weekly RSI is overbought, but this sector will likely remain overbought for some time to come based on the war in Ukraine. The weekly PMO is rising on a BUY signal but is admittedly overbought.
Vanguard Materials ETF (VAW)
EARNINGS: N/A
VAW tracks a very broad market-cap-weighted index of US materials companies.
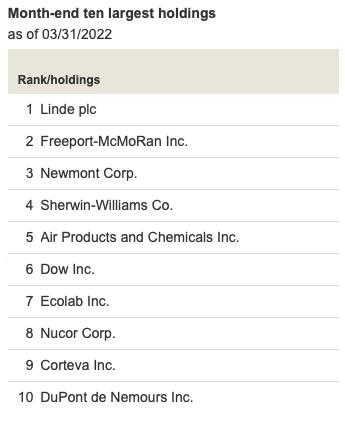
Predefined Scans Triggered: Moved Above Upper Bollinger Band, P&F Ascending Triple Top Breakout and P&F Double Top Breakout.
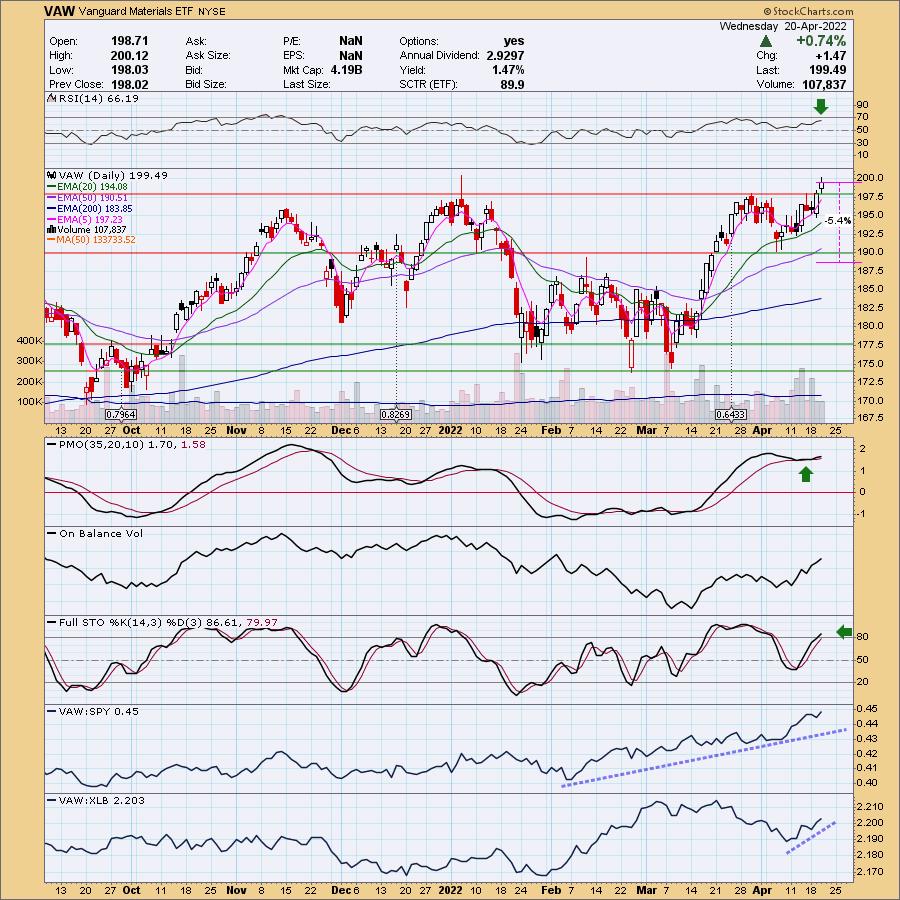
VAW is down -0.74% in after hours trading. With that after hours decline it is taking away today's gain, but I like the chart. Price broke out today. The RSI is positive and the PMO is rising after a new crossover BUY signal. Stochastics are above 80 and rising. VAW is doing great against the SPY and is currently outperforming XLB, the sector SPDR ETF. The stop can be set thinly below support and below the 50-day EMA.
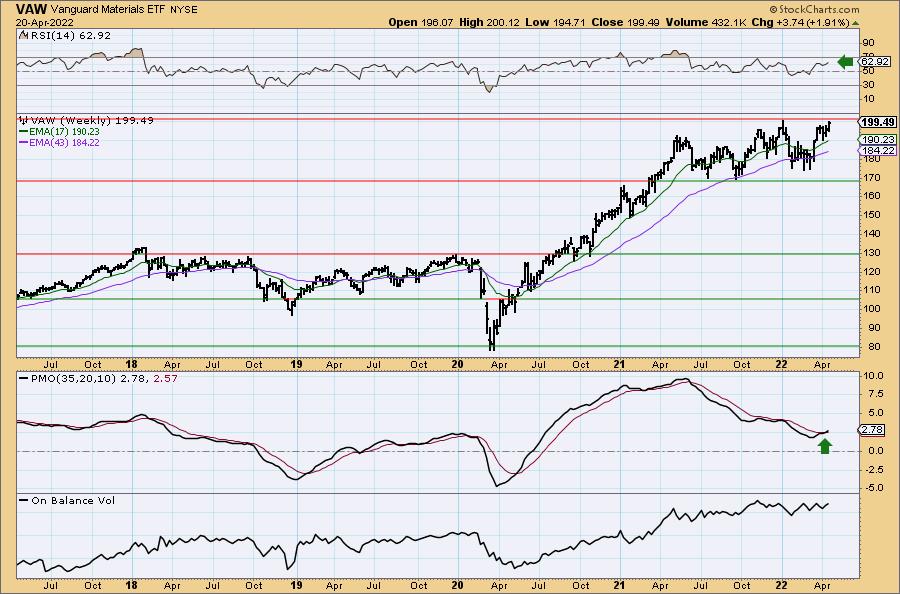
The weekly chart is very bullish. The weekly RSI is positive and the weekly PMO just triggered a crossover BUY signal. It is up against overhead resistance at all-time highs, but based purely on the weekly RSI and weekly PMO, I am fairly confident it will break out. Consider and upside target around 14% at $227.42.
Don't forget, on Thursdays I look at reader-requested symbols, click HERE to shoot me an email. I read every email I receive and try to answer them all!
Current Market Outlook:
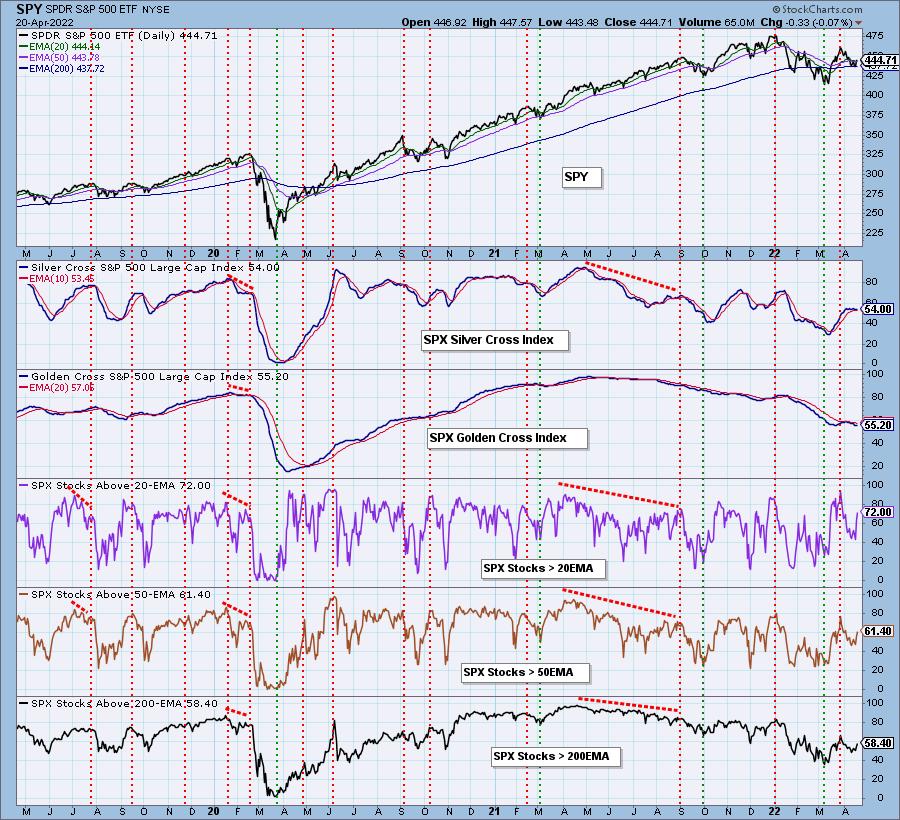
Market Environment: It is important to consider the odds for success by assessing the market tides. The following chart uses different methodologies for objectively showing the depth and trend of participation for intermediate- and long-term time frames.
- The Silver Cross Index (SCI) shows the percentage of SPX stocks on IT Trend Model BUY signals (20-EMA > 50-EMA)
- The Golden Cross Index (GCI) shows the percentage of SPX stocks on LT Trend Model BUY signals (50-EMA > 200-EMA)
Don't forget that as a "Diamonds" member, you have access to our GCI/SCI curated ChartList on DecisionPoint.com. You'll find it under "Members Only" links on the left side on the Blogs and Links Page.
Here is the current chart:
Full Disclosure: I'm 15% invested and 85% is in 'cash', meaning in money markets and readily available to trade with. I'm considering VAW, RYE and DAR as adds before Friday.
I'm required to disclose if I currently own a stock and/or may buy it within the next 72 hours.
Good Luck and Good Trading!
- Erin
"Technical Analysis is a windsock, not a crystal ball." - Carl Swenlin
(c) Copyright 2022 DecisionPoint.com
Watch the latest episode of DecisionPoint with Carl & Erin Swenlin on Mondays 7:00p EST or on the DecisionPoint playlist on the StockCharts TV YouTube channel here!
NOTE: The stocks reported herein are from mechanical trading model scans that are based upon moving average relationships, momentum and volume. DecisionPoint analysis is then applied to get five selections from the scans. The selections given should prompt readers to do a chart review using their own analysis process. This letter is not a call for a specific action to buy, sell or short any of the stocks provided. There are NO sure things or guaranteed returns on the daily selection of "Diamonds in the Rough."
Helpful DecisionPoint Links:
DecisionPoint Shared ChartList and DecisionPoint Chart Gallery
Price Momentum Oscillator (PMO)
Swenlin Trading Oscillators (STO-B and STO-V)
For more links, go to DecisionPoint.com