
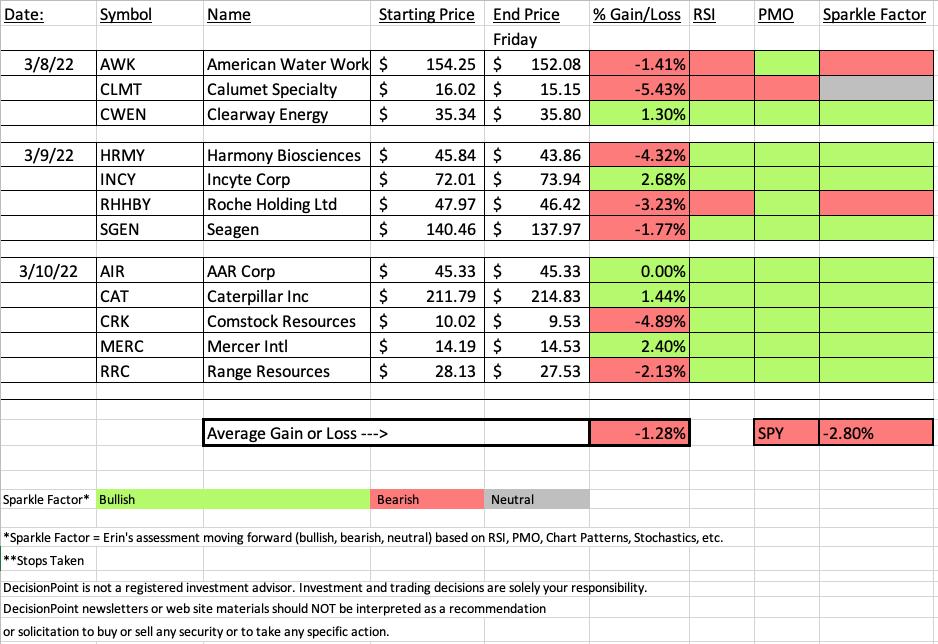
"Diamonds in the Rough" this week faired very well if you go by relative strength against the SPY. They averaged 1.5% higher than the SPY. However, as I always remind everyone, outperformance doesn't always translate into higher prices. This week's Diamonds were down overall, just not as far down as the SPY.
The problem was that on Wednesday we had a rally in growth stocks and defensive stocks got hit on a rough pullback in most cases. Had that anomalous day not happened, we would have a great showing. Of the twelve "Diamonds in the Rough" I only see two as not viable in the future and only one with a Neutral Sparkle Factor. That means that nine of this week's picks are still favorable moving forward.
This week's "Darling" is Incite Corp and this week's "Dud" is Calumet (CLMT). I own CLMT and while I have it listed as a Neutral going forward, if you got it on the pullback as I did, I think it is still a hold.
The "Sector to Watch" this week is the same as last week's, Utilities (XLU). Real Estate (XLRE) has fading participation. Energy (XLE) is due for some volatility or a pullback, but right now is currently the strongest sector out there. Healthcare was showing promise, but ultimately the indicators under the hood weren't favorable enough to make it the one to watch. Looks like the same theme ahead - defensive trades.
Have a great weekend!
Erin
*** Working VACATION March 23rd to April 1st ***
I will be taking a trip to the Netherlands and Belgium to see the tulips! As always, I will post pictures and give you a brief diary of my adventures for those interested. Here is how publishing will be affected.
Schedule:
DP Alert - The DPA will be published each market day as usual, but comments will be abbreviated. You will get the latest charts, but if there are no significant changes, comments will be carried over.
DP Diamonds - Week of March 21st: Five picks on 3/21 and five picks on 3/22 - No Diamond Mine or Recap // Week of March 28th: No Diamonds Reports (You will be compensated with an additional week added to the end of your subscription)

RECORDING LINK (3/11/2022):
Topic: DecisionPoint Diamond Mine (3/11/2022) LIVE Trading Room
Start Time: Mar 11, 2022 08:59 AM
Meeting Recording Link.
Access Passcode: March-11th
REGISTRATION FOR Friday 3/18 Diamond Mine:
When: Mar 18, 2022 09:00 AM Pacific Time (US and Canada)
Topic: DecisionPoint Diamond Mine (3/18/2022) LIVE Trading Room
Register in advance for this webinar HERE.
Save the registration confirmation email with login instructions in case Zoom doesn't notify you in time.

Free DP Trading Room (3/7) RECORDING LINK:
Topic: DecisionPoint Trading Room
Start Time: Mar 7, 2022 08:58 AM
Meeting Recording Link.
Access Passcode: March@7th
For best results, copy and paste the access code to avoid typos.
A few items about the spreadsheet: I've put on the spreadsheet whether the RSI is positive (green) or negative (red). The PMO column tells you if it is rising (green) or falling (red). Finally I've added my own "Sparkle Factor" that gives you my assessment going forward, bullish (green), bearish (red) or neutral (gray). The Sparkle Factor is basically my thoughts on whether I expect it to rise or fall. A neutral means it could really go either way so it could be added to a watch list. If you're in a stock I consider "neutral" going forward, the ball is in your court.
Darling:
Incyte Corp. (INCY)
EARNINGS: 5/3/2022 (BMO)
Incyte Corp. is a biopharmaceutical company, which engages in the discovery, development and commercialization of proprietary therapeutics. Its portfolio includes compounds in various stages, ranging from preclinical to late stage development, and commercialized products such as JAKAFI (ruxolitinib), and ICLUSIG (ponatinib). The company was founded by Roy A. Whitfield in April 1991 and is headquartered in Wilmington, DE.
Predefined Scans Triggered: P&F Double Top Breakout.
Below are the commentary and chart from 3/9:
"INCY is up +1.37% in after hours trading. This is a larger cap biotech that may see a bit less volatility. It is in a bear market so while we expect higher prices, we should temper our expectations. There is a confirmed double-bottom pattern that suggests and upside target at January highs. Price broke above resistance at $71 and is continuing higher. The next resistance level is the 200-day EMA. The RSI is rising and positive sitting above net neutral (50). The PMO is on a crossover BUY signal, rising and nearing positive territory above the zero line. Stochastics are oscillating above 80. Relative strength against the group and the SPY is excellent. The stop is set below the double-bottom pattern."
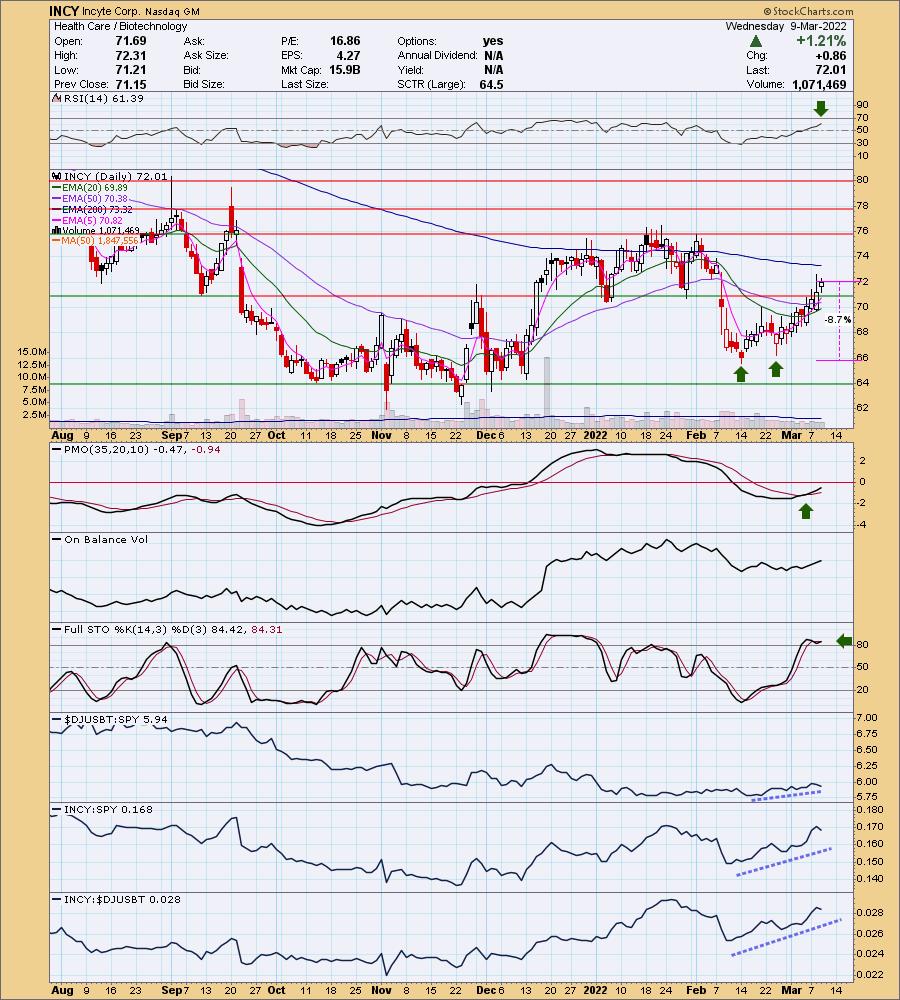
Here is today's chart:
The chart looks very good. There will be a "Silver Cross" of the 20/50-day EMAs very soon. The PMO is now in positive territory. The only detractor is today's long wick on a filled black candlestick. Those are typically downside reversal patterns that imply a decline the following trading day.

Don't forget, on Thursdays I look at reader-requested symbols, so shoot me an email at erin@decisionpoint.com. I read every email I receive and try to answer them all!
Dud:
Calumet Specialty Products Partners L.P. (CLMT)
EARNINGS: 5/6/2022 (BMO)
Calumet Specialty Products Partners LP engages in the production of specialty hydrocarbon products. It operates through the following segments: Specialty Products, Fuel Products and Corporate. The Specialty Products segment produces lubricating oils, solvents, waxes, synthetic lubricants and other products. The Fuel Products segment is involved in the processing of crude oil into fuel and fuel-related products, including unleaded gasoline, diesel, and jet fuel, asphalt and other products. The Corporate segment consists of general and administrative expenses not allocated to the specialty products or fuel products segments. The company was founded on September 27, 2005 and is headquartered in Indianapolis, IN.
Predefined Scans Triggered: None.
Below are the commentary and chart from Tuesday 3/8:
"CLMT is up +3.87% in after hours trading. Looks like tomorrow is going to be a good day for these stocks. If you read the description of what this company does, it is actually a play on Crude Oil to some degree. Unlike AWK, CLMT is in a bull market. There is a beautiful bullish ascending triangle on the chart, marked by a flat top and rising bottoms. The RSI is positive and the PMO is nearing a positive crossover. The OBV has been confirming this rising trend since the January low. The group as a whole isn't performing well, but we know there are plenty of companies in this space that are benefiting from the war, particularly chemicals needed for fertilizer and oil. This one is a strong performer against the group and most importantly, the SPY. The stop is set below the 50-day EMA."
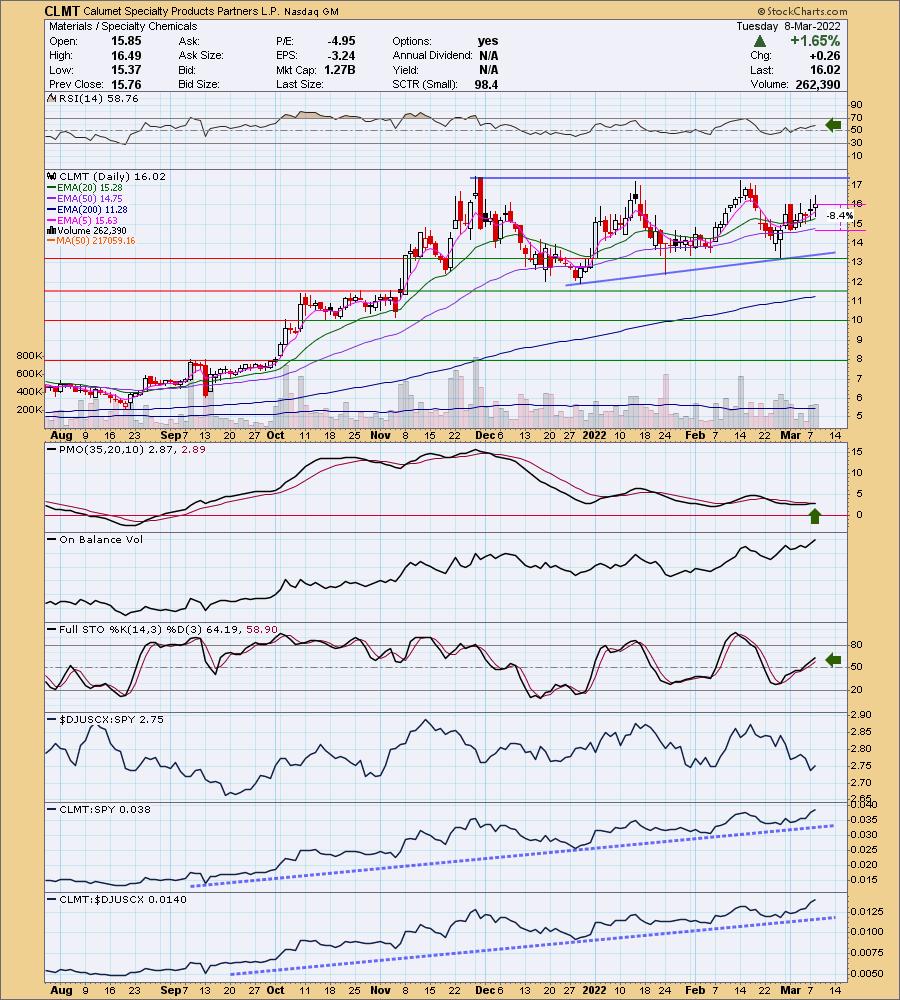
Below is today's chart:
The stop could have been triggered today, but price reversed and closed above it. I do own it and it looks good enough to hold. The RSI looks very good, but the PMO isn't confirming yet. Stochastics are in positive territory, but they are pausing. Outperformance of the group is still there and this one still has great relative strength against the SPY and the group.
TODAY'S Sector Performance:

DecisionPoint Sector Scoreboard (Mechanical Trend Model Signals):
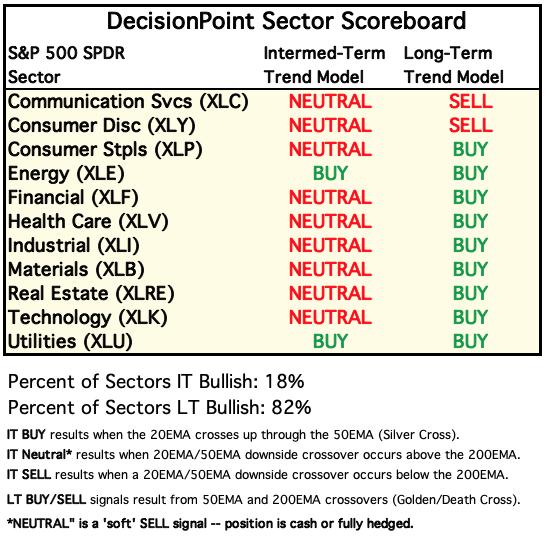
Click Here to view Carl's annotated Sector ChartList!
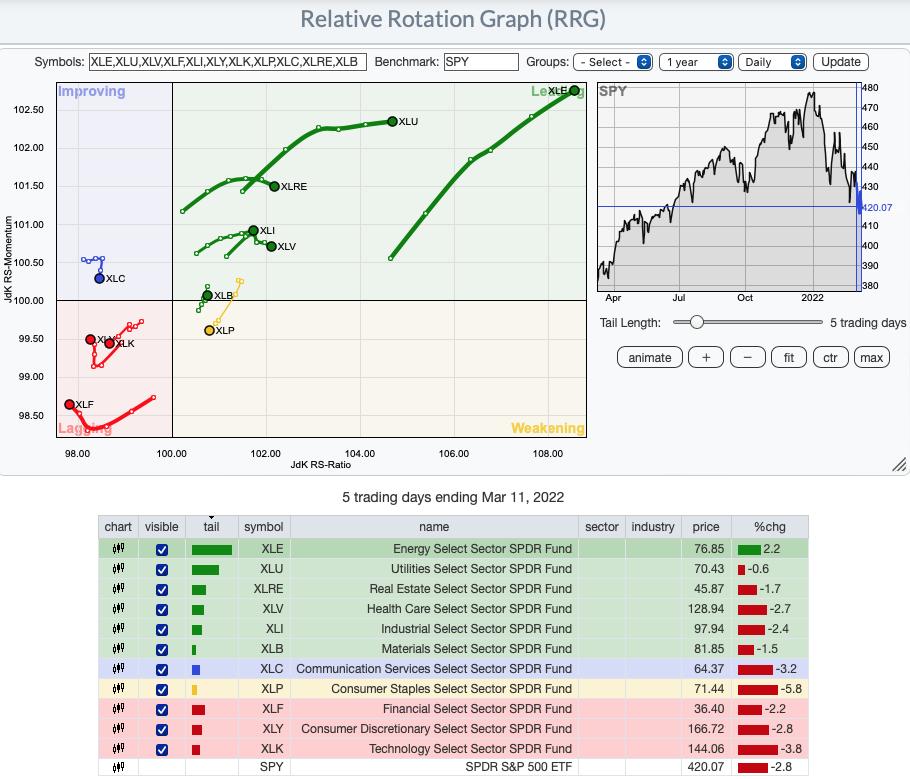
Short-term (Daily) RRG:
XLC and XLK are the most bearish as both have bearish southwest headings with XLC losing its status in Improving and XLK traveling further into Lagging. XLF and XLY are seeing some improvement in heading as they are moving northward not southward. The problem is they are still traveling westward.
XLP has reached Weakening. It's an interesting phenomena to see this defensive sector struggling while the others (XLV, XLRE and XLU) are in Leading. This is a hit and miss sector so be careful.
The remainder are bullish as they sit in Leading. We are seeing some deterioration in the heading of XLRE and XLV, but nothing to be concerned about right now. XLB is returning from its brief foray into Weakening.
Intermediate-Term (Weekly) RRG:
Three sectors look the most bearish: XLK, XLY and XLC. XLK and XLY are in Lagging with a southwest heading. XLC is in Improving, however, it has reversed and is actually heading back toward Lagging (hard to see unless you magnify it).
XLRE is losing ground in the intermediate term. It is headed to Lagging out of Weakening.
The remainder are very bullish. XLP is starting hook toward Weakening, but it is firmly in Leading for now. XLE, XLU, XLI, XLV and XLB are all in Leading with bullish northeast headings.
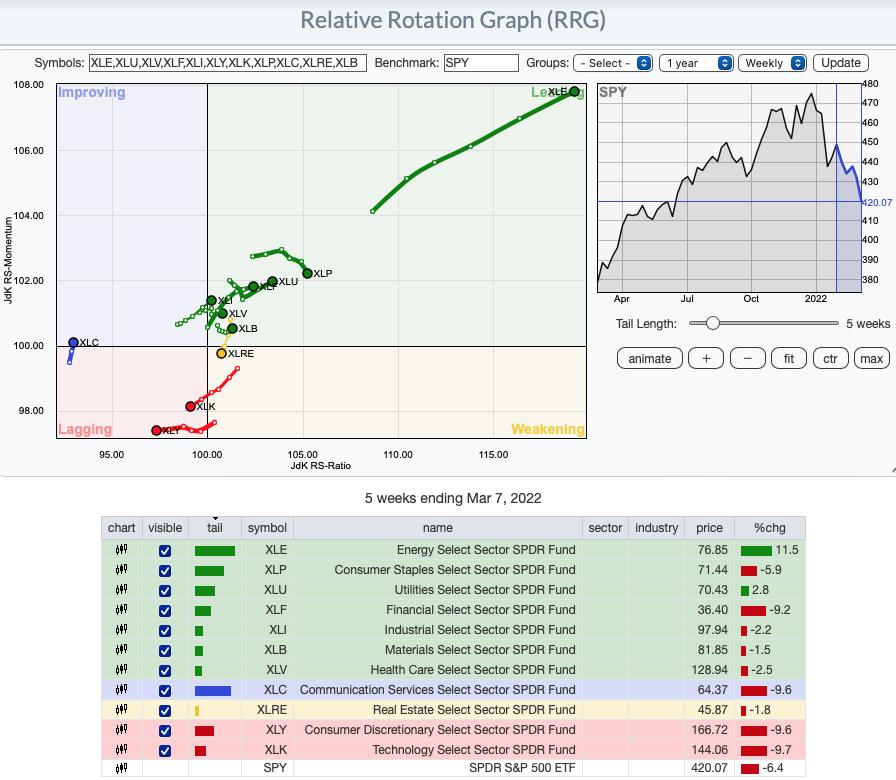
RRG® charts show you the relative strength and momentum for a group of stocks. Stocks with strong relative strength and momentum appear in the green Leading quadrant. As relative momentum fades, they typically move into the yellow Weakening quadrant. If relative strength then fades, they move into the red Lagging quadrant. Finally, when momentum starts to pick up again, they shift into the blue Improving quadrant.
CLICK HERE for an animated version of the RRG charts.
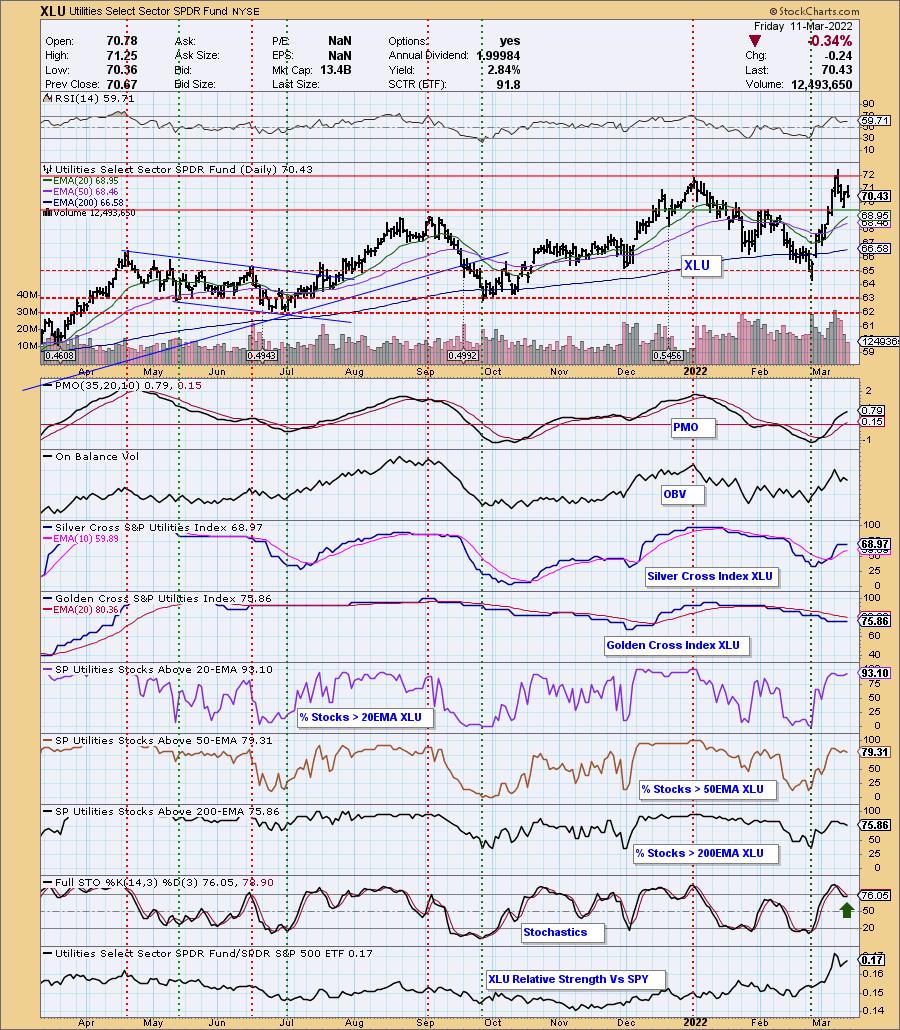
Sector to Watch: Utilities (XLU)
XLU did pullback slightly this week, but that makes it ripe for stock picking. It has formed a bullish flag formation. The RSI is positive and not overbought or falling. The PMO is rising despite the pullback. All participation readings are bullish with readings above 70%, with the exception of the "Silver Cross Index" which isn't far at 69%. Stochastics are turning up just below 80 and relative strength is off the charts.
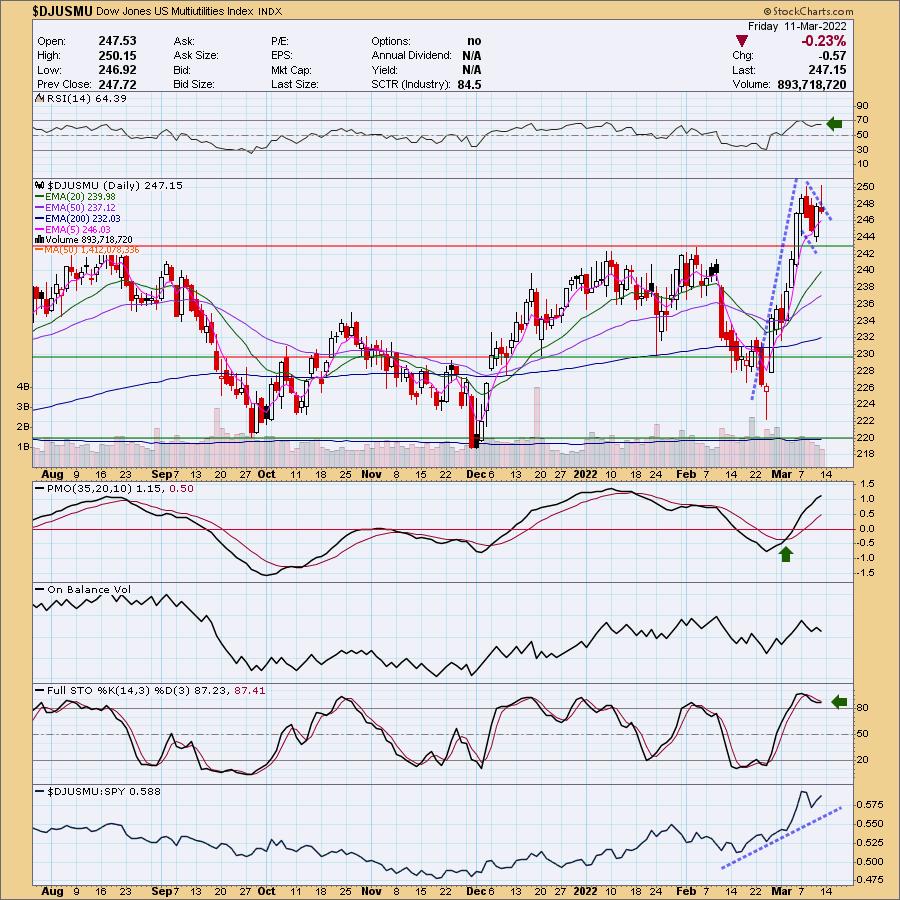
Industry Group to Watch: Multiutilities ($DJUSMU)
This was by far the most bullish looking group with Utilities. Gas Distribution also looks promising. There is a bullish flag formation. The PMO is on a BUY signal and rising. The RSI is positive and not overbought. Stochastics are hovering above 80 and relative strength for the group is outstanding. Pretty easy pick.
Go to our Sector ChartList on DecisionPoint.com to get an in-depth view of all the sectors.
Have a great weekend! The next Diamonds Report is TUESDAY 3/15.
- Erin
erin@decisionpoint.com
Full Disclosure: I'm 25% exposed to the market.
Watch the latest episode of DecisionPoint with Carl & Erin Swenlin on Mondays 7:00p EST or on the DecisionPoint playlist on the StockCharts TV YouTube channel here!
Technical Analysis is a windsock, not a crystal ball. --Carl Swenlin
NOTE: The stocks reported herein are from mechanical trading model scans that are based upon moving average relationships, momentum and volume. DecisionPoint analysis is then applied to get five selections from the scans. The selections given should prompt readers to do a chart review using their own analysis process. This letter is not a call for a specific action to buy, sell or short any of the stocks provided. There are NO sure things or guaranteed returns on the daily selection of "diamonds in the rough."
Helpful DecisionPoint Links:
DecisionPoint Shared ChartList and DecisionPoint Chart Gallery
Price Momentum Oscillator (PMO)
Swenlin Trading Oscillators (STO-B and STO-V)
(c) Copyright 2022 DecisionPoint.com