
I have five reader requests for you today. There are two Industrials, two Energy stocks and one Materials stock. These areas are still seeing strength and outperformance. I also listed quite a few Stocks to Review as the requests were pretty good!
Vertex (VRTX) was in the Stocks to Review yesterday as a manual find by me in Biotechs. Today it showed up in one of my scans, so you may want to visit that chart today if you didn't look at it yesterday.
Don't forget to sign up for tomorrow's Diamond Mine trading room! The links are in each and every Diamonds Report if you need it. Here is a direct link to join me tomorrow.
Today's "Diamonds in the Rough": AIR, CAT, CRK, MERC and RRC.
Stocks to Review: VRTX, VLO, FSK, TPL, UTZ, ADM, BTU, CEIX, CVI, MPLX, VET, NOC, DOW, IAG and X.

RECORDING LINK (3/4/2022):
Topic: DecisionPoint Diamond Mine (3/4/2022) LIVE Trading Room
Start Time: Mar 4, 2022 09:00 AM
MeetingRecording Link.
Access Passcode: March#4th
REGISTRATION FOR Friday 3/11 Diamond Mine:
When: Mar 11, 2022 09:00 AM Pacific Time (US and Canada)
Topic: DecisionPoint Diamond Mine (3/11/2022) LIVE Trading Room
Register in advance for this webinar HERE.
Save the registration confirmation email with login instructions in case Zoom doesn't notify you in time.

Free DecisionPoint Trading Room Recording:
Topic: DecisionPoint Trading Room
Start Time: Mar 7, 2022 09:00 AM PT
Meeting Recording Link.
Access Passcode: March@7th
For best results, copy and paste the access code to avoid typos.
Welcome to DecisionPoint Daily Diamonds, wherein I highlight ten "Diamonds in the Rough" per week. These are selected from the results of my DecisionPoint Scans, which search for stocks that could benefit from the trend and condition of the market. Remember, these are not recommendations to buy or sell, but are the most interesting of the stocks that surfaced in my scans. My objective is to save you the work of the initial, tedious culling process, but you need to apply your own analysis to see if these stocks pique your interest as well. There are no guaranteed winners here!
"Predefined Scans Triggered" are taken from StockCharts.com using the "Symbol Summary" option instead of a "SharpChart" on the workbench.
AAR Corp. (AIR)
EARNINGS: 3/22/2022 (AMC)
AAR Corp. engages in the provision of products and services to commercial aviation and government and defense industries. It operates through the following segments: Aviation Services and Expeditionary Services. The Aviation Services segment consists of aftermarket support and services businesses that provide spares and maintenance support for aircraft operated by commercial and government/defense customers. The Expeditionary Services segment is involved in delivery of airlift services and the design and manufacture of pallets, shelters, and containers used to support the military's requirements for a mobile and agile force. The company was founded by Ira A. Eichner in 1951 and is headquartered in Wood Dale, IL.
Predefined Scans Triggered: Hollow Red Candles.
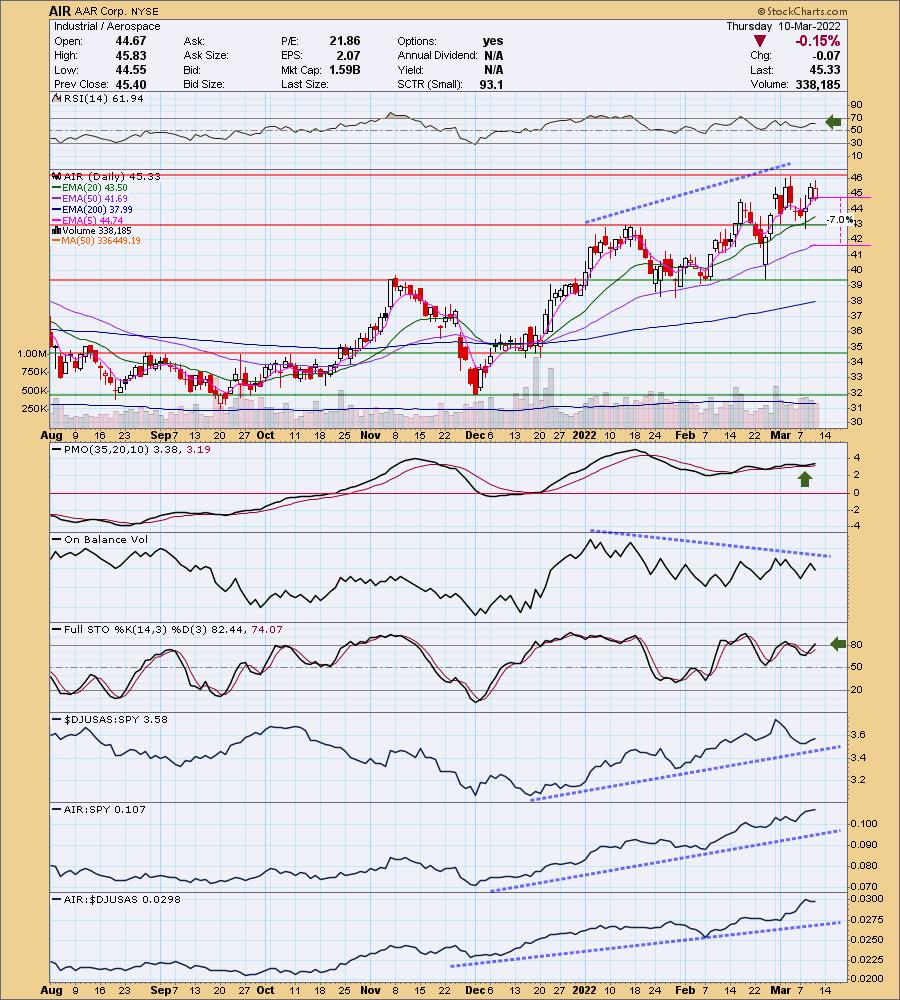
AIR is unchanged in after hours trading. Price is up against overhead resistance, but the indicators are very positive with the exception of a negative OBV divergence. The RSI is positive and not overbought telling us that price is therefore not overbought. The Price Momentum Oscillator (PMO) bottomed above its signal line which is especially bullish. Stochastics have just reached above 80 suggesting internal strength. Relative strength for the group and the stock is positive. The stop is set at the 50-day EMA.
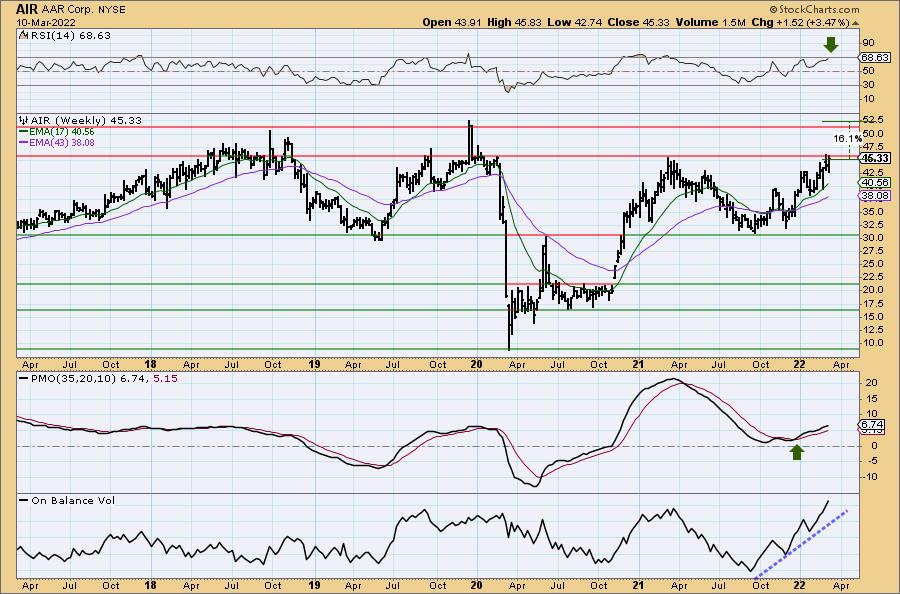
If price can break out above this strong area of resistance, upside potential is at least 16%.
Caterpillar, Inc. (CAT)
EARNINGS: 4/28/2022 (BMO)
Caterpillar, Inc. engages in the manufacture of construction and mining equipment, diesel and natural gas engines, industrial gas turbines, and diesel-electric locomotives. It operates through the following segments: Construction Industries, Resource Industries, Energy and Transportation, Financial Products, and All Other. The Construction Industries segment supports customers using machinery in infrastructure and building construction applications. The Resource Industries segment is responsible for supporting customers using machinery in mining and quarrying applications and it includes business strategy, product design, product management and development, manufacturing, marketing, and sales and product support. The Energy and Transportation segment supports customers in oil and gas, power generation, marine, rail, and industrial applications. The Financial Products segment offers a range of financing alternatives to customers and dealers for caterpillar machinery and engines, solar gas turbines, as well as other equipment and marine vessels. The All Other segment includes activities such as the business strategy, product management and development, and manufacturing of filters and fluids, undercarriage, tires and rims, engaging tools, and fluid transfers. The company was founded on April 15, 1925, and is headquartered in Deerfield, IL.
Predefined Scans Triggered: Moved Above Ichimoku Cloud and P&F Double Top Breakout.
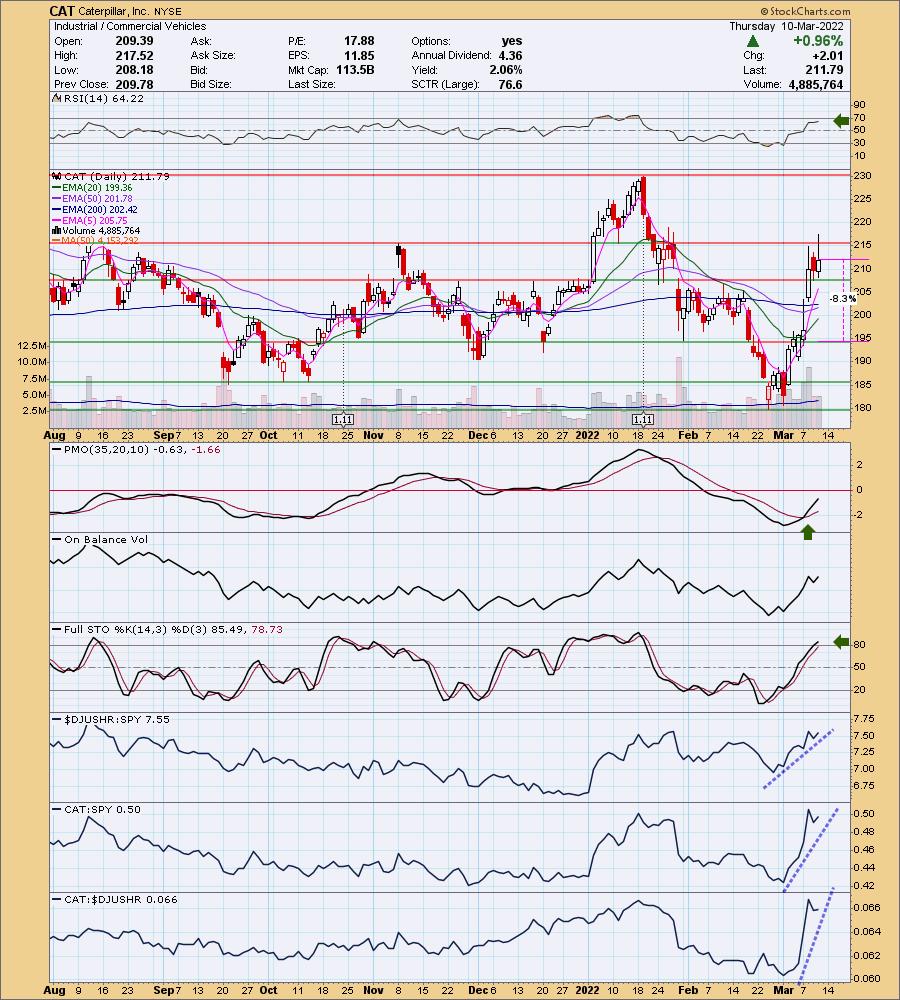
CAT is up +0.15% in after hours trading. I've covered CAT once before on August 25th 2021. The stop was triggered so the position is currently closed. Price briefly broke above resistance at the November top today, but closed below that resistance level. I think this is a pause, not a top. The RSI is positive and not overbought. The PMO is rising swiftly after a crossover BUY signal. Stochastics are now above 80. Relative strength is very bullish. The stop is set below the January low.
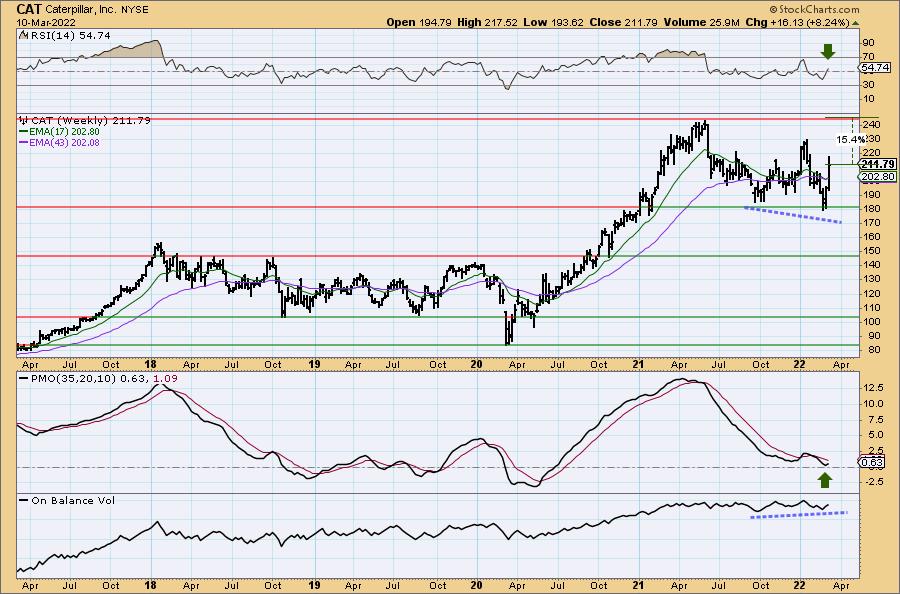
Upside potential may seem limited right now, but give the weekly PMO has bottomed and the weekly RSI just hit positive territory, I would expect to see a breakout to new all-time highs.
Comstock Resources, Inc. (CRK)
EARNINGS: 5/3/2022 (AMC)
Comstock Resources, Inc. engages in the acquisition, development, and exploration of oil and natural gas. The firm operations concentrated in the Haynesville shale, a premier natural gas basin located in East Texas. The company was founded in 1919 and is headquartered in Frisco, TX.
Predefined Scans Triggered: None.
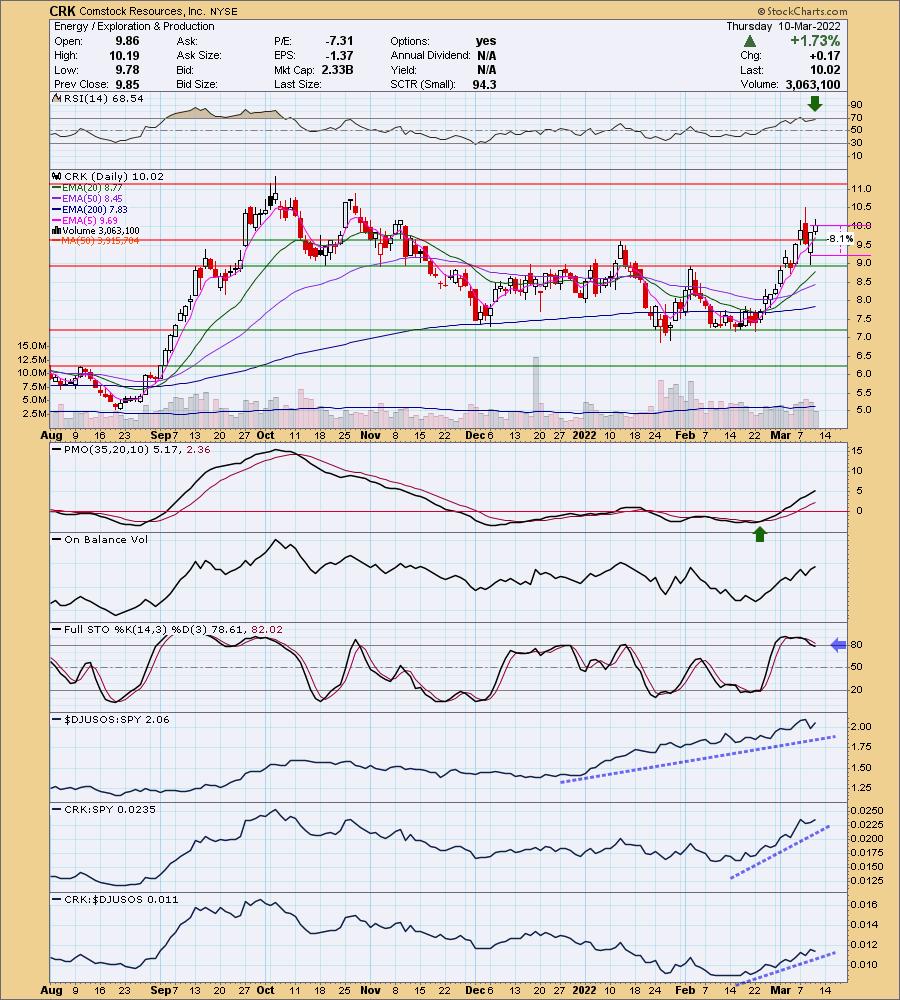
CRK is unchanged in after hours trading. Price recently broke above resistance and then pulled back to support. It has broken out once again. The RSI is positive and not yet overbought. The PMO is on a crossover BUY signal and is rising. The PMO is not overbought. Stochastics just dipped below 80, but still look good as they are flattening, not falling fast. Relative strength is strong within the group and against the SPY. This is an area of the market that should see higher prices as Crude Oil rises again. The stop is set below the January high.
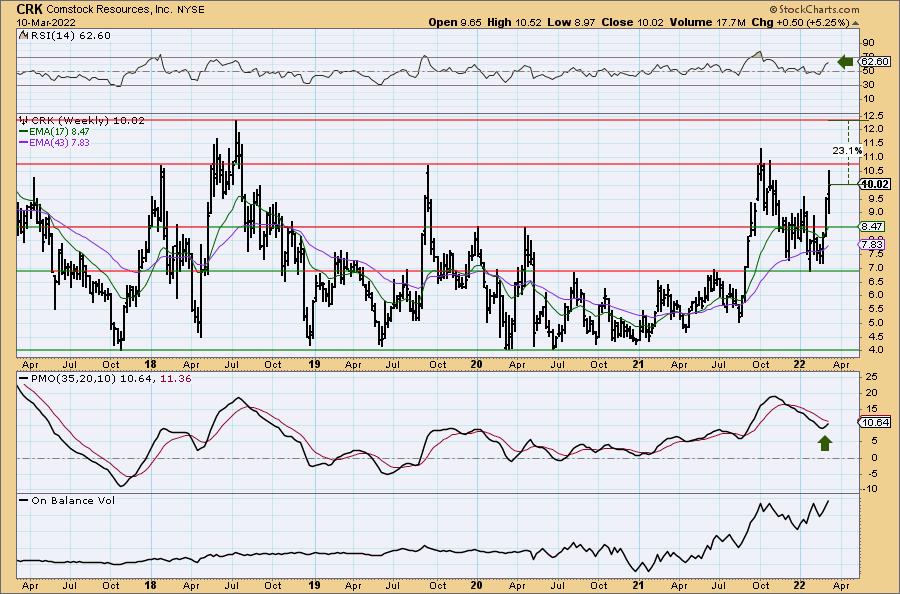
This stock typically travels in a trading range and it currently is at the top of it. However, the weekly RSI is positive and rising and the weekly PMO has bottomed. I would look for a test of the 2018 high for a 23%+ gain.
Mercer Intl, Inc. (MERC)
EARNINGS: 4/28/2022 (AMC)
Mercer International, Inc. engages in the manufacture and sale of pulp. It operates through Pulp and Wood Products segments. The Pulp segment consists of the manufacture, sales, and distribution of NBSK pulp, electricity, and other by-products at three pulp mills. The Wood Products segment is involved in the manufacture, sale, and distribution of lumber, electricity and other wood residuals at the Friesau Facility. The company was founded on July 1, 1968 and is headquartered in Vancouver, Canada.
Predefined Scans Triggered: Moved Above Upper Bollinger Band, New CCI Buy Signals, Stocks in a New Uptrend (Aroon), Moved Above Upper Price Channel, Parabolic SAR Buy Signals and P&F Double Top Breakout.
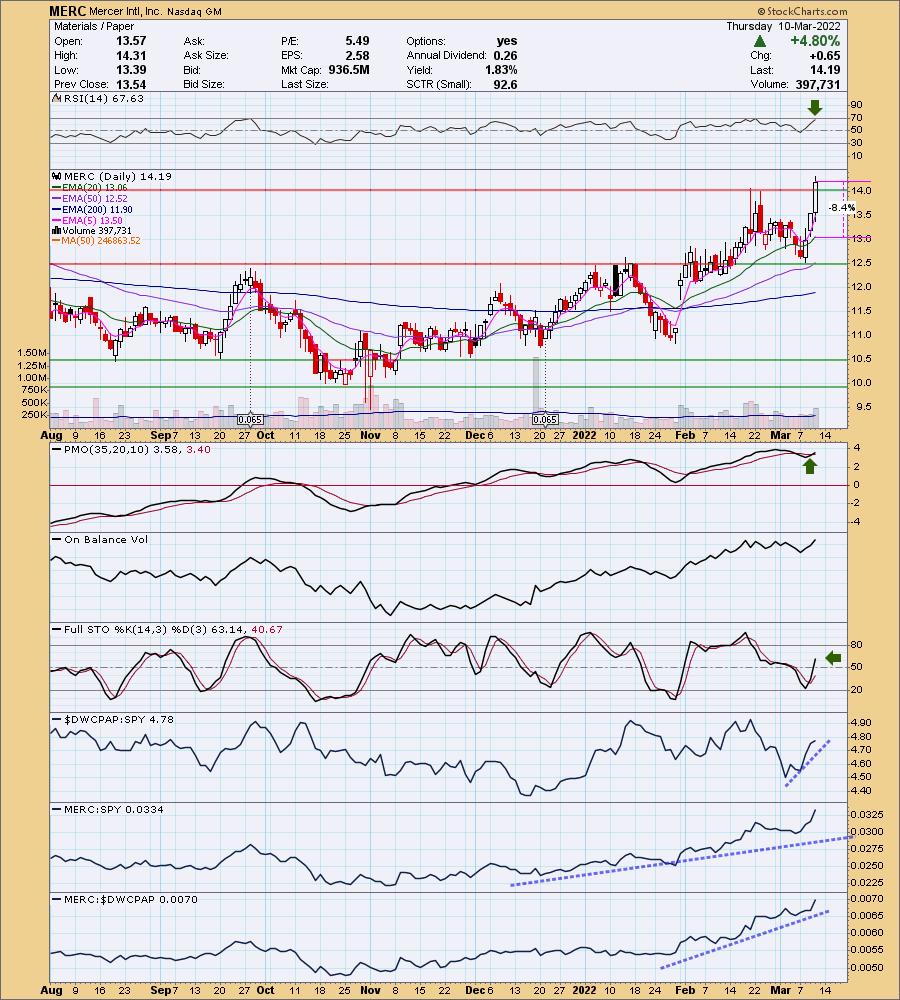
MERC is unchanged in after hours trading. I covered MERC before as a shorting opportunity in the August 18th 2021 Diamonds Report. The timing was off and the upside stop was hit. I like the breakout today. The indicators are confirming the breakout with a positive RSI and new PMO crossover BUY signal. Stochastics are rising in positive territory. Relative strength of the Paper group is improving and MERC is performing well against the group and the SPY. The stop is set at the 20-day EMA.
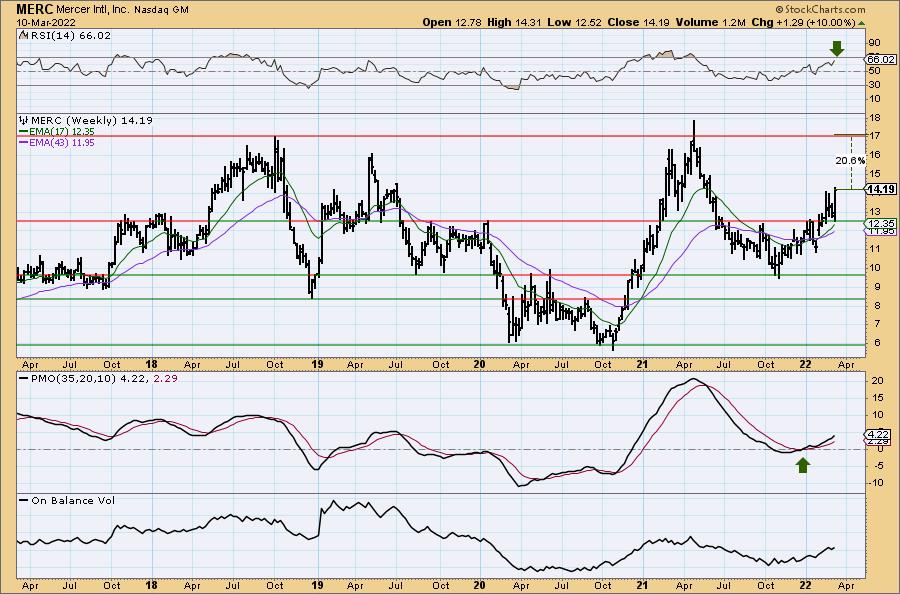
This is a beautiful bottoming formation on the weekly chart. The weekly RSI is positive and rising. The weekly PMO is on a crossover BUY signal and isn't overbought. I've set the upside target at the 2018 high.
Range Resources Corp. (RRC)
EARNINGS: 4/26/2022 (AMC)
Range Resources Corp. engages in the exploration, development and acquisition of natural gas and oil properties in the Appalachian and Midcontinent regions. The company was founded in 1976 and is headquartered in Fort Worth, TX.
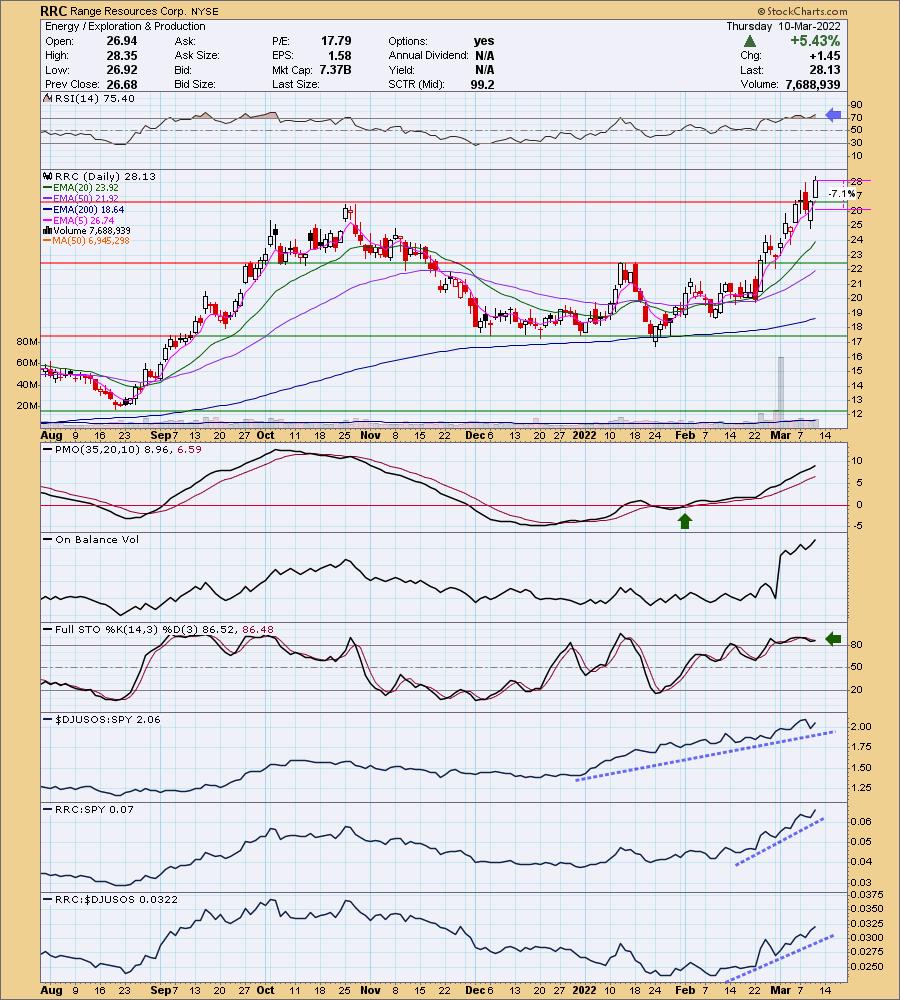
Predefined Scans Triggered: Elder Bar Turned Green, New 52-week Highs, Moved Above Upper Price Channel, P&F Ascending Triple Top Breakout and P&F Double Top Breakout.
RRC is unchanged in after hours trading. Price broke out to a new 52-week high today so this one has a lot going for it if you want to capture a stock that has an established rising trend. The RSI is overbought, but you can see from last September, it can remain overbought for some time. Given it is in the oil and gas area as well as energy production, I would look for this one to keep on winning. The PMO is rising and isn't overbought yet. Stochastics are oscillating above 80 suggesting internal strength. Relative strength is great for the group and the stock. The stop is set below the October top.
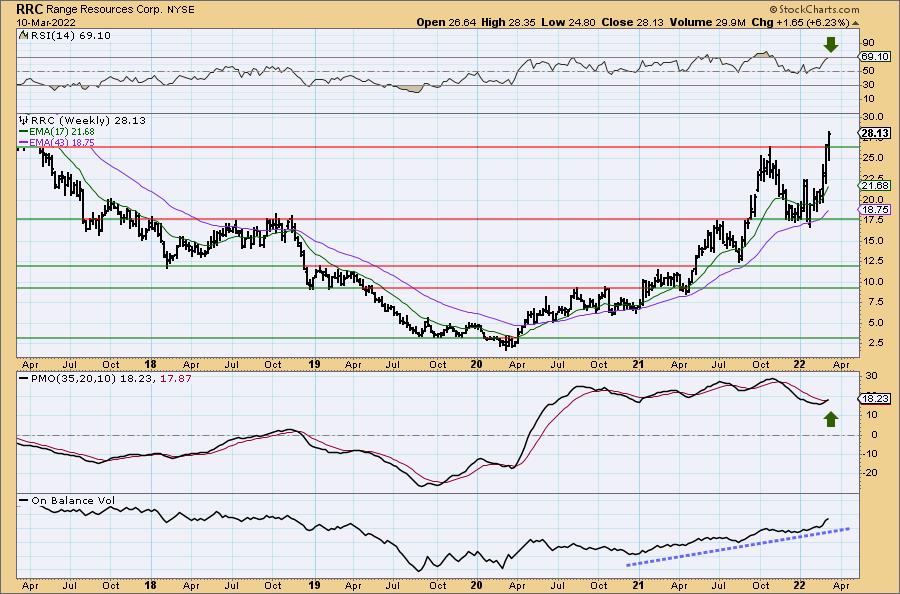
The weekly indicators look very good. The RSI is positive and I love the new PMO crossover BUY signal. The weekly OBV is also confirming the rally. Let's go look at the monthly chart for an upside target.
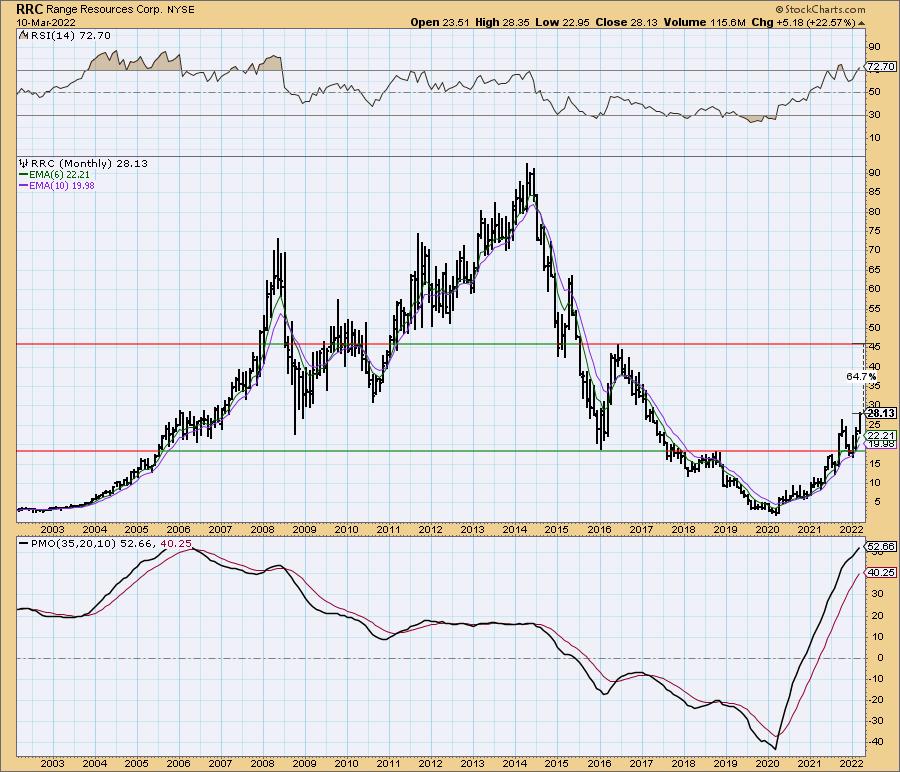
After this successful breakout, the next level of overhead resistance is at the 2016 top. If it can reach that level, that is a sizable upside target.
Don't forget, on Thursdays I look at reader-requested symbols, click HERE to shoot me an email. I read every email I receive and try to answer them all!
Current Market Outlook:
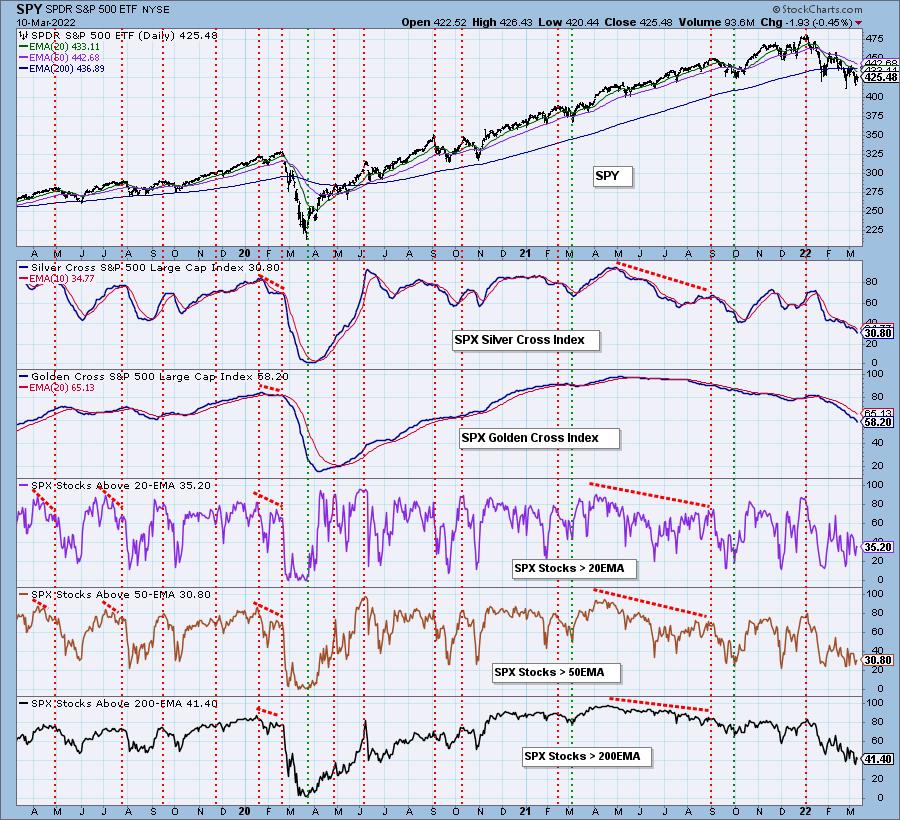
Market Environment: It is important to consider the odds for success by assessing the market tides. The following chart uses different methodologies for objectively showing the depth and trend of participation for intermediate- and long-term time frames.
- The Silver Cross Index (SCI) shows the percentage of SPX stocks on IT Trend Model BUY signals (20-EMA > 50-EMA)
- The Golden Cross Index (GCI) shows the percentage of SPX stocks on LT Trend Model BUY signals (50-EMA > 200-EMA)
Don't forget that as a "Diamonds" member, you have access to our GCI/SCI curated ChartList on DecisionPoint.com. You'll find it under "Members Only" links on the left side on the Blogs and Links Page.
Here is the current chart:
Full Disclosure: I'm 25% invested and 75% is in 'cash', meaning in money markets and readily available to trade with.
I'm required to disclose if I currently own a stock and/or may buy it within the next 72 hours.
Good Luck and Good Trading!
- Erin
"Technical Analysis is a windsock, not a crystal ball." - Carl Swenlin
(c) Copyright 2022 DecisionPoint.com
Watch the latest episode of DecisionPoint with Carl & Erin Swenlin on Mondays 7:00p EST or on the DecisionPoint playlist on the StockCharts TV YouTube channel here!
NOTE: The stocks reported herein are from mechanical trading model scans that are based upon moving average relationships, momentum and volume. DecisionPoint analysis is then applied to get five selections from the scans. The selections given should prompt readers to do a chart review using their own analysis process. This letter is not a call for a specific action to buy, sell or short any of the stocks provided. There are NO sure things or guaranteed returns on the daily selection of "Diamonds in the Rough."
Helpful DecisionPoint Links:
DecisionPoint Shared ChartList and DecisionPoint Chart Gallery
Price Momentum Oscillator (PMO)
Swenlin Trading Oscillators (STO-B and STO-V)
For more links, go to DecisionPoint.com