
I had quite a few results from my scans today. As I perused the charts I noticed quite a few breakouts. However, the charts weren't ripe. The breakouts were in Consumer Discretionary and Technology. Do not trust these breakouts in a bear market. We have to make sure all of the indicators and price action to confirm those breakouts.
I'm working on the road right now so unfortunately I wasn't able to put together a false breakout list. Just keep in mind what happened to the rally in Technology last time.
I was picky about my selections today as I didn't want to present any charts that weren't ripe or that had the appearance of a false breakout. These breakouts could take hold in a more sustained rally, but I simply don't trust the aggressive sectors right now.
Today's "Diamonds in the Rough": AFL, AL and FHI.
Stocks to Review: PGR, PCG and XEL.
*** Working VACATION March 23 to April 1 ***
I will be taking a trip to the Netherlands and Belgium to see the tulips! As always, I will post pictures and give you a brief diary of my adventures for those interested. Here is how publishing will be affected.
Schedule:
DP Alert - The DPA will be published each market day as usual, but comments will be abbreviated. You will get the latest charts, but if there are no significant changes, comments will be carried over.
DP Diamonds - Week of March 21st: Five picks on 3/21 and five picks on 3/22 - No Diamond Mine or Recap // Week of March 28th: No Diamonds Reports or Diamond Mine (You will be compensated with an additional week added to the end of your subscription)

RECORDING LINK (3/11/2022):
Topic: DecisionPoint Diamond Mine (3/11/2022) LIVE Trading Room
Start Time: Mar 11, 2022 09:00 AM
Meeting Recording Link.
Access Passcode: March-11th
There will be no Diamond Mine trading room for the next two weeks due to my vacation.
REGISTRATION FOR Friday 4/1 Diamond Mine:
When: Apr 1, 2022 09:00 AM Pacific Time (US and Canada)
Topic: DecisionPoint Diamond Mine (4/1/2022) LIVE Trading Room
Register in advance for this webinar HERE.
Save the registration confirmation email with login instructions in case Zoom doesn't notify you in time.

Free DecisionPoint Trading Room Recording:
Topic: DecisionPoint Trading Room
Start Time: Mar 14, 2022 09:00 AM
Meeting Recording Link.
Access Passcode: March@14
For best results, copy and paste the access code to avoid typos.
Welcome to DecisionPoint Daily Diamonds, wherein I highlight ten "Diamonds in the Rough" per week. These are selected from the results of my DecisionPoint Scans, which search for stocks that could benefit from the trend and condition of the market. Remember, these are not recommendations to buy or sell, but are the most interesting of the stocks that surfaced in my scans. My objective is to save you the work of the initial, tedious culling process, but you need to apply your own analysis to see if these stocks pique your interest as well. There are no guaranteed winners here!
"Predefined Scans Triggered" are taken from StockCharts.com using the "Symbol Summary" option instead of a "SharpChart" on the workbench.
Aflac, Inc. (AFL)
EARNINGS: 4/27/2022 (AMC)
Aflac, Inc. is a holding company. engages in the provision of financial protection services. It operates through the followings segments: Aflac Japan and Aflac United States (U.S.). The Aflac Japan segment offers life insurance, death benefits, and cash surrender values. The Aflac U.S. segment sells voluntary supplemental insurance products for people who already have major medical or primary insurance coverage. The company was founded by John Amos, Daniel Paul Amos, and William Amos on November 17, 1955 and is headquartered in Columbus, GA.
Predefined Scans Triggered: Bullish MACD Crossovers.
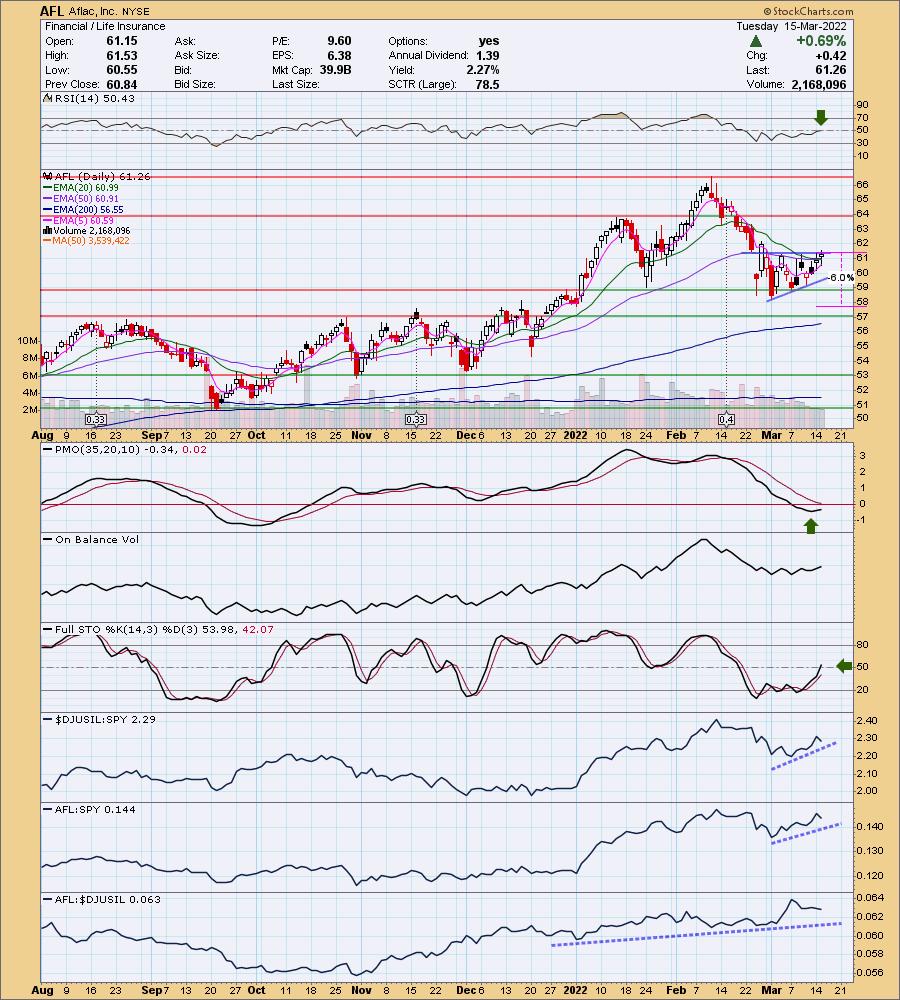
AFL is down -0.59% in after hours trading. It appears we are getting a breakout from a bullish ascending triangle. AFL is not in a bear market (50-EMA > 200-EMA) so we are 'allowed' to have bullish expectations. I like that price closed above the 50-day EMA and so far a "Dark Cross" of the 20/50-day EMAs has been avoided. The RSI and Stochastics just turned positive. The PMO has turned up just below the zero line. The group has been outperforming and AFL is a great performer against the group and the SPY. The stop can be set tightly at 6%.
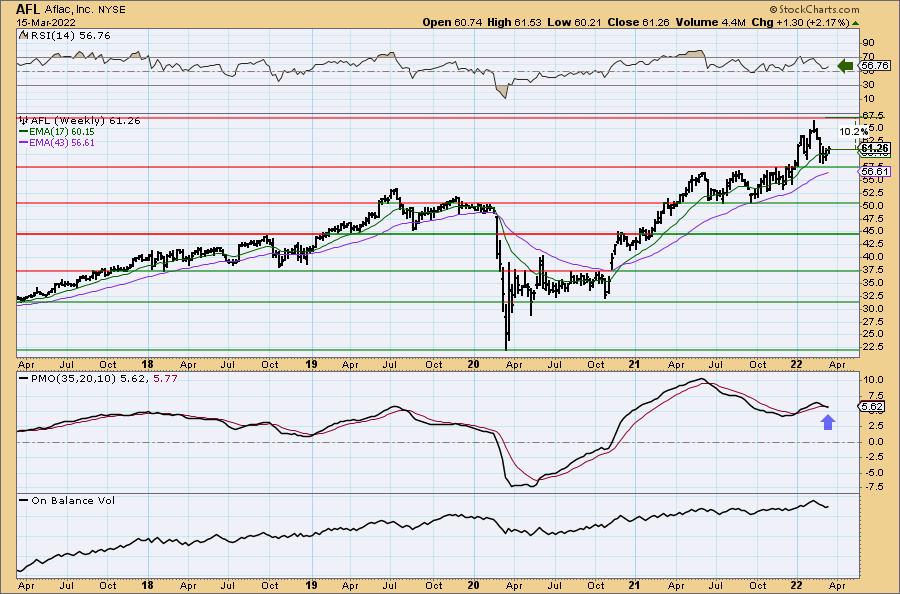
I like the RSI being positive, but not liking the weekly PMO negative crossover. As with all investments, this one should be considered more short-term rather than long-term. If it can challenge all-time highs that would be a 10% gain, but I would look for a breakout as long as the daily chart stays positive.
Air Lease Corp. (AL)
EARNINGS: 5/5/2022 (AMC)
Air Lease Corp. engages in the provision of aircraft leasing business. It focuses on purchasing new commercial jet transport aircraft directly from aircraft manufacturers, and leasing those aircraft to airlines throughout the world with the intention to generate attractive returns on equity. The company was founded by Steven F. Udvar-Hazy in January 2010 and is headquartered in Los Angeles, CA.
Predefined Scans Triggered: None.
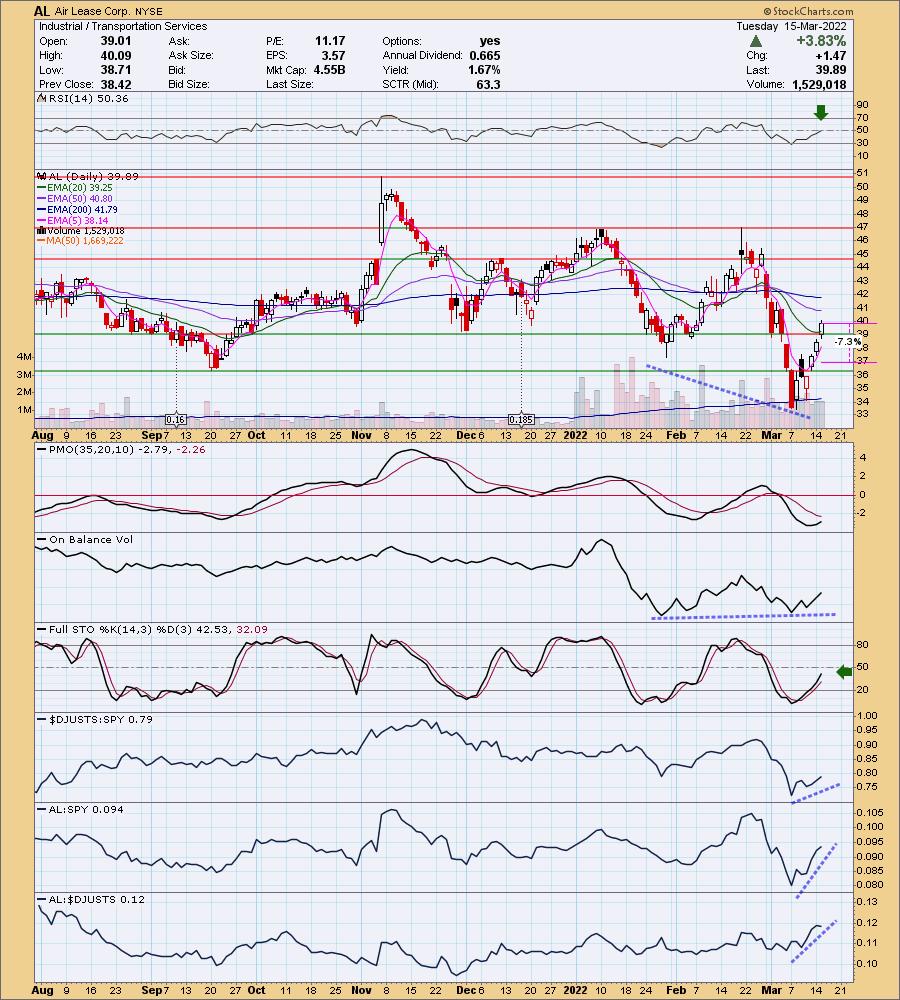
AL is up +0.85% in after hours trading. I like the breakout above the 20-day EMA and the resistance level at $39. This one has a bit of a bearish bias given the 50-day EMA is below the 200-day EMA, but indicators are improving on this somewhat "V" shaped rally. The RSI just hit positive territory and the PMO has turned up in oversold territory. Stochastics are rising, but it's early as they haven't reached above 50 just yet. I primarily liked this one due to the positive OBV divergence (rising bottoms on OBV and declining price bottoms). We don't see these that often so I always pay attention when I do see them. Relative performance is very strong. I've set the stop below the January low. It is about a 10% stop level if you set it below the September low and that's too deep, particularly in a market like we have right now.
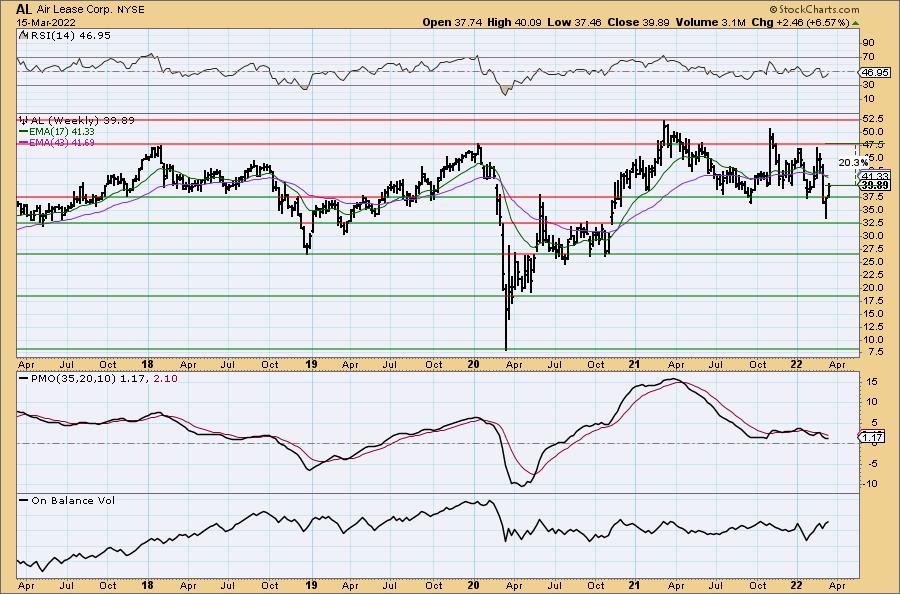
You can see the price bounce that has brought it back in the trading range of 2021. Even if it just stays in the trading range, there is an almost 20% gain possible.
Federated Hermes, Inc. (FHI)
EARNINGS: 4/28/2022 (AMC)
Federated Hermes, Inc. is engaged in the provision of investment management products and related financial services. It sponsors, markets and provides investment-related services to sponsored investment companies, federated funds, and separate accounts which include separately managed accounts, institutional accounts, sub-advised funds and other managed products in both domestic and international markets. The company was founded by John F. Donahue and Richard B. Fisher in October 1955 and is headquartered in Pittsburgh, PA.
Predefined Scans Triggered: None.
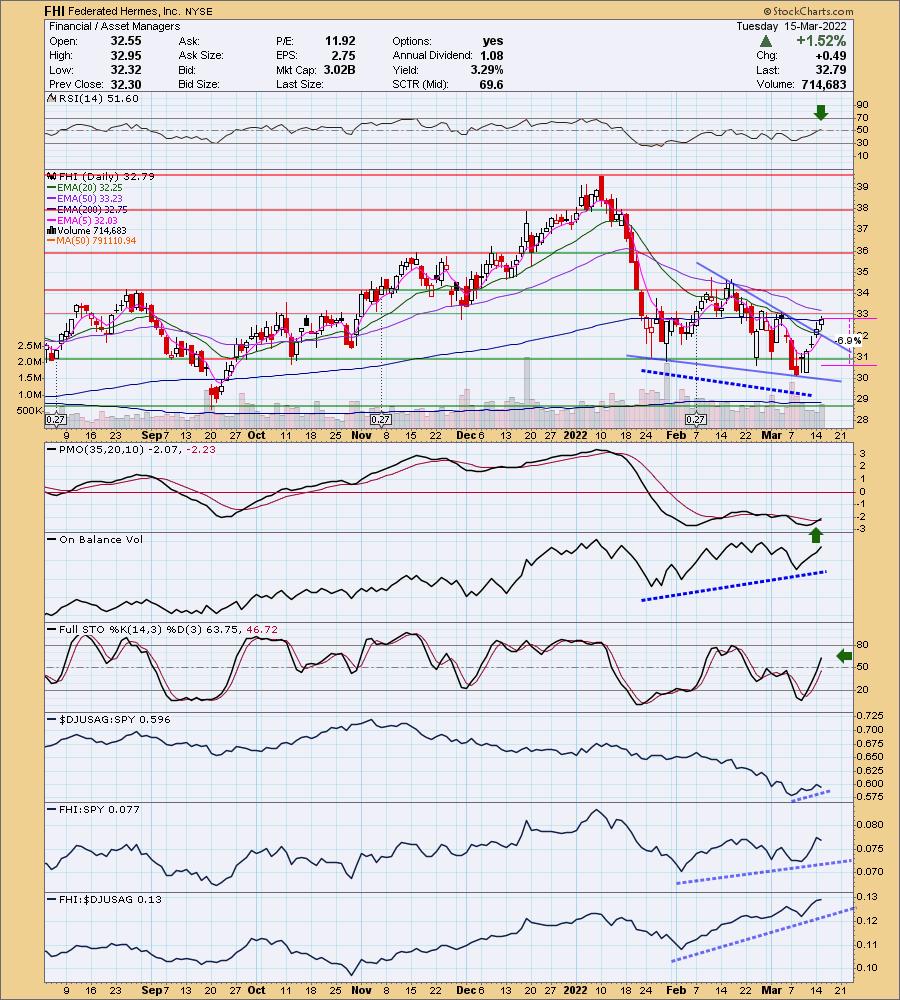
FHI is unchanged in after hours trading. We have a confirmed breakout from the bullish falling wedge. Price hasn't overcome resistance at the 50-day EMA yet nor the $33 level, but I like the way the indicators are lining up. The RSI just moved into positive territory above 50 and the PMO has triggered a crossover BUY signal. There is a strong positive OBV divergence. These generally lead to sustained rallies. Stochastics are now in positive territory and are rising quickly. Relative performance is excellent for the group and the stock. The stop level is set at 7%, below the $31 level of support.
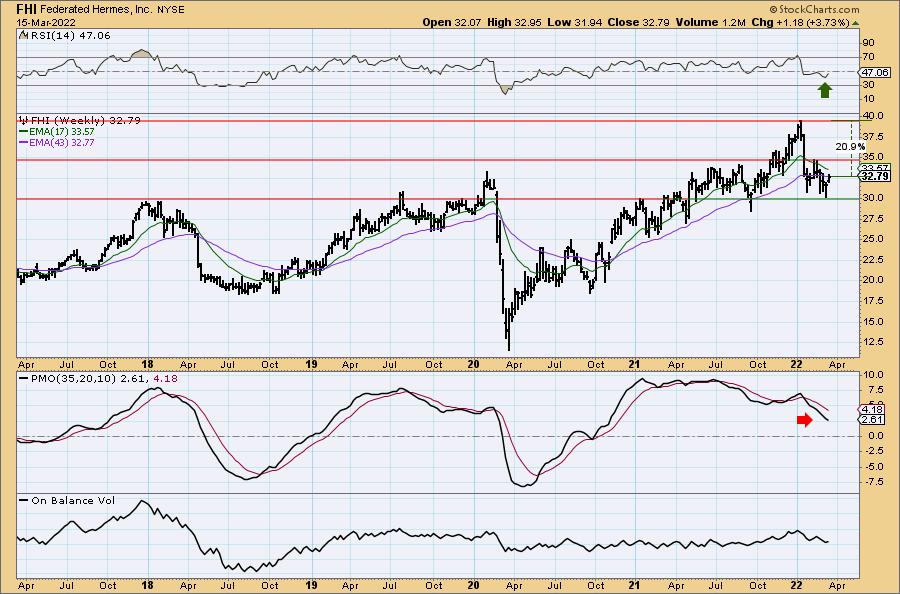
I am seeing a possible bullish double-bottom for 2022 developing. Price will need to hold this level of support. Weekly indicators are not as bullish as on the daily chart. The RSI is negative, but at least rising. The weekly PMO is in decline and I don't even see any deceleration. Consider this a shorter-term investment. If it can recapture all-time highs, that would be an almost 21% gain.
Don't forget, on Thursdays I look at reader-requested symbols, click HERE to shoot me an email. I read every email I receive and try to answer them all!
Current Market Outlook:
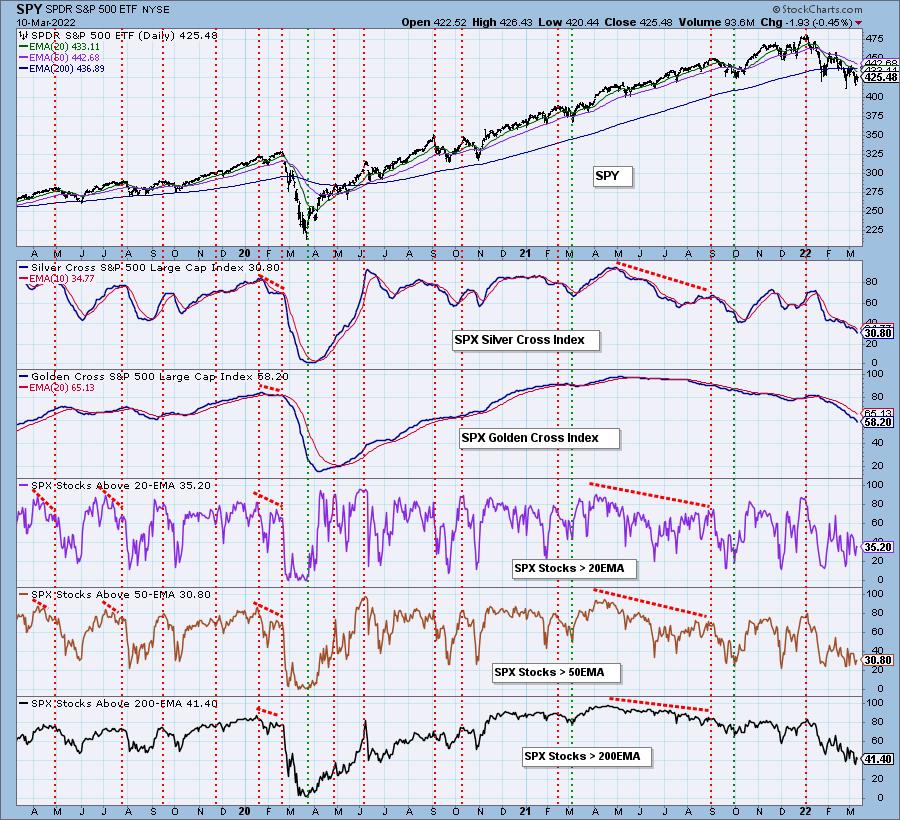
Market Environment: It is important to consider the odds for success by assessing the market tides. The following chart uses different methodologies for objectively showing the depth and trend of participation for intermediate- and long-term time frames.
- The Silver Cross Index (SCI) shows the percentage of SPX stocks on IT Trend Model BUY signals (20-EMA > 50-EMA)
- The Golden Cross Index (GCI) shows the percentage of SPX stocks on LT Trend Model BUY signals (50-EMA > 200-EMA)
Don't forget that as a "Diamonds" member, you have access to our GCI/SCI curated ChartList on DecisionPoint.com. You'll find it under "Members Only" links on the left side on the Blogs and Links Page.
Here is the current chart:
Full Disclosure: I'm 25% invested and 75% is in 'cash', meaning in money markets and readily available to trade with.
I'm required to disclose if I currently own a stock and/or may buy it within the next 72 hours.
Good Luck and Good Trading!
- Erin
"Technical Analysis is a windsock, not a crystal ball." - Carl Swenlin
(c) Copyright 2022 DecisionPoint.com
Watch the latest episode of DecisionPoint with Carl & Erin Swenlin on Mondays 7:00p EST or on the DecisionPoint playlist on the StockCharts TV YouTube channel here!
NOTE: The stocks reported herein are from mechanical trading model scans that are based upon moving average relationships, momentum and volume. DecisionPoint analysis is then applied to get five selections from the scans. The selections given should prompt readers to do a chart review using their own analysis process. This letter is not a call for a specific action to buy, sell or short any of the stocks provided. There are NO sure things or guaranteed returns on the daily selection of "Diamonds in the Rough."
Helpful DecisionPoint Links:
DecisionPoint Shared ChartList and DecisionPoint Chart Gallery
Price Momentum Oscillator (PMO)
Swenlin Trading Oscillators (STO-B and STO-V)
For more links, go to DecisionPoint.com