
It's Reader Request Day and every single pick today comes from readers. I've also listed the requests that I'm not covering but liked. One thing I noticed about today's requests was that every weekly chart is favorable. Many times Diamonds come up with short-term strength but weak or reversing weekly charts. Now I am not suggesting you purchase and hold for the longer term, you can. But (always a 'but') be sure and manage those positions as if they were short term.
Today's scan themes were clear. Banks continue to dominate the scans. A few of the "Stocks to Review" from readers are Banks so give them a look. The other interesting theme was Industrials, in particular, Commercial Vehicles and Transportation Services. It will be interesting to see how that sector performs in the Diamond Mine trading room tomorrow. Be sure and register! Remember that all trading rooms are recorded and the links are in every DP Diamonds report.
Today's "Diamonds in the Rough": BRO, CTVA, ILF, JETS and KZR.
Stocks to Review (Reader Requests): CCJ, CMA, ECPG, MRO, TGI, ZION, PBCT, EOG, HLGN, EWZ, COF, PAX, IGE, SI.

RECORDING LINK (2/3/2022):
Topic: DecisionPoint Diamond Mine (THURSDAY 2/3) LIVE Trading Room
Start Time: Feb 3, 2022 09:00 AM
Meeting Recording Link.
Access Passcode: February@3rd
REGISTRATION FOR Friday 2/11 Diamond Mine:
When: Feb 11, 2022 09:00 AM Pacific Time (US and Canada)
Topic: DecisionPoint Diamond Mine (2/11/2022) LIVE Trading Room
Register in advance for this webinar HERE.
Save the registration confirmation email with login instructions in case Zoom doesn't notify you in time.

Topic: DecisionPoint Trading Room
Start Time: Feb 7, 2022 09:01 AM
Meeting Recording Link.
Access Passcode: February#7
For best results, copy and paste the access code to avoid typos.
Welcome to DecisionPoint Daily Diamonds, wherein I highlight ten "Diamonds in the Rough" per week. These are selected from the results of my DecisionPoint Scans, which search for stocks that could benefit from the trend and condition of the market. Remember, these are not recommendations to buy or sell, but are the most interesting of the stocks that surfaced in my scans. My objective is to save you the work of the initial, tedious culling process, but you need to apply your own analysis to see if these stocks pique your interest as well. There are no guaranteed winners here!
"Predefined Scans Triggered" are taken from the StockCharts.com using the "Symbol Summary" option instead of a "SharpChart" on the workbench.
Brown & Brown Inc. (BRO)
EARNINGS: 4/25/2022 (AMC)
Brown & Brown, Inc. is an insurance agency, wholesale brokerage, insurance program and service organization. It engages in the provision of insurance brokerage services and casualty insurance underwriting services. It operates through the following segments: Retail, National Programs, Wholesale Brokerage, and Services. The Retail Segment receives fees in lieu of commissions. The National Programs segment acts as a managing general agent and provides professional liability and related package products for certain professionals, a range of insurance products for individuals, flood coverage, and targeted products and services designated for specific industries, trade groups, governmental entities and market niches. The Wholesale Brokerage segment markets and sells excess and surplus commercial and personal lines insurance, primarily through independent agents and brokers, as well as the company's retail agents. The Services segment provides insurance-related services, including third-party claims administration and comprehensive medical utilization management services in both the workers' compensation and all-lines liability arenas, as well as Medicare Set-aside services, social security disability and Medicare benefits advocacy services and claims adjusting services. The company was founded by J. Adrian Brown and Charles Covington Owen in 1939 and is headquartered in Daytona Beach, FL.
Predefined Scans Triggered: Elder Bar Turned Blue, Hollow Red Candles and P&F Double Top Breakout.
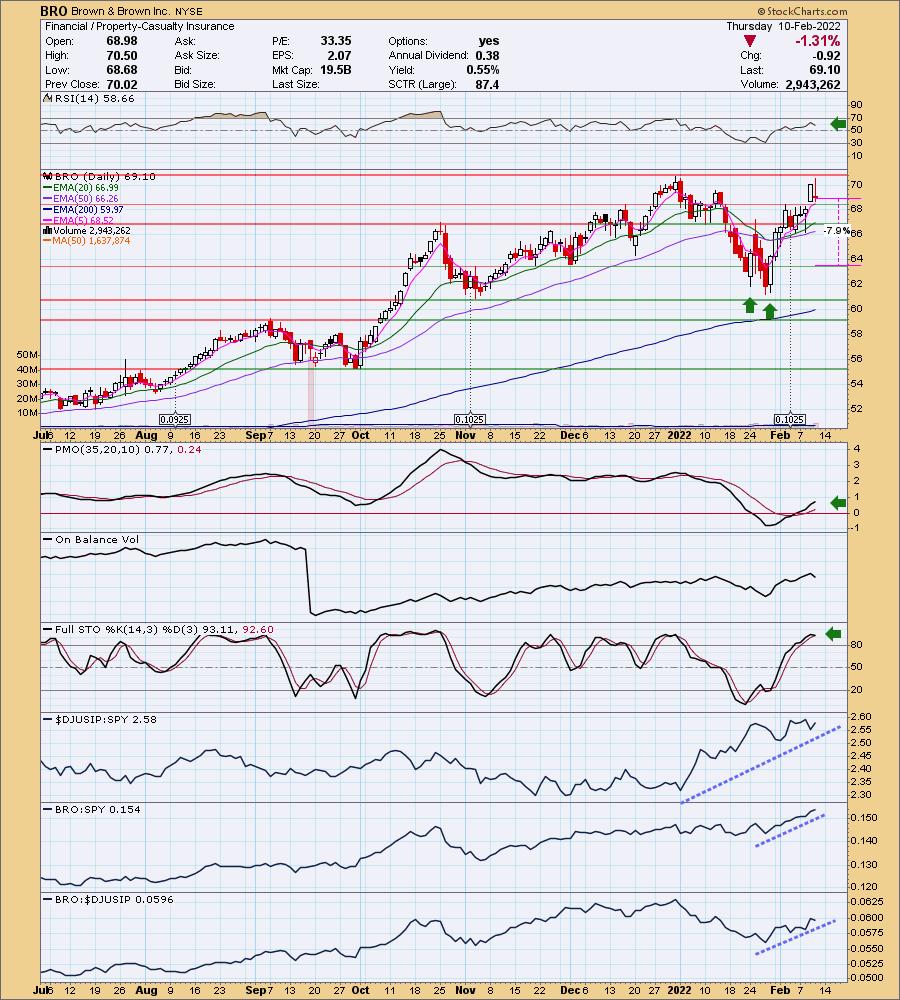
BRO is down -0.14% in after hours trading. I covered BRO December 16th 2020. The stop almost hit, but survived, so the position is still open and up +50.32%. I don't like today's pullback, but it does offer an excellent entry on a stock that is making new highs. The indicators are still positive. The RSI is falling but is centered in positive territory above net neutral (50). The PMO has been on an oversold BUY signal for days. Stochastics are softening, but they remain above 80 implying internal strength. Relative performance is great. The stop could be set tightly at about 4.5% or at the 50-day EMA. I opted to set it at the late November lows.
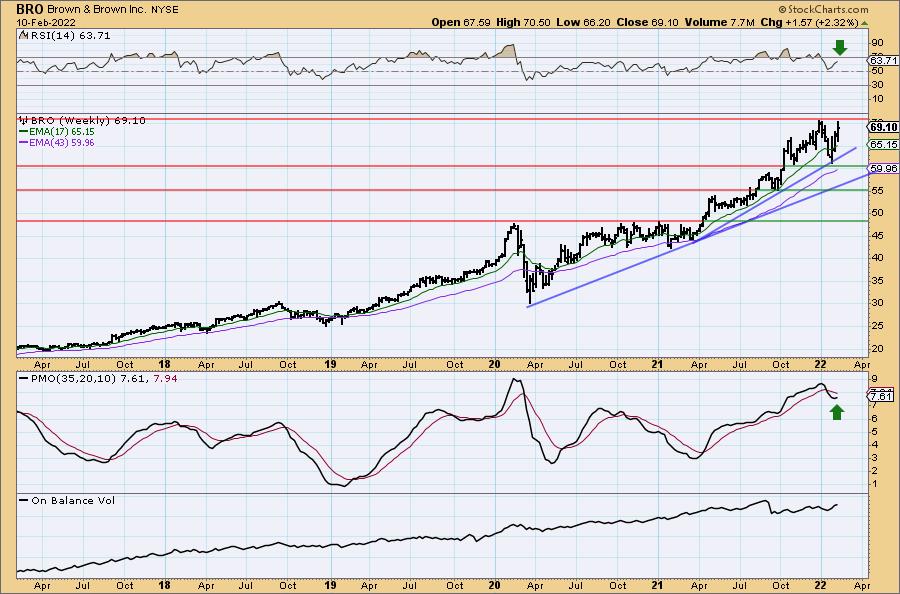
The weekly RSI is positive and rising. The weekly PMO looks very bullish as it turns back up. BRO has a long-term rising trend and a slightly steeper intermediate-term rising trend. Since it is at all-time highs, I'd consider a 16% target around $80.15.
Corteva Inc. (CTVA)
EARNINGS: 5/3/2022 (AMC)
Corteva, Inc. operates as a holding company. It engages in the provision of agricultural products. The firm operates through the following segments: Seed and Crop Protection. The Seed segment develops and supplies germplasm and traits that produce optimum yield for farms. The Crop Protection segment serves the global agricultural input industry with products that protect against weeds, insects and other pests, and disease and that improve overall crop health both above and below ground via nitrogen management and seed-applied technologies. Its services include pasture and land management and pest management. The company was founded in 1802 and is headquartered in Wilmington, DE.
Predefined Scans Triggered: Elder Bar Turned Blue, New 52-week Highs, Stocks in a New Uptrend (Aroon) and P&F Double Top Breakout.
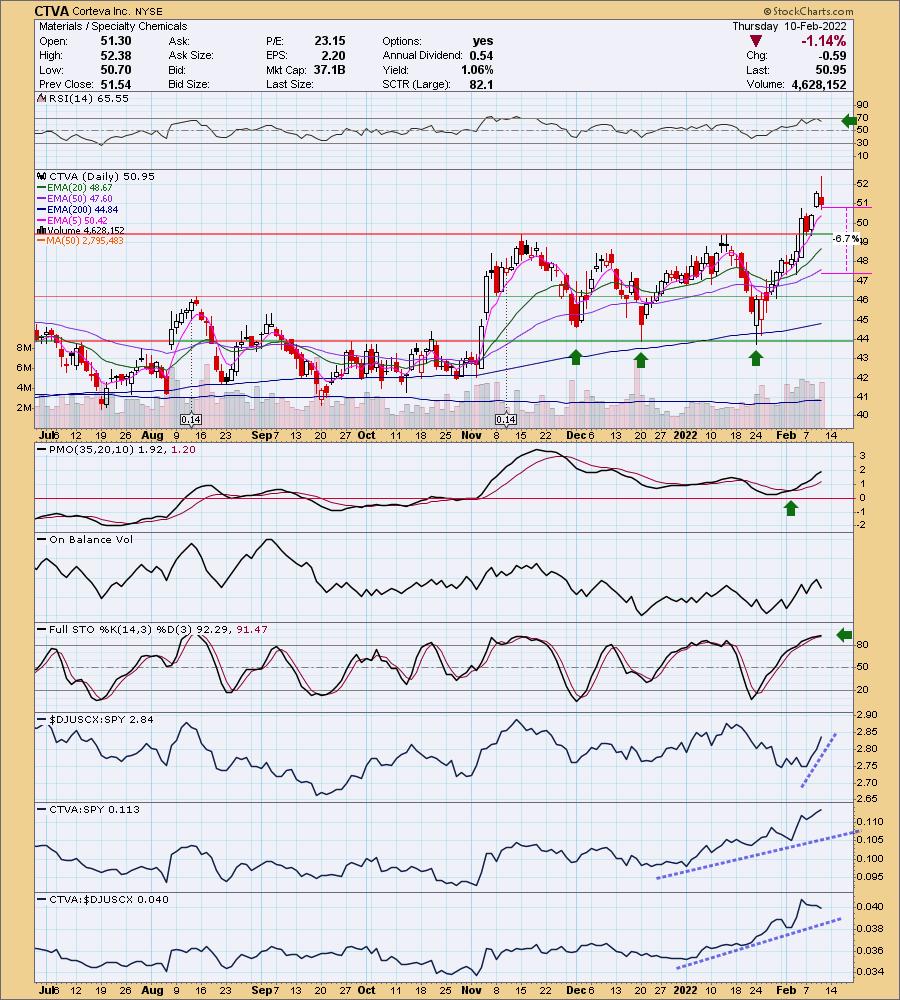
CTVA is unchanged in after hours trading. It was a difficult decision picking this one. Cameco (CCJ) was also requested and looks good too. Here we have a triple-bottom price breakout. The pattern would suggest a minimum upside target around $54. I like the breakout and the PMO crossover BUY signal that accompanied it. The RSI is positive and Stochastics are above 80 suggesting internal strength. The OBV has been confirming the rally, but there is a negative divergence in the longer term measured from the November top to today's current price. It has begun to underperform the group, but in the longer-term it is still outperforming both the group and the SPY. I set the stop below the 50-day EMA.
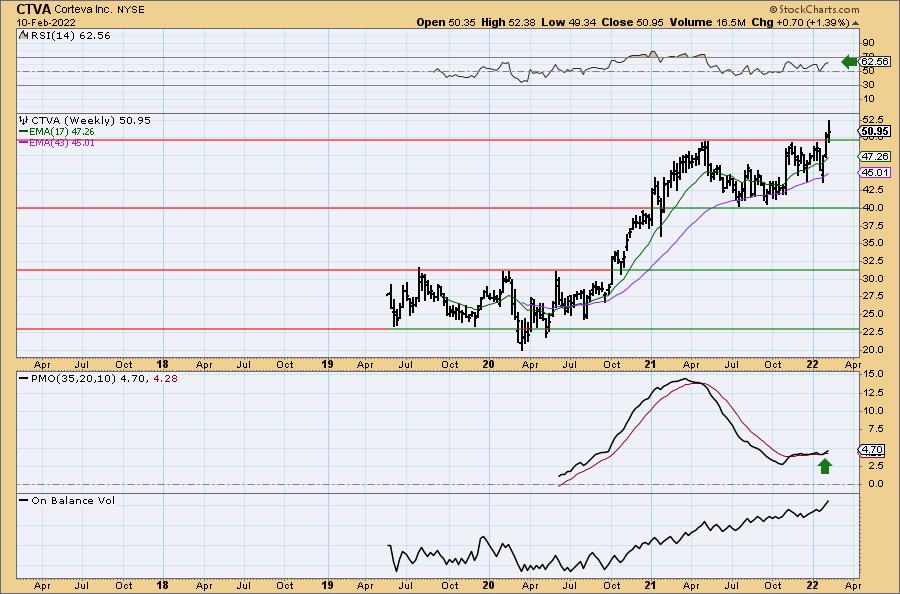
This weekly chart is excellent. The weekly RSI is positive and not overbought. This breakout is also accompanied by a recent weekly PMO crossover BUY signal. Since it is at all-time highs, consider an upside target of 14% around $58.
iShares Latin America 40 ETF (ILF)
EARNINGS: N/A
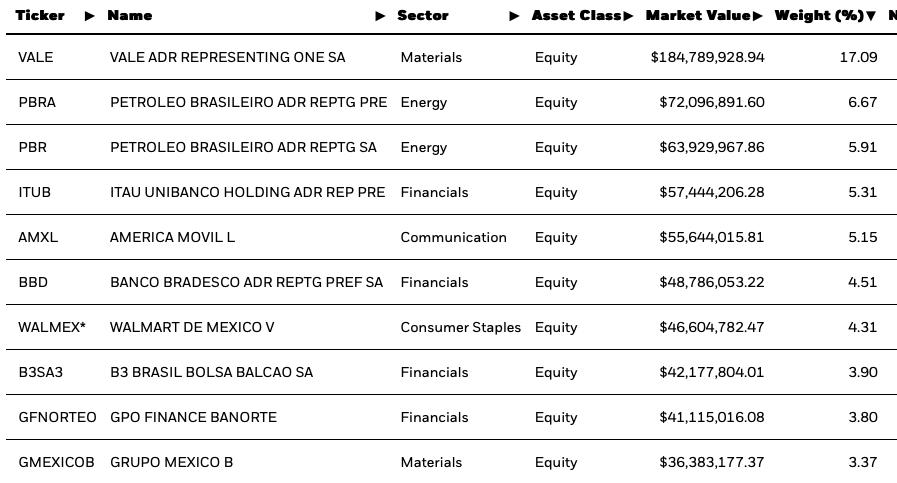
ILF tracks a market-cap-weighted index of 40 of the largest Latin American firms.
Top Ten Holdings:
Predefined Scans Triggered: Moved Above Upper Keltner Channel, P&F Low Pole and Shooting Star.
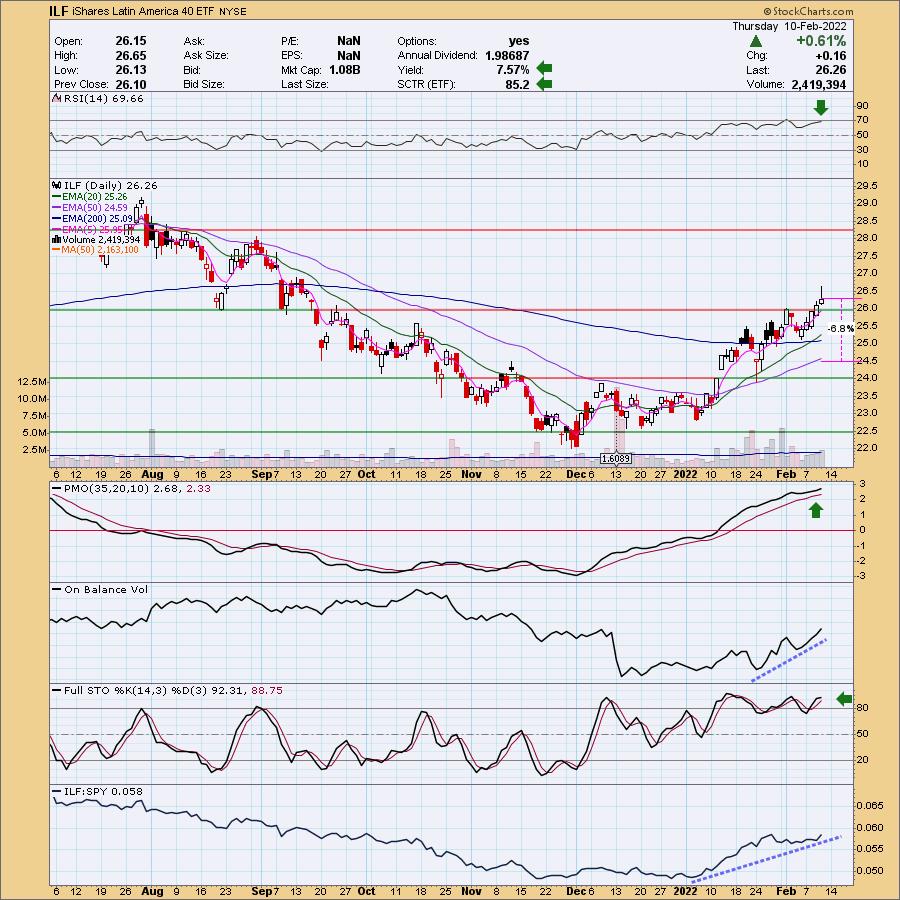
ILF is up +0.72% in after hours trading. I noticed a few international ETFs in my scan results yesterday, including EWZ which was also requested. I liked ILF best. We have a nice basing pattern that ILF is breaking out of. Today's shooting star candlestick isn't encouraging, but knowing it is up in after hours trading, I think it'll be fine. Notice the high yield and high StockCharts Technical Rank (SCTR). The RSI is getting overbought but is still rising. The PMO is rising nicely, albeit overbought. The OBV is confirming the rally. Stochastics are oscillating around 80 which demonstrates internal strength. Relative strength for this ETF is very good. I set the stop below the 50-day EMA.
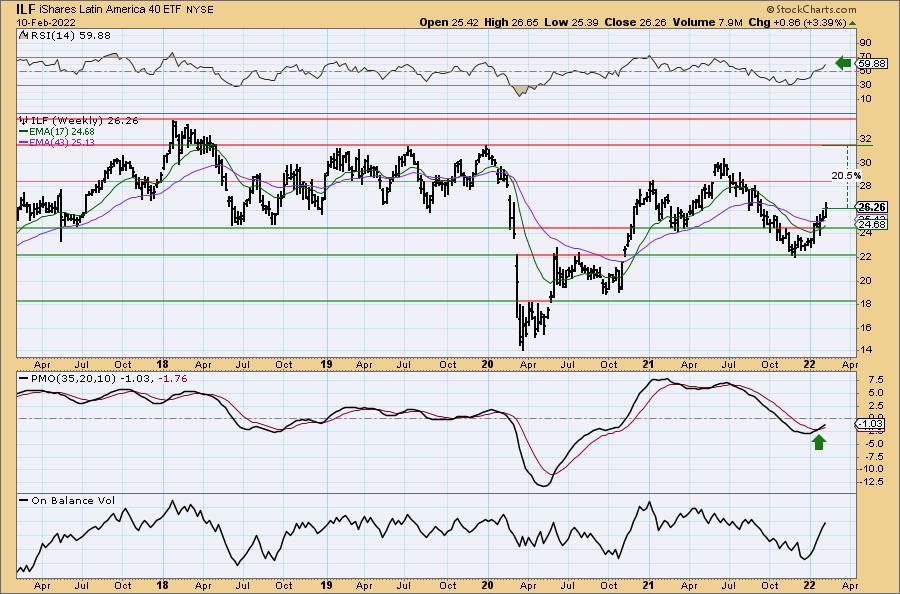
The weekly chart shows a nice breakout above the 43-week EMA. The weekly RSI is positive and rising. The PMO just triggered a crossover BUY signal and volume is definitely coming in.
US Global Jets ETF (JETS)
EARNINGS: N/A
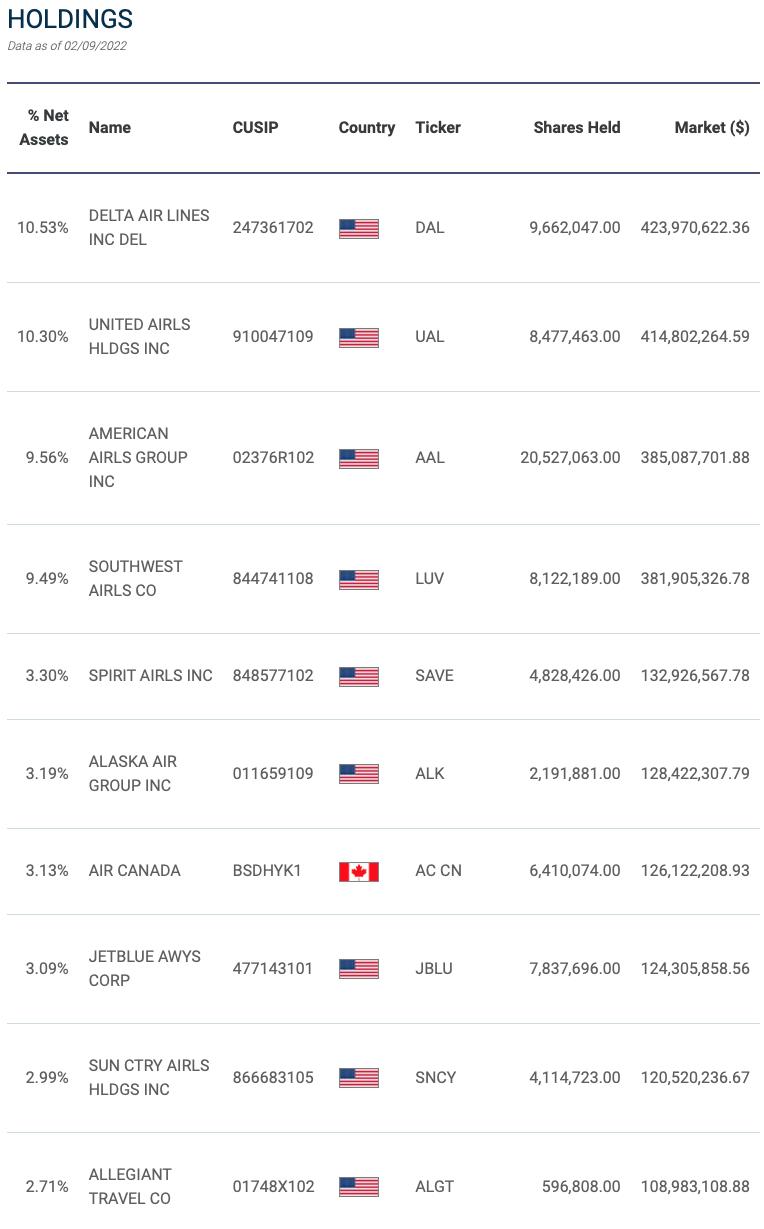
JETS invests in both US and non-US airline companies. This concentrated portfolio is weighted towards domestic passenger airlines.
Top Ten Holdings:
Predefined Scans Triggered: Hollow Red Candles and P&F Low Pole.
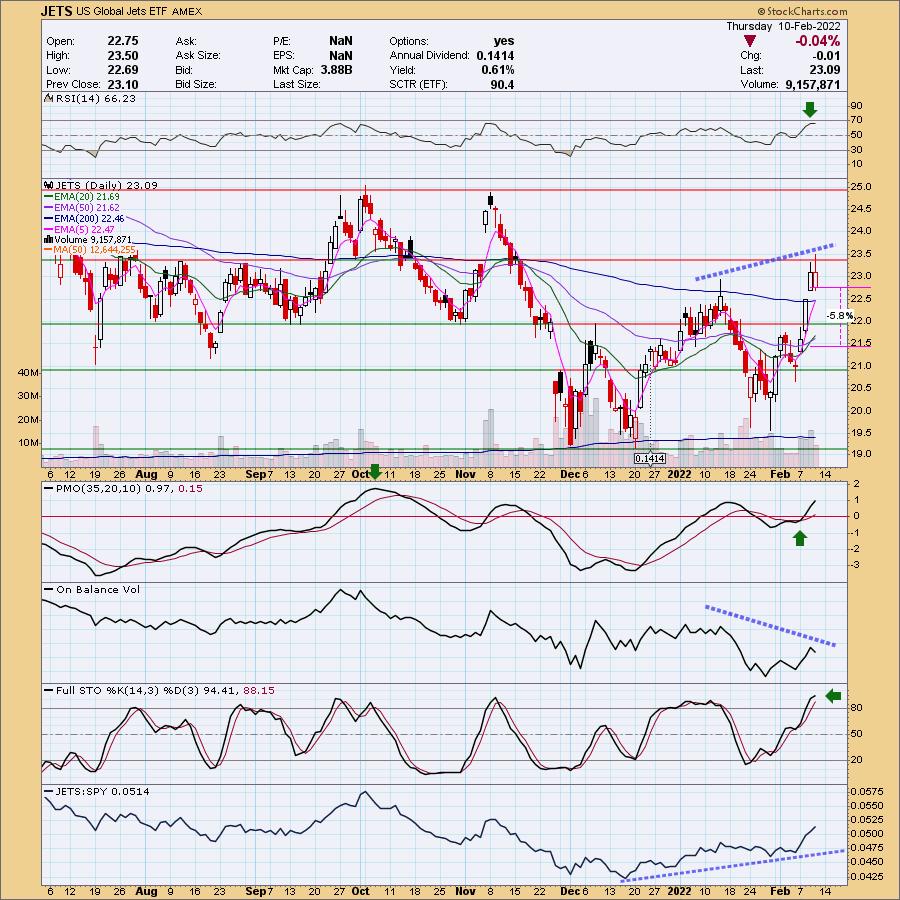
JETS is down -0.56% in after hours trading. Two readers requested this one. I've covered it twice before on September 10th 2020 (position didn't have a stop level listed, but if you'd held through a 15% decline, it was up the rest of the way) and May 18th 2021 (position stopped out quickly). I remember picking up Alaska Airlines (ALK) shortly after I wrote that article and had to dump it a few days later.
There is a lot of talk about airlines right now. I like the rally and the new IT Trend Model "Silver Cross" BUY signal. We also have a very positive PMO, strong Stochastics and positive RSI. You can see how this ETF has been outperforming the market with that performance increasing this past week. However, I'm not a huge fan. Resistance is being hit and based on after hours trading, it looks as if it might hold. There is also a pretty big negative OBV divergence. I wanted to cover this one given all the recent love and two readers requesting it. I just want to show you there are some negatives here so be careful.
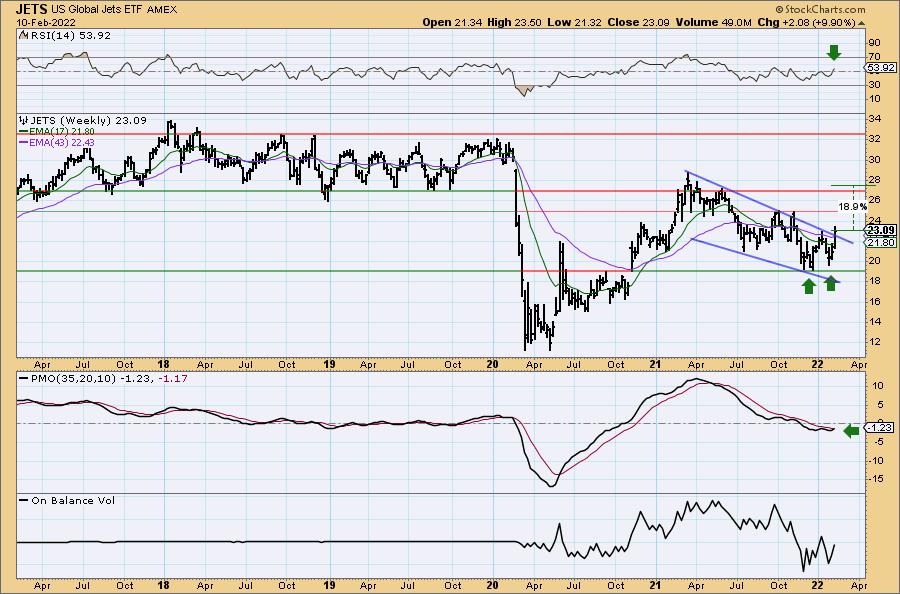
On the other hand, the weekly chart is starting to get interesting. There is a double-bottom pattern that is currently being confirmed with a close above the confirmation line drawn from the middle of the "W". The weekly PMO is about to have a positive crossover BUY signal. There is also the breakout from the bullish falling wedge. If it can recapture 2021 high, that would be an almost 19% gain. I just would be careful.
Kezar Life Sciences, Inc. (KZR)
EARNINGS: 3/10/2022 (AMC)
Kezar Life Sciences, Inc. is a clinical-stage biopharmaceutical company, which engages in the development of novel small molecule therapeutics to treat autoimmunity and cancer in South San Francisco and California. Its product pipeline include KZR-616, KZR-261, and KZR-TBD. The company was founded by John Fowler, Christopher J. Kirk, and Jack Taunton on February 20, 2015 and is headquartered in South San Francisco, CA.
Predefined Scans Triggered: None.
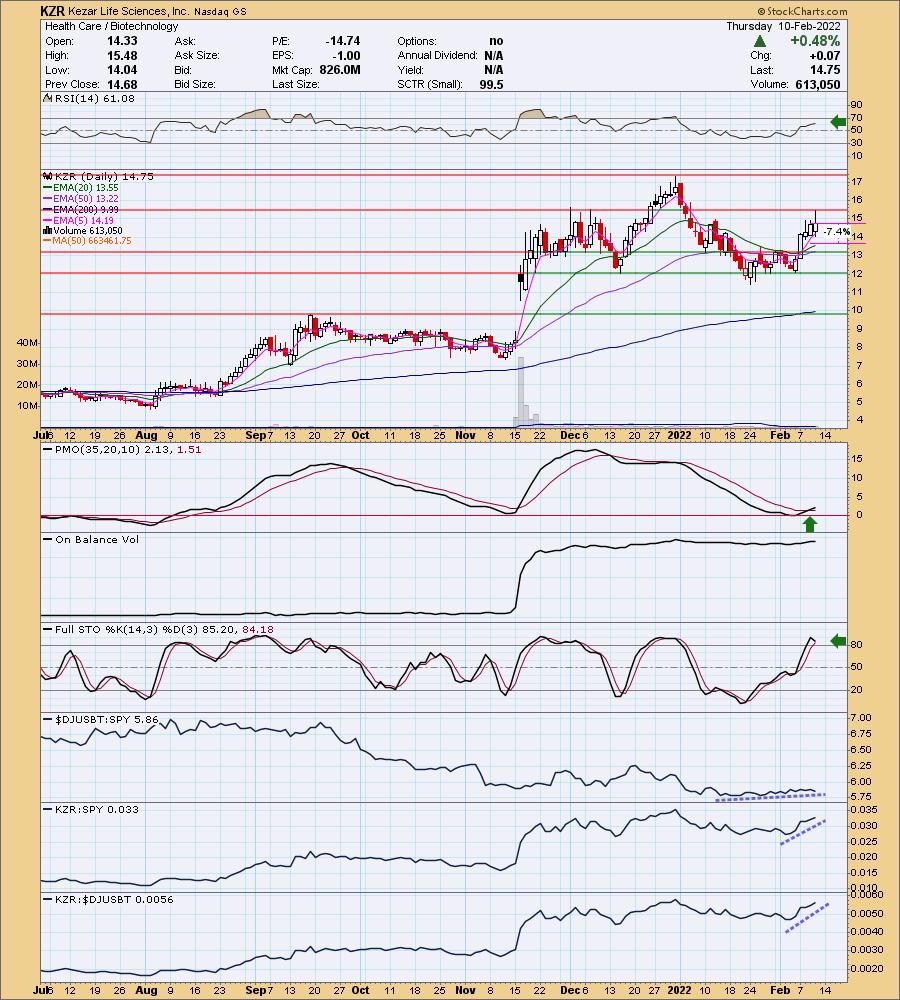
KZR is unchanged in after hours trading. This one was hard to pass up, but remember it is in the volatile Biotech group. I also note a negative P/E. I really like the price action though, except that it is now up against resistance at the early December tops. The RSI is positive and the PMO just triggered a crossover BUY signal. Stochastics have topped but remain above 80. The group hasn't been underperforming the SPY, but it really isn't outperforming either. KZR is outperforming both right now. The stop is set near the 20-day EMA.
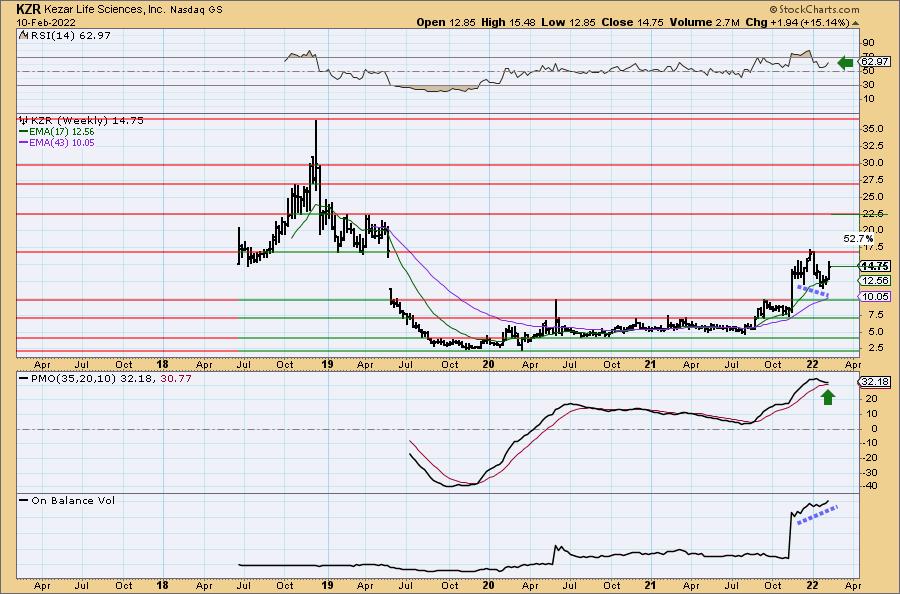
We don't have a good view of the OBV on the daily chart, but we do on the weekly and it sports a very nice positive divergence with price lows. The weekly PMO was beginning to look suspect, but it is turning up above its signal line right now which is bullish. The weekly RSI is positive, rising and not overbought. If it can break above over head resistance and close the 2019 gap, I would look for a move to 2019 highs.
Don't forget, on Thursdays I look at reader-requested symbols, click HERE to shoot me an email. I read every email I receive and try to answer them all!
Current Market Outlook:
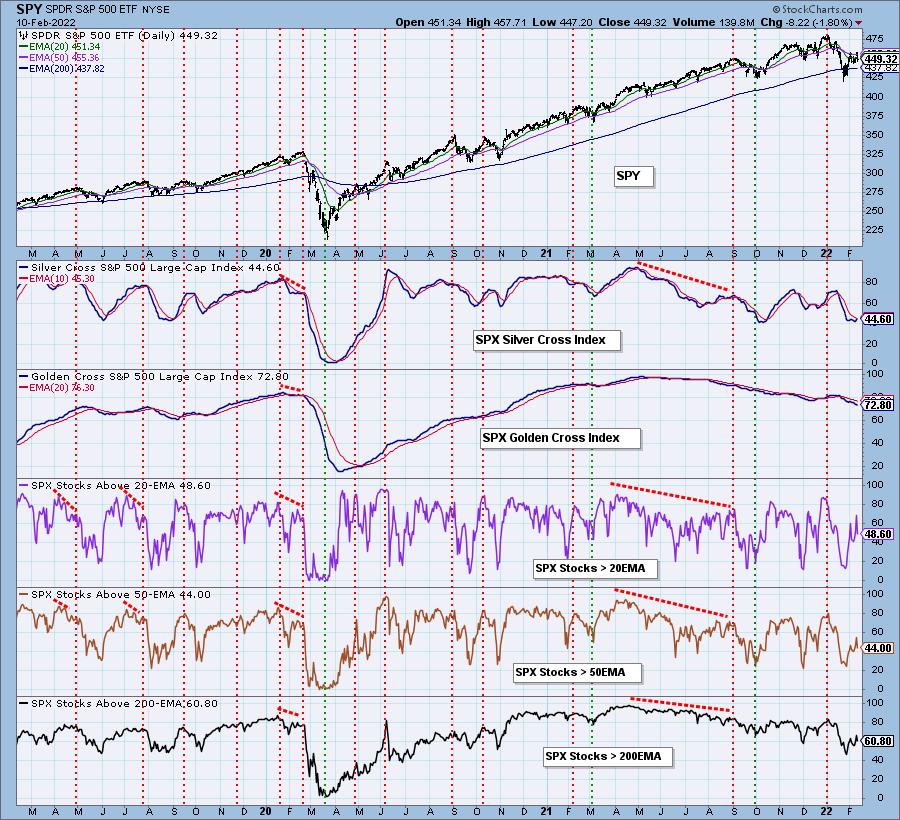
Market Environment: It is important to consider the odds for success by assessing the market tides. The following chart uses different methodologies for objectively showing the depth and trend of participation for intermediate- and long-term time frames.
- The Silver Cross Index (SCI) shows the percentage of SPX stocks on IT Trend Model BUY signals (20-EMA > 50-EMA)
- The Golden Cross Index (GCI) shows the percentage of SPX stocks on LT Trend Model BUY signals (50-EMA > 200-EMA)
Don't forget that as a "Diamonds" member, you have access to our GCI/SCI curated ChartList on DecisionPoint.com. You'll find it under "Members Only" links on the left side on the Blogs and Links Page.
Here is the current chart:
Full Disclosure: I'm 15% invested and 85% is in 'cash', meaning in money markets and readily available to trade with. I've been switching it up here and there, but it is getting tedious.
I'm required to disclose if I currently own a stock and/or may buy it within the next 72 hours.
Happy Charting!
- Erin
"Technical Analysis is a windsock, not a crystal ball." - Carl Swenlin
(c) Copyright 2022 DecisionPoint.com
Watch the latest episode of DecisionPoint with Carl & Erin Swenlin on Mondays 7:00p EST or on the DecisionPoint playlist on the StockCharts TV YouTube channel here!
NOTE: The stocks reported herein are from mechanical trading model scans that are based upon moving average relationships, momentum and volume. DecisionPoint analysis is then applied to get five selections from the scans. The selections given should prompt readers to do a chart review using their own analysis process. This letter is not a call for a specific action to buy, sell or short any of the stocks provided. There are NO sure things or guaranteed returns on the daily selection of "Diamonds in the Rough."
Helpful DecisionPoint Links:
DecisionPoint Shared ChartList and DecisionPoint Chart Gallery
Price Momentum Oscillator (PMO)
Swenlin Trading Oscillators (STO-B and STO-V)
For more links, go to DecisionPoint.com