
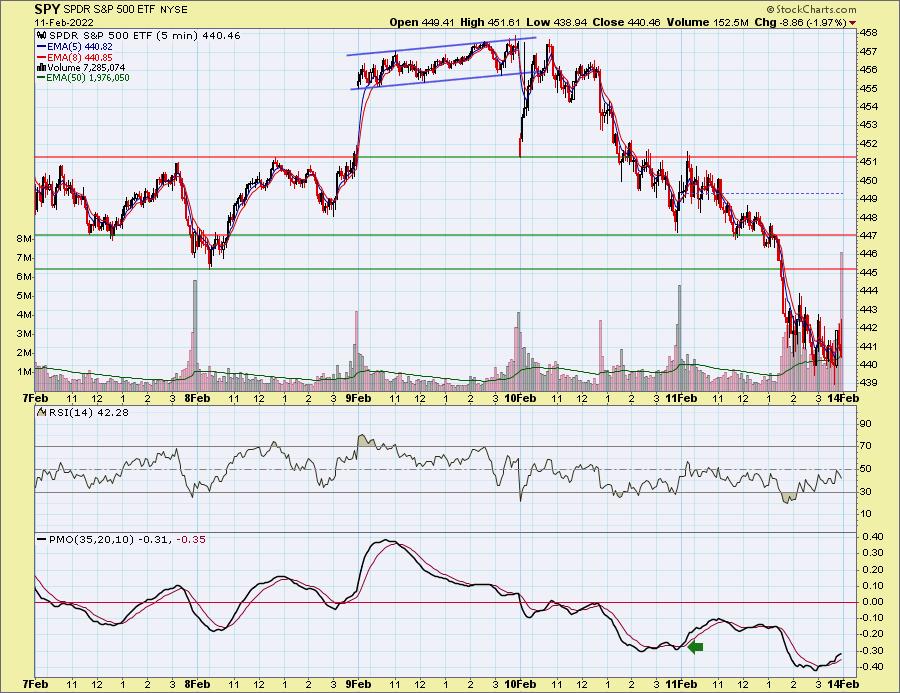
The market has already been struggling with volatility and weakness. Yesterday's inflation report and St. Louis Fed President Bullard's remarks of speeding up rate hikes, set the market in decline. We were seeing a mid-morning attempt to rally, but around 2p ET the White House basically told us that Russia is moving forward with invasion of Ukraine before the Olympics end. There is a Saturday phone call scheduled between the Presidents, but it doesn't sound good.
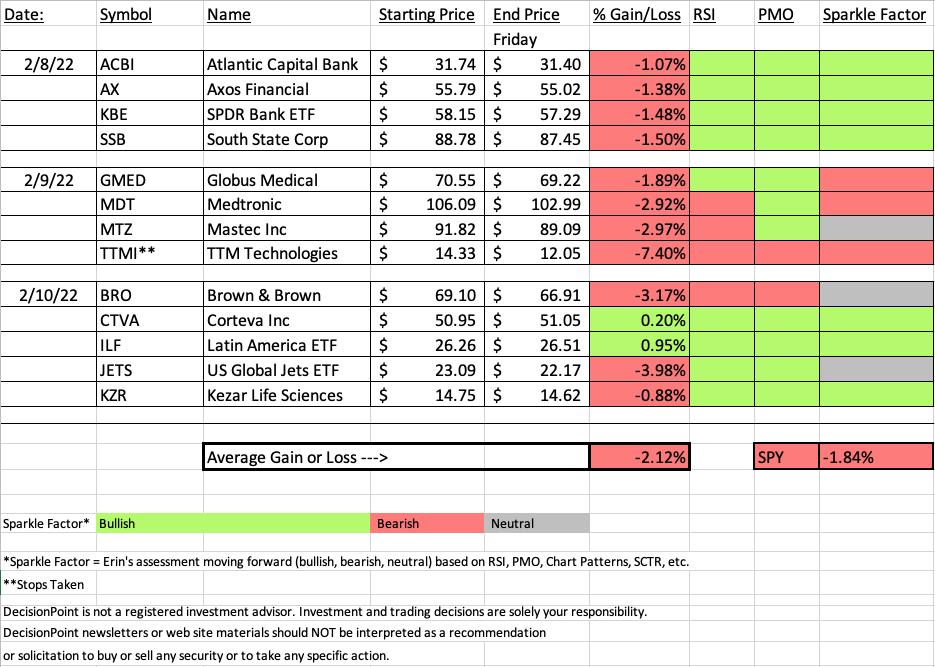
When I started the Diamond Mine this morning, "Diamonds in the Rough" were down on average about 1%. With the sell-off this after they finished down -2.12% compared to the -1.84% of the SPY for the week. Again, remember that our picks started on Tuesday and had to weather more storms so I'm actually okay with it.
The Bank stocks I picked on Tuesday were down over 1% this week, but I still think they look bullish moving forward. That could change quickly, but for now I'm still holding my Bank stock.
Read on for "Sector to Watch" and "Industry Group to Watch".
The recording link for to today's Diamond Mine trading room is below and will be in every DP Diamonds report, as is the registration link for next week's. We had a full room today, but I was still able to get to all of the symbol requests. I'm not always good about it, but email your trading room requests early and that will guarantee I'll give them look in either trading room.
Have a great weekend!
Erin

RECORDING LINK (2/11/2022):
Topic: DecisionPoint Diamond Mine (2/11/2022) LIVE Trading Room
Start Time: Feb 11, 2022 09:00 AM
Meeting Recording Link.
Access Passcode: Diamond@11
REGISTRATION FOR Friday 2/18 Diamond Mine:
When: Feb 18, 2022 09:00 AM Pacific Time (US and Canada)
Topic: DecisionPoint Diamond Mine (2/18/2022) LIVE Trading Room
Register in advance for this webinar HERE.
Save the registration confirmation email with login instructions in case Zoom doesn't notify you in time.

Free DP Trading Room (2/7) RECORDING LINK:
Topic: DecisionPoint Trading Room
Start Time: Feb 7, 2022 09:00 AM
Meeting Recording Link.
Access Passcode: February#7
For best results, copy and paste the access code to avoid typos.
A few items about the spreadsheet: I've put on the spreadsheet whether the RSI is positive (green) or negative (red). The PMO column tells you if it is rising (green) or falling (red). Finally I've added my own "Sparkle Factor" that gives you my assessment going forward, bullish (green), bearish (red) or neutral (gray). The Sparkle Factor is basically my thoughts on whether I expect it to rise or fall. A neutral means it could really go either way so it could be added to a watch list. If you're in a stock I consider "neutral" going forward, the ball is in your court.
Darling:
iShares Latin America 40 ETF (ILF)
EARNINGS: N/A
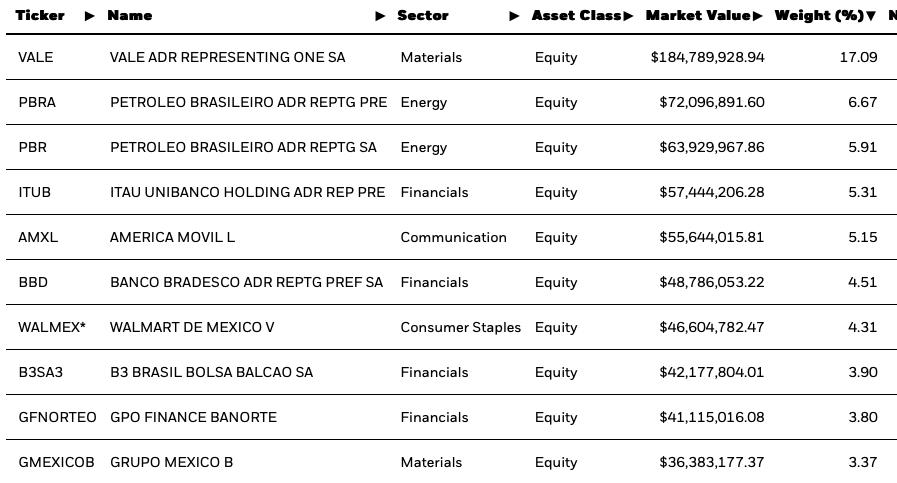
ILF tracks a market-cap-weighted index of 40 of the largest Latin American firms.
Top Ten Holdings:
Predefined Scans Triggered: Moved Above Upper Keltner Channel, P&F Low Pole and Shooting Star.
Below are the commentary and chart from yesterday (2/10):
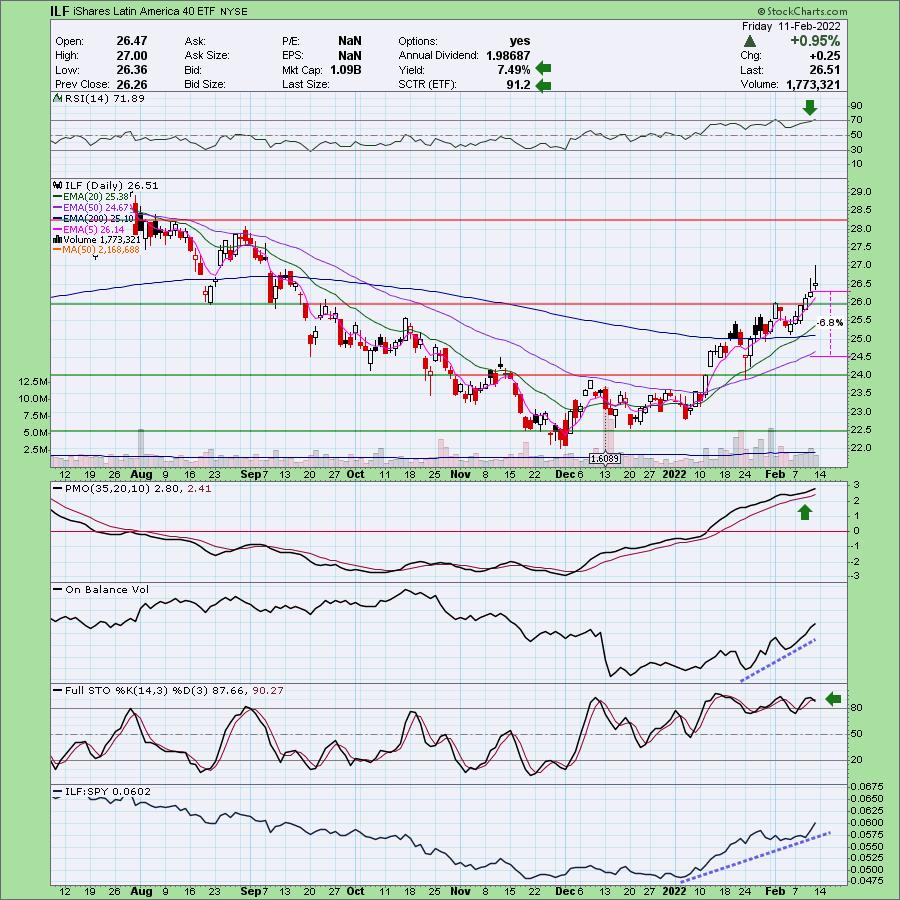
"ILF is up +0.72% in after hours trading. I noticed a few international ETFs in my scan results yesterday, including EWZ which was also requested. I liked ILF best. We have a nice basing pattern that ILF is breaking out of. Today's shooting star candlestick isn't encouraging, but knowing it is up in after hours trading, I think it'll be fine. Notice the high yield and high StockCharts Technical Rank (SCTR). The RSI is getting overbought but is still rising. The PMO is rising nicely, albeit overbought. The OBV is confirming the rally. Stochastics are oscillating around 80 which demonstrates internal strength. Relative strength for this ETF is very good. I set the stop below the 50-day EMA."
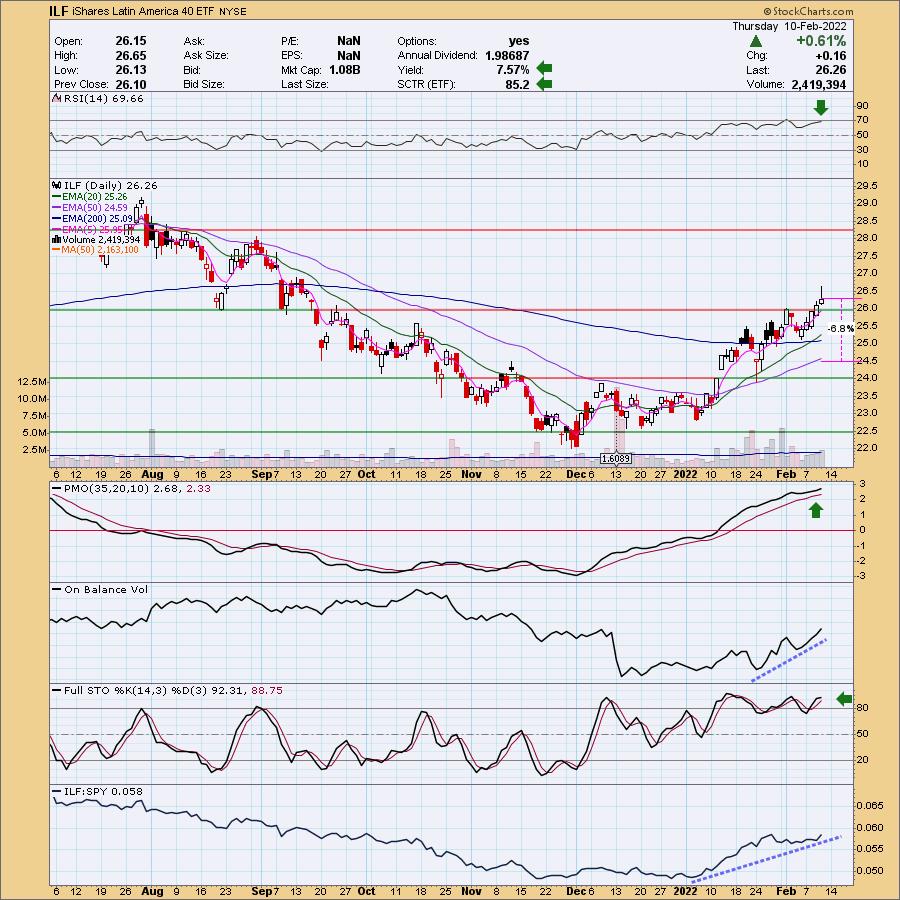
Here is today's chart:
ETFs aren't a bad idea right now. I like this chart and it only continues to get more bullish. The PMO avoided a crossover SELL signal and while it is overbought (along with the RSI), It looks like it has more room to run. The only issue with international ETFs right now is exposure to Europe and Russia given tensions. This one looks unperturbed.
Don't forget, on Thursdays I look at reader-requested symbols, so shoot me an email at erin@decisionpoint.com. I read every email I receive and try to answer them all!
Dud:
TTM Technologies, Inc. (TTMI)
EARNINGS: 2/9/2022 (AMC) ** Reported Today **
TTM Technologies, Inc. engages in the manufacture and sale of printed circuit boards and backplane assemblies. It operates through the following segments: Printed Circuit Board (PCB), RF&S Components, and Electro-Mechanical Solutions. The PCB segment consists of fifteen domestic PCB and sub-system plants, five PCB fabrication plants in China, and one in Canada. The RF&S Components segment consists of one domestic RF component plant and one RF component plant in China. The E-M Solutions segment consists of three custom electronic assembly plants in China. The company offers products such as backplanes, system integration, chassis assemblies, integrated circuit substrates and chips, and engineering services. TTM Technologies was founded on March 20, 1978 and is headquartered in Santa Ana, CA.
Predefined Scans Triggered: None.
Below are the commentary and chart from Wednesday (2/9):
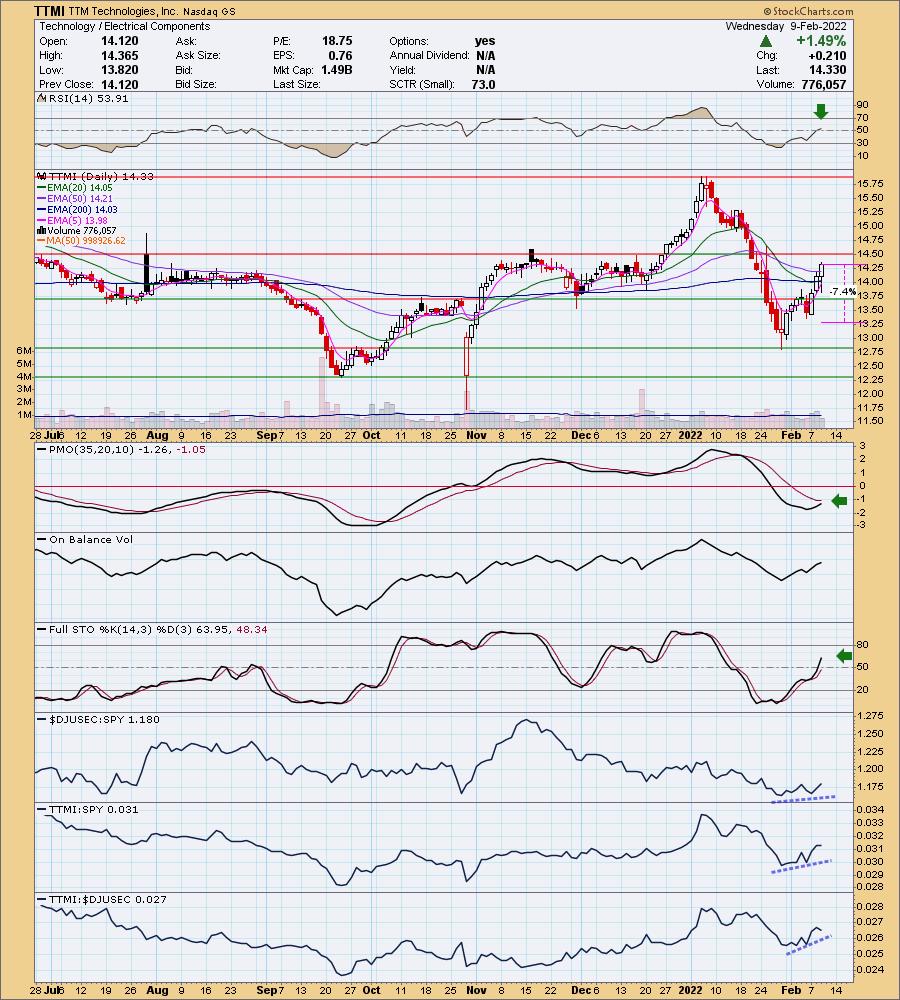
"TTMI is down -0.21% in after hours trading. This company has ties to China and Canada. One of the other themes I noticed today were plenty of international ETFs hitting the scan results so this connection could help this stock. The biggest concern would be that they reported earnings after the bell (I apologize I don't know the actual results); however, it is only down slightly in after hours trading. We will see if this turns out to be a problem tomorrow. Price just broke and closed above the 50-day EMA. The RSI has moved into positive territory and is rising. The PMO is headed for a crossover BUY signal. Stochastics are rising and hit positive territory. Relative strength is positive as the group and TTMI are beginning to outperform the market. TTMI is also outperforming the group. The stop is set below the pullback last week."
Below is today's chart:
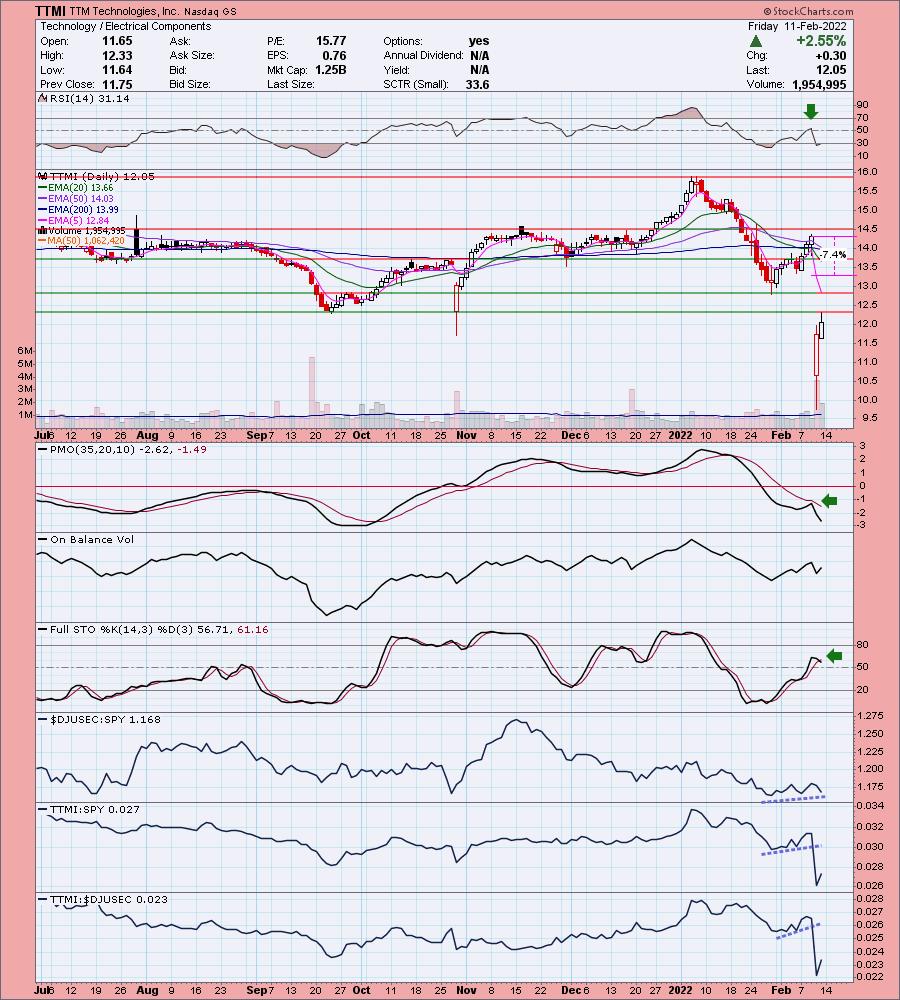
This a lesson in earnings and how when they are reported it can throw everything off. As I discussed in the Diamond Mine, this chart looked great going into earnings. I'm thankful that due to its gap down open that none of you would've been caught in the crossfire. I took the loss of 7.4% on the spreadsheet. In actuality it is down 15.91% since Wednesday. Avoid, avoid, avoid (like I have to tell you this) given the rebound was stopped right on overhead resistance. I don't see a future here.
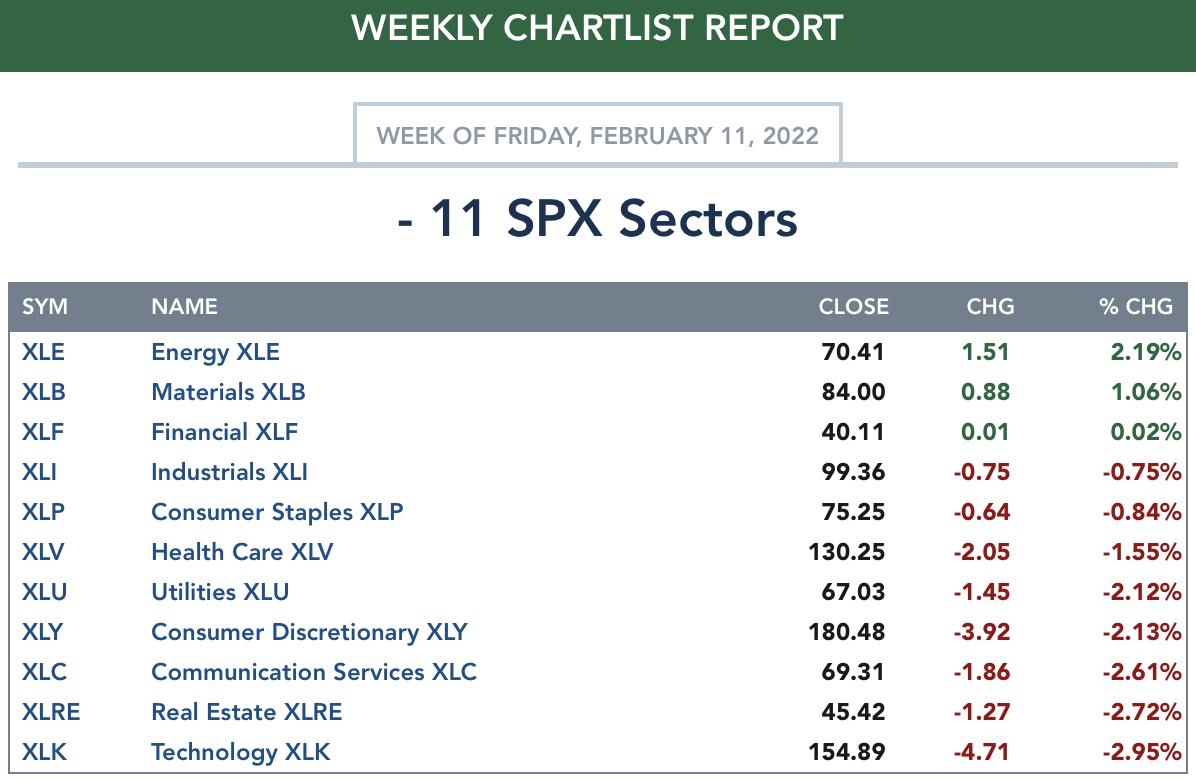
TODAY'S Sector Performance:
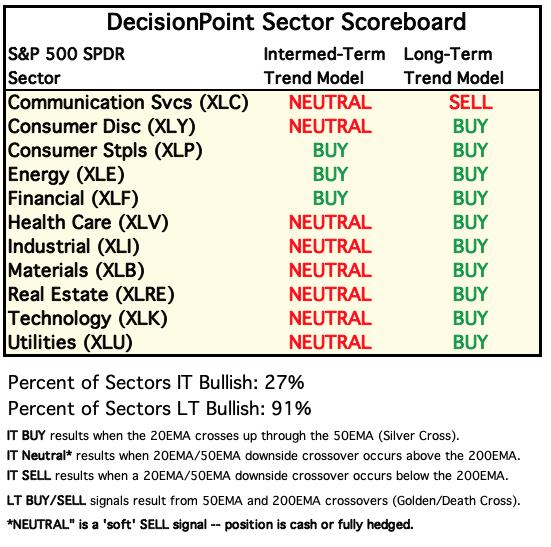
DecisionPoint Sector Scoreboard (Mechanical Trend Model Signals):
Click Here to view Carl's annotated Sector ChartList!
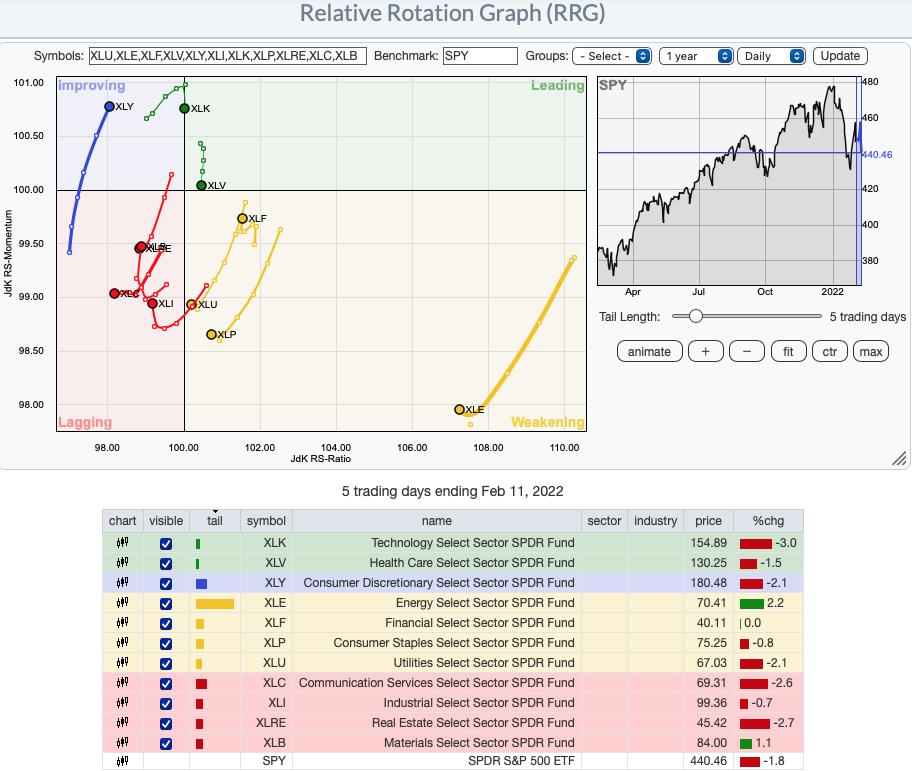
Short-term (Daily) RRG: The short-term RRG is already showing how relative strength is being lost by XLK and XLV. We do see XLF headed for Leading which is why I still like Banks. Another sector showing some improvement would be XLRE and XLI. I am just guessing here, but if war is likely, Industrials will likely see relative strength... but that could simply mean 'moving lower, but not as fast'. Real Estate I don't trust given the mortgage rates are skyrocketing. The most bearish sector on the short-term chart is XLB. That is about to change given the outlook for Gold is bullish. All others are attempting to hook back around, but they are mostly in Lagging. XLU and XLP need to turn it around quickly or they will find themselves in Lagging. Given they are defensive areas of the market, they should see some love.
Intermediate-Term (Weekly) RRG: In the longer term, XLY and XLK look the least favorable. The most bullish is XLE which continues to shoot off the charts. That will continue. XLF has popped into Leading this week and like XLE has the most bullish northeast heading. XLP also has the northeast heading but it is slowly being pulled lower. According to the weekly RRG, up and coming sectors are XLI and XLV. I'd be careful with XLV as it is loaded with volatile stocks right now. XLB managed to turn a little eastward which is good. XLC is trying to come back to life in the intermediate term.
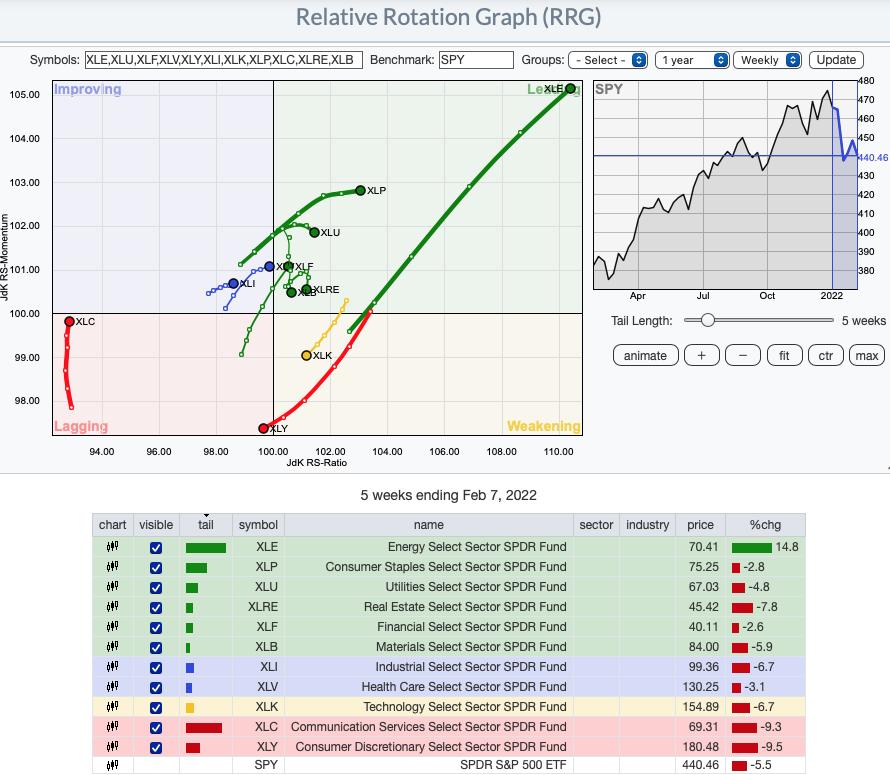
RRG® charts show you the relative strength and momentum for a group of stocks. Stocks with strong relative strength and momentum appear in the green Leading quadrant. As relative momentum fades, they typically move into the yellow Weakening quadrant. If relative strength then fades, they move into the red Lagging quadrant. Finally, when momentum starts to pick up again, they shift into the blue Improving quadrant.
CLICK HERE for an animated version of the RRG charts.
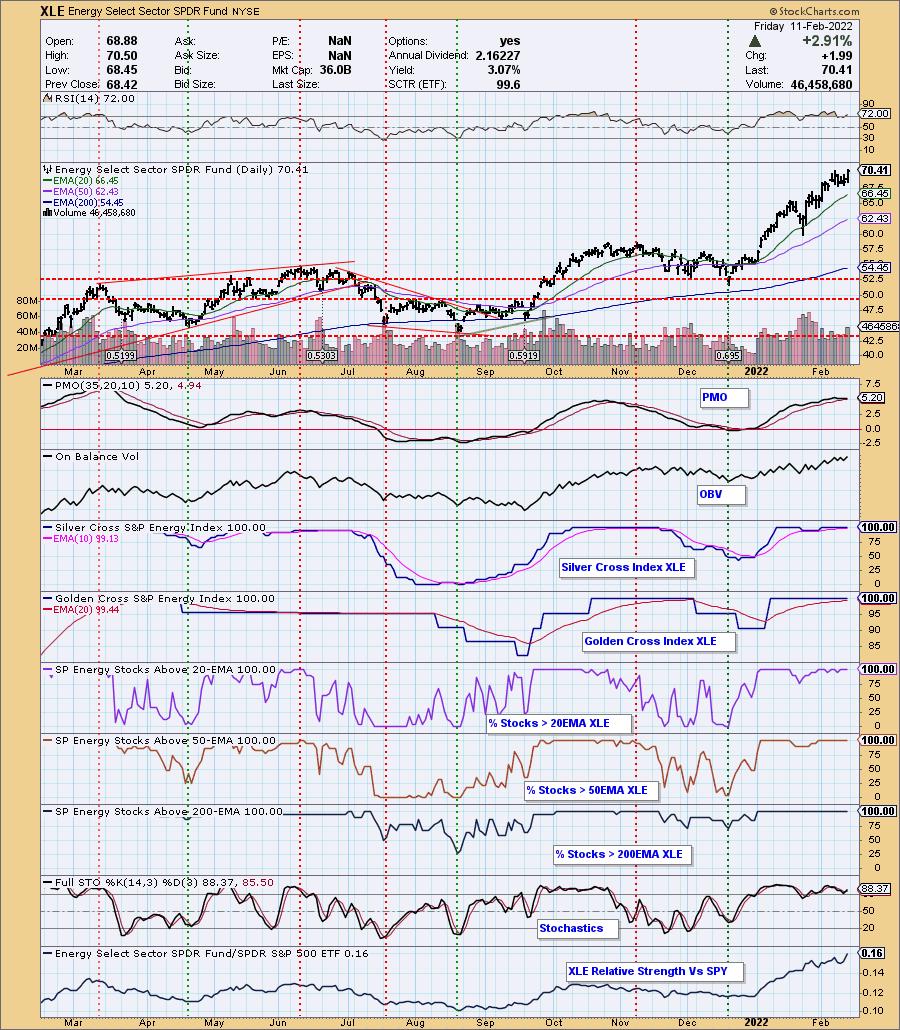
Sector to Watch: Energy (XLE)
In today's Diamond Mine we were concentrating on Financials (XLF), but with today's end of day sell-off, the XLF chart doesn't look as good given the big decline and the tipping over of the PMO. Could also be forming a double-top, but it is the runner-up so keep an eye on it.
Energy is an easy pick. With unrest in the Russia/Ukraine, energy prices will likely go up. It isn't a given, but this sector chart tells us this is our best area of exposure. Participation is strong and while it is overbought in almost every way, strength typically begets strength. I mean we have 100% of stocks in the sector with golden crosses, silver crosses and price above 20/50/200-EMAs. Our confidence level of picking a good stock here should be high.
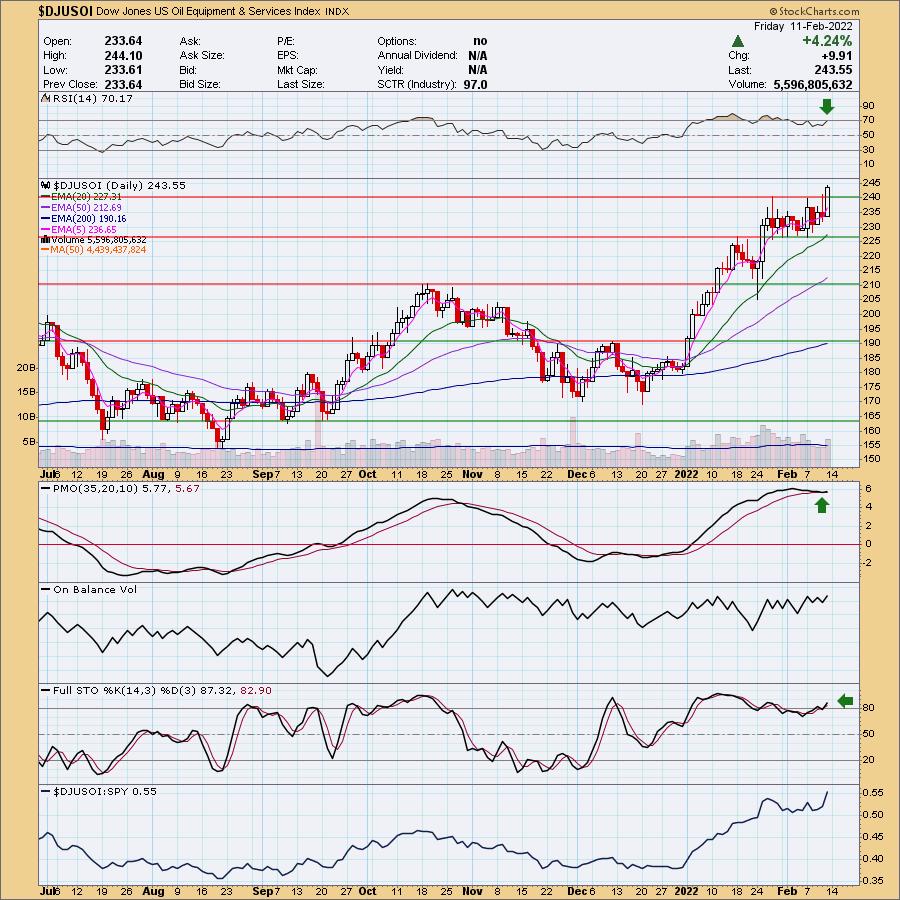
Industry Group to Watch: US Oil Equipment & Services ($DJUSOI)
All of the groups in Energy look good, but in particular I like $DJUSOI. Coal is also looking good. We have a nice breakout and despite the PMO being very overbought, it is turning up above the signal line, aborting a probable crossover SELL signal. The RSI is just now getting overbought. It will likely be overbought for some time. Stochastics look great.
Go to our Sector ChartList on DecisionPoint.com to get an in depth view of all the sectors.
Have a great weekend! The next Diamonds Report is TUESDAY 2/15.
- Erin
erin@decisionpoint.com
Full Disclosure: I'm about 15% exposed to the market.
Watch the latest episode of DecisionPoint with Carl & Erin Swenlin on Mondays 7:00p EST or on the DecisionPoint playlist on the StockCharts TV YouTube channel here!
Technical Analysis is a windsock, not a crystal ball. --Carl Swenlin
NOTE: The stocks reported herein are from mechanical trading model scans that are based upon moving average relationships, momentum and volume. DecisionPoint analysis is then applied to get five selections from the scans. The selections given should prompt readers to do a chart review using their own analysis process. This letter is not a call for a specific action to buy, sell or short any of the stocks provided. There are NO sure things or guaranteed returns on the daily selection of "diamonds in the rough."
Helpful DecisionPoint Links:
DecisionPoint Shared ChartList and DecisionPoint Chart Gallery
Price Momentum Oscillator (PMO)
Swenlin Trading Oscillators (STO-B and STO-V)
(c) Copyright 2021 DecisionPoint.comf