
Yesterday I talked about Banks finding new relative strength. They declined slightly today, but I still had a large majority in my scan results. I still like the group. I did have some interesting themes visible in my scan results other than Banks.
I found XLB and XLI ETFs landing in my Momentum Sleepers scan results and XLY in the PMO Crossover scan results. This rotation is interesting so in the "Stocks to Review" you will find some Materials stocks and Industrial stocks.
The other theme that presented itself was an increase in Medical Devices/Equipment stocks. I found two stocks that I like including a "bottom fish" in the group.
I included an Industrial/Heavy Construction stock to give us coverage in Industrials. Semiconductors still look very good--just take a look at SOXX (Link to my chart HERE). I decided to go with a Telecom Equipment stock in the Technology sector, but I like many of the Semis right now--AMD, LRCX, NVDA, MRVL and RMBS come to mind.
Today's "Diamonds in the Rough": GMED, MDT, MTZ and TTMI.
Stocks to Review (No order): XAR, BW, ESI, EXR, GO, GMS, JOE, MRVL, PAYX, REMX, RMBS, LRCX, AMD, NVDA, RXT, SPNE, URA and WSC.

RECORDING LINK (2/3/2022):
Topic: DecisionPoint Diamond Mine (THURSDAY 2/3) LIVE Trading Room
Start Time: Feb 3, 2022 09:00 AM
Meeting Recording Link.
Access Passcode: February@3rd
REGISTRATION FOR Friday 2/11 Diamond Mine:
When: Feb 11, 2022 09:00 AM Pacific Time (US and Canada)
Topic: DecisionPoint Diamond Mine (2/11/2022) LIVE Trading Room
Register in advance for this webinar HERE.
Save the registration confirmation email with login instructions in case Zoom doesn't notify you in time.

Topic: DecisionPoint Trading Room
Start Time: Feb 7, 2022 09:01 AM
Meeting Recording Link.
Access Passcode: February#7
For best results, copy and paste the access code to avoid typos.
Welcome to DecisionPoint Daily Diamonds, wherein I highlight ten "Diamonds in the Rough" per week. These are selected from the results of my DecisionPoint Scans, which search for stocks that could benefit from the trend and condition of the market. Remember, these are not recommendations to buy or sell, but are the most interesting of the stocks that surfaced in my scans. My objective is to save you the work of the initial, tedious culling process, but you need to apply your own analysis to see if these stocks pique your interest as well. There are no guaranteed winners here!
"Predefined Scans Triggered" are taken from the StockCharts.com using the "Symbol Summary" option instead of a "SharpChart" on the workbench.
Globus Medical, Inc. (GMED)
EARNINGS: 2/17/2022 (AMC)
Globus Medical, Inc. operates as a medical device company that develops and commercializes healthcare solutions. The firm engages in developing products that promote healing in patients with musculoskeletal disorders. It classifies products into Innovative Fusion and Disruptive Technology. It operates through the United States and International geographical segments. The company was founded by David C. Paul, David D. Davidar and Andrew Iott in March 2003 and is headquartered in Audubon, PA.
Predefined Scans Triggered: P&F Low Pole.
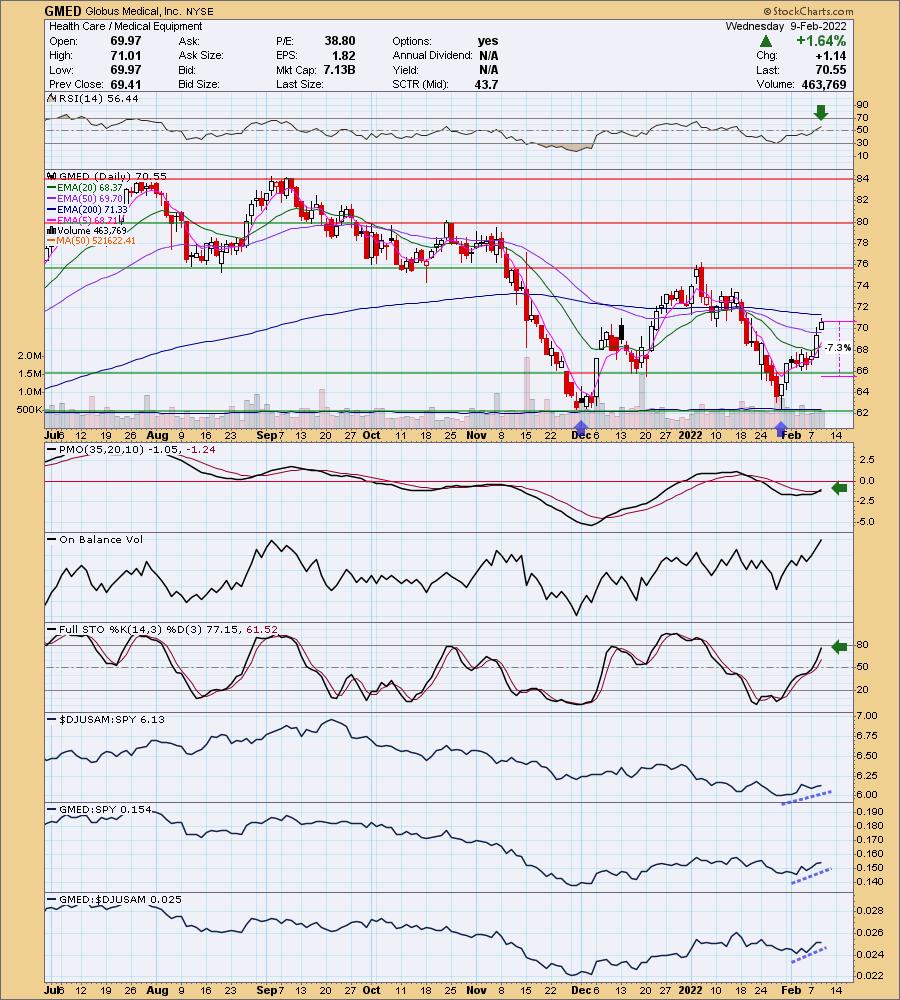
GMED is unchanged in after hours trading. What struck me first about this chart was the very large bullish double-bottom and the breakout above the 50-day EMA. The pattern will be confirmed with a breakout above $76. The RSI is rising in positive territory. The PMO just triggered a crossover BUY signal. Stochastics are rising nicely and should get above 80 soon. Relative strength for the group is just beginning to pick up out of oversold territory. GMED is a outperforming both the group and the SPY. There is one slight negative to the chart and that is the reverse divergence with OBV tops and price tops. The OBV is above the level it was at the November high and at about the same level as at the September top. This tells us that despite huge amounts of volume coming in, price was unable to recapture those price levels so technically price isn't really following volume right now. It's certainly forgivable in my analysis process, but I wanted to point it out. The stop is set below the mid-December lows.
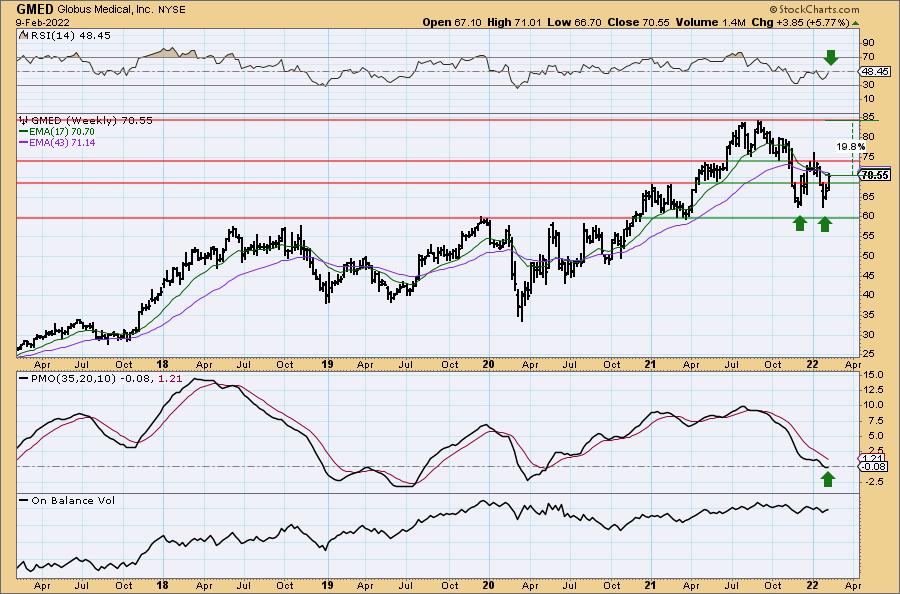
The double-bottom is very clear on the weekly chart. The weekly PMO is turning back up and the weekly RSI is almost in positive territory. If it can reach all-time highs again, that would be a nearly 20% gain.
Medtronic, Inc. (MDT)
EARNINGS: 2/22/2022 (BMO)
Medtronic Plc is a medical technology company, which engages in the development, manufacture, distribution, and sale of device-based medical therapies and services. It operates through the following segments: Cardiac and Vascular Group; Minimally Invasive Technologies Group; Restorative Therapies Group; and Diabetes Group. The Cardiac and Vascular Group segment consists of products for the diagnosis, treatment, and management of cardiac rhythm disorders and cardiovascular disease. The Minimally Invasive Technologies Group segment focuses on respiratory system, gastrointestinal tract, renal system, lungs, pelvic region, kidneys, and obesity diseases. The Restorative Therapies Group segment comprises of neurostimulation therapies and drug delivery systems for the treatment of chronic pain, as well as areas of the spine and brain, along with pelvic health and conditions of the ear, nose, and throat. The Diabetes Group segment offers insulin pumps, continuous glucose monitoring systems, and insulin pump consumables. The company was founded in 1949 and is headquartered in Dublin, Ireland.
Predefined Scans Triggered: Bullish MACD Crossovers.
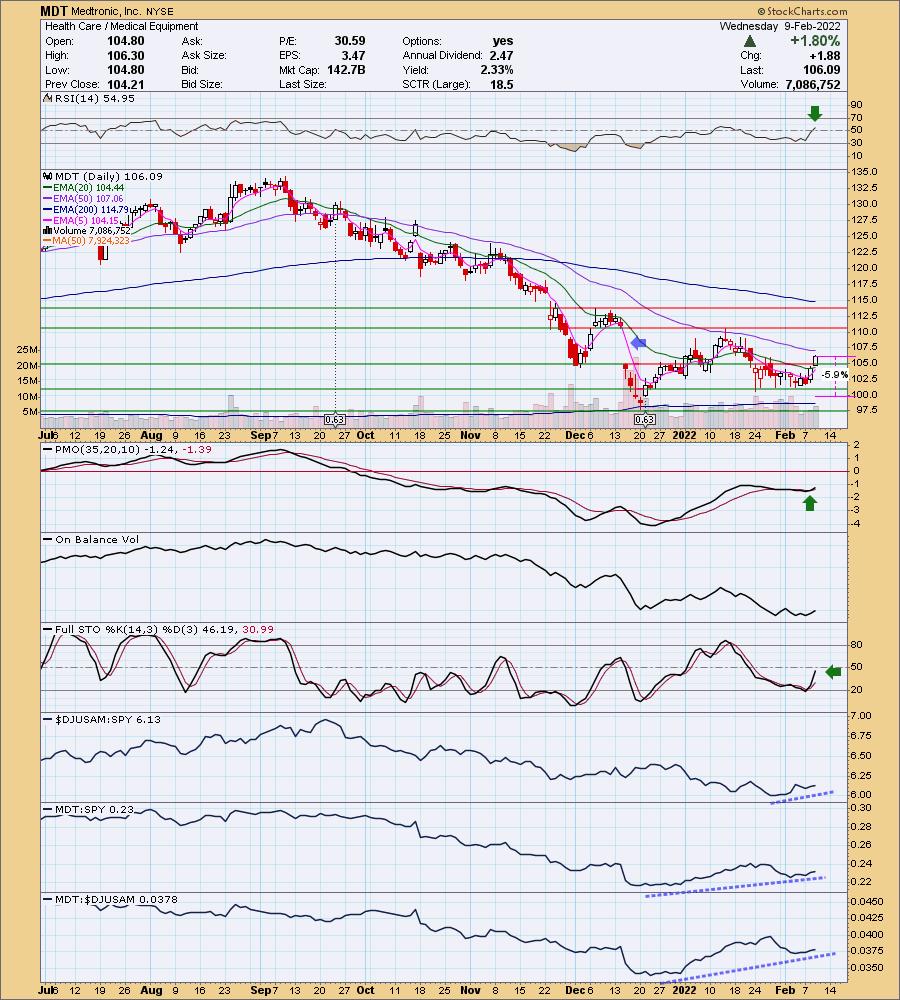
MDT is up +0.13% in after hours trading. This is a bottom fish since price hasn't reached above the 50-day EMA and there is a large margin between the 50-day EMA and 200-EMA. However, given I'm seeing rotation toward this industry group and the indicators are so positive, I'm presenting it. Price broke above the 20-day EMA so that's a good start. The RSI just entered positive territory and the PMO is accelerating upward on a new crossover BUY signal. Stochastics are rising, but in "bottom fish" fashion, it isn't yet in positive territory above net neutral (50). Relative strength is convincing as the group and this stock slowly take flight against the SPY. I really like that I can set a thin stop. That's not always possible with a bottom fish.
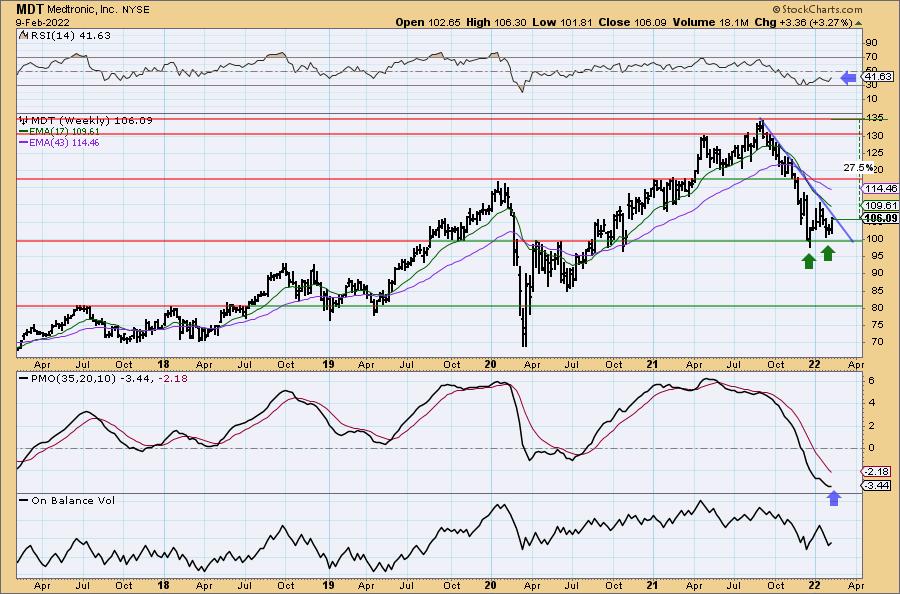
The intermediate-term declining trend has not yet been broken, but it looks like price may breakout this week or next. The weekly RSI is negative but is trending up. The weekly PMO is turning up in very oversold territory. If we see it breakout and reach the 2020 high that would be an almost 12% gain, but if it can breakout from there, the gain could be as high as 27%.
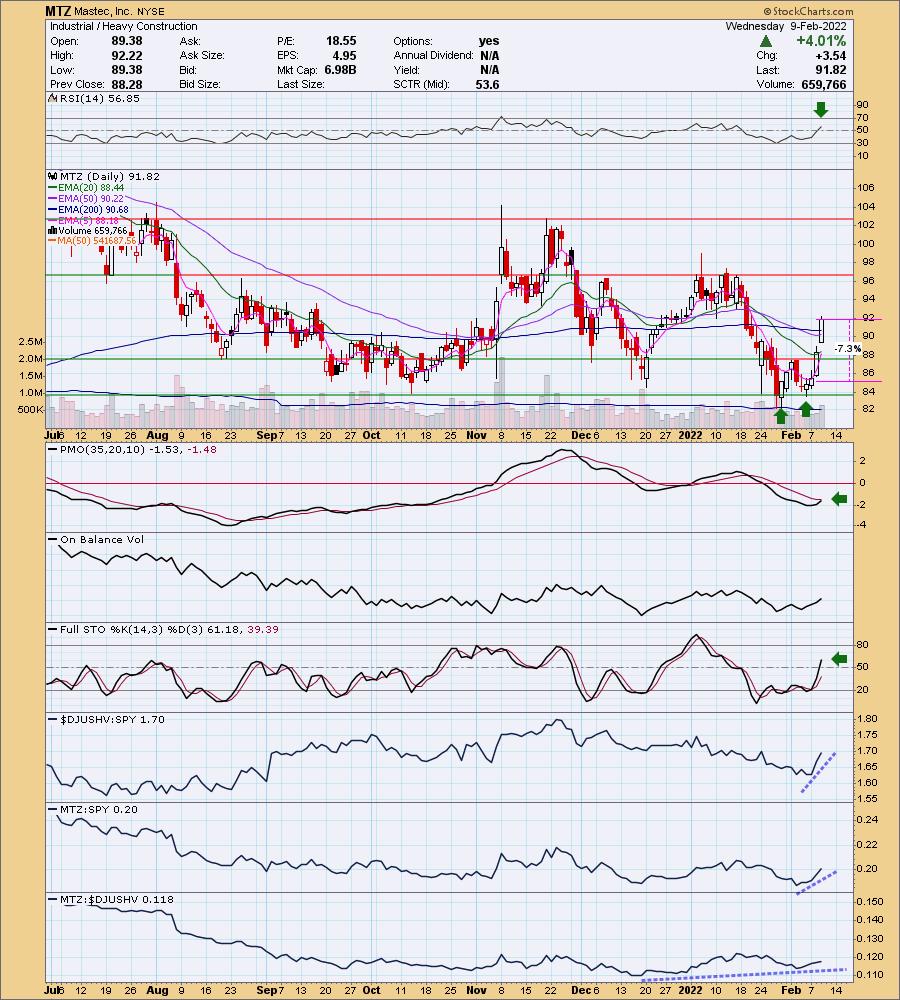
Mastec, Inc. (MTZ)
EARNINGS: 2/24/2022 (AMC)
MasTec, Inc. engages in the provision of infrastructure construction services. It operates through the following segments: Communications, Oil and Gas, Electrical Transmissions, Clean Energy and Infrastructure, and Other. The Communications segment performs engineering, construction, maintenance, and customer fulfillment activities related to communications infrastructure, primarily for wireless and wireline/fiber communications, and install-to-the-home customers. The Oil and Gas segment offers services on oil and natural gas pipelines and processing facilities for the energy and utilities industries. The Electrical Transmission segment deals with the energy and utility industries. The Clean Energy and Infrastructure segment serves energy, utility and other end-markets through the installation and construction of power generation facilities, including from clean energy and renewable sources such as wind, solar and biomass, as well as various types of heavy civil and industrial infrastructure. The Other segment consists of equity investees, other small business units that perform construction, and other services for a variety of international end-markets. The company was founded by Jorge Mas Canosa on March 11, 1994 and is headquartered in Coral Gables, FL.
Predefined Scans Triggered: Bullish MACD Crossovers, Entered Ichimoku Cloud and P&F Double Top Breakout.
MTZ is unchanged in after hours trading. Today saw a big upside rally that could imply a decline tomorrow, but that will offer a great entry on a pullback to the 200-day EMA. The double-bottom was confirmed and has hit its minimum upside target--"minimum" upside target. The RSI is positive, rising and not overbought. The PMO is going in for a crossover BUY signal. Stochastics are rising and have moved into positive territory. I really like how this group is beginning to outperform this week. The stop is set a little more than halfway down into the double-bottom pattern.
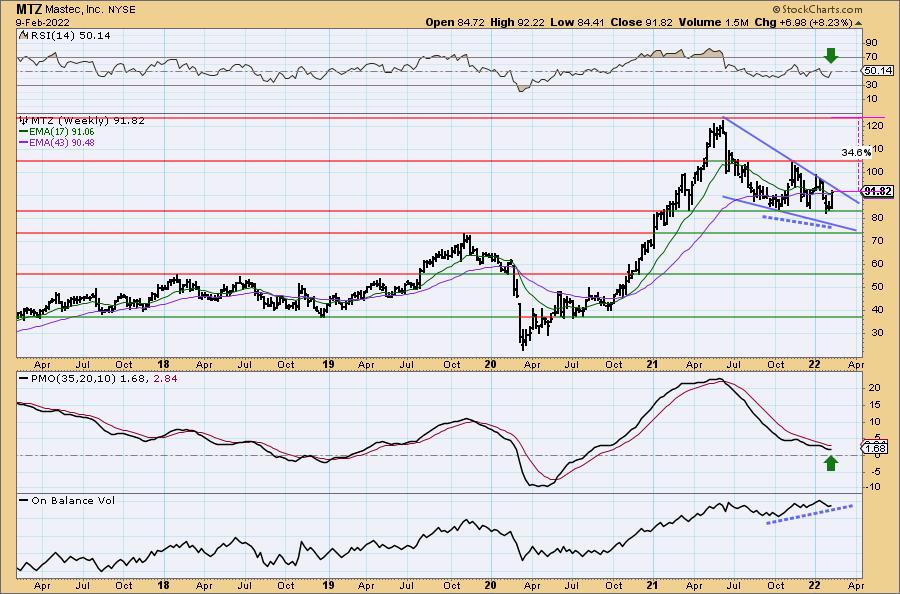
There is a bullish falling wedge on the weekly chart that hasn't been confirmed with a breakout yet, but the weekly RSI is positive and the weekly PMO is turning back up. There is also a slight positive divergence between price lows and OBV bottoms. Upside potential is about 15%+ if it reaches $105 resistance level or over 34% if is reaches all-time highs again.
TTM Technologies, Inc. (TTMI)
EARNINGS: 2/9/2022 (AMC) ** Reported Today **
TTM Technologies, Inc. engages in the manufacture and sale of printed circuit boards and backplane assemblies. It operates through the following segments: Printed Circuit Board (PCB), RF&S Components, and Electro-Mechanical Solutions. The PCB segment consists of fifteen domestic PCB and sub-system plants, five PCB fabrication plants in China, and one in Canada. The RF&S Components segment consists of one domestic RF component plant and one RF component plant in China. The E-M Solutions segment consists of three custom electronic assembly plants in China. The company offers products such as backplanes, system integration, chassis assemblies, integrated circuit substrates and chips, and engineering services. TTM Technologies was founded on March 20, 1978 and is headquartered in Santa Ana, CA.
Predefined Scans Triggered: None.
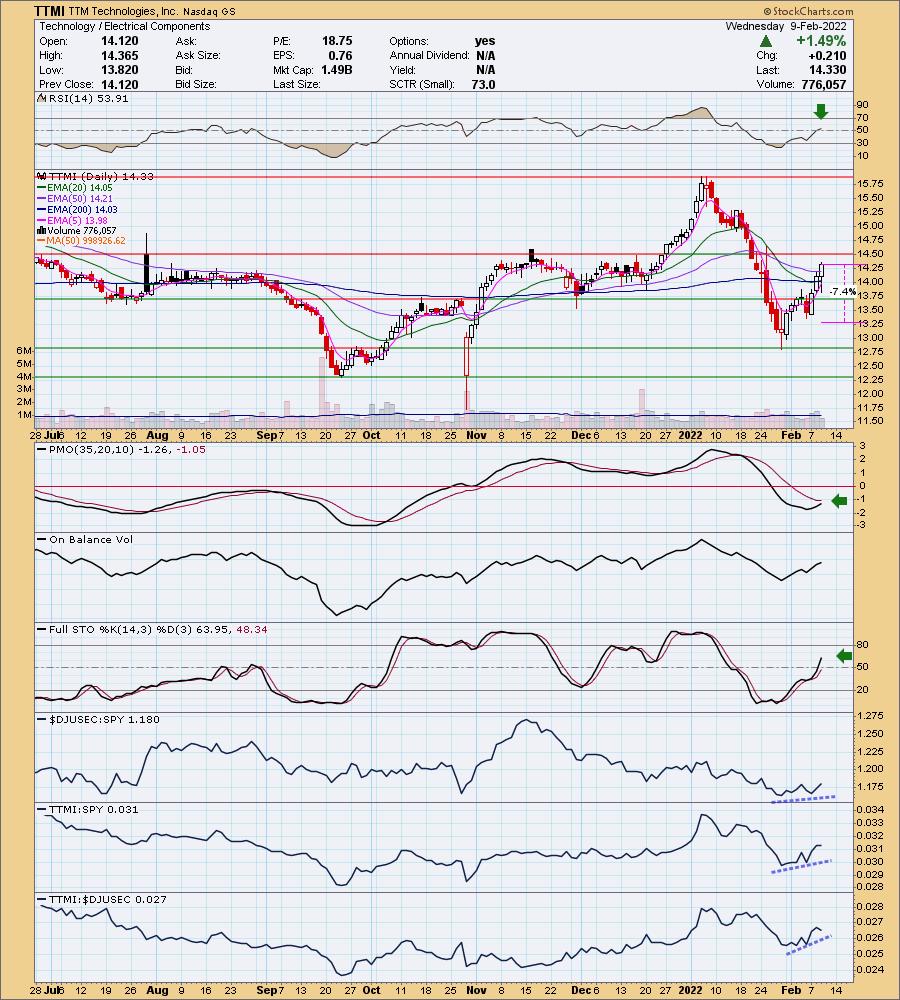
TTMI is down -0.21% in after hours trading. This company has ties to China and Canada. One of the other themes I noticed today were plenty of international ETFs hitting the scan results so this connection could help this stock. The biggest concern would be that they reported earnings after the bell (I apologize I don't know the actual results); however, it is only down slightly in after hours trading. We will see if this turns out to be a problem tomorrow. Price just broke and closed above the 50-day EMA. The RSI has moved into positive territory and is rising. The PMO is headed for a crossover BUY signal. Stochastics are rising and hit positive territory. Relative strength is positive as the group and TTMI are beginning to outperform the market. TTMI is also outperforming the group. The stop is set below the pullback last week.
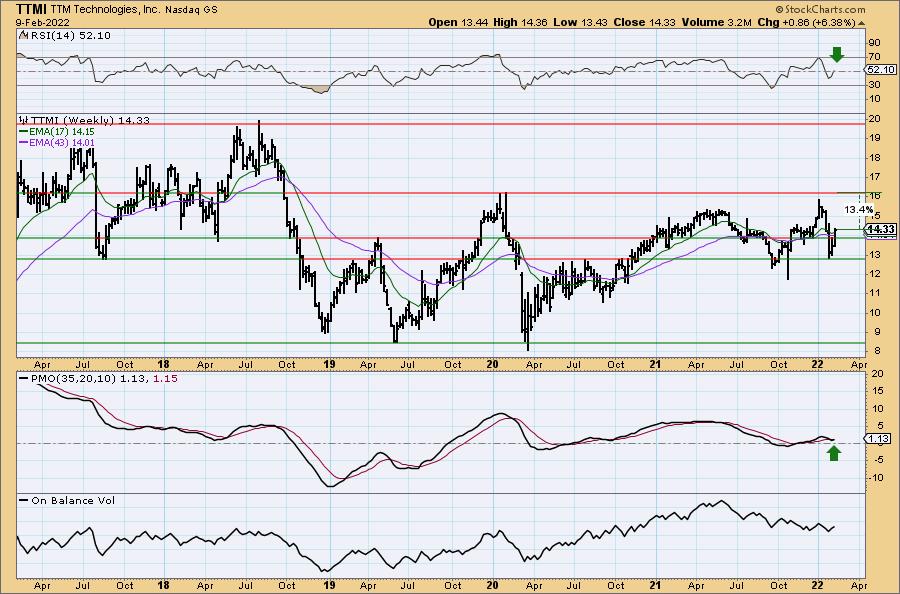
The weekly chart displays a newly positive weekly RSI and a PMO that is whipsawing back into a crossover BUY signal. If it reaches overhead resistance at the recent high and 2020 high, that would be a tidy 13.4% gain. If it breaks out, that could become a much larger gain.
Don't forget, on Thursdays I look at reader-requested symbols, click HERE to shoot me an email. I read every email I receive and try to answer them all!
Current Market Outlook:
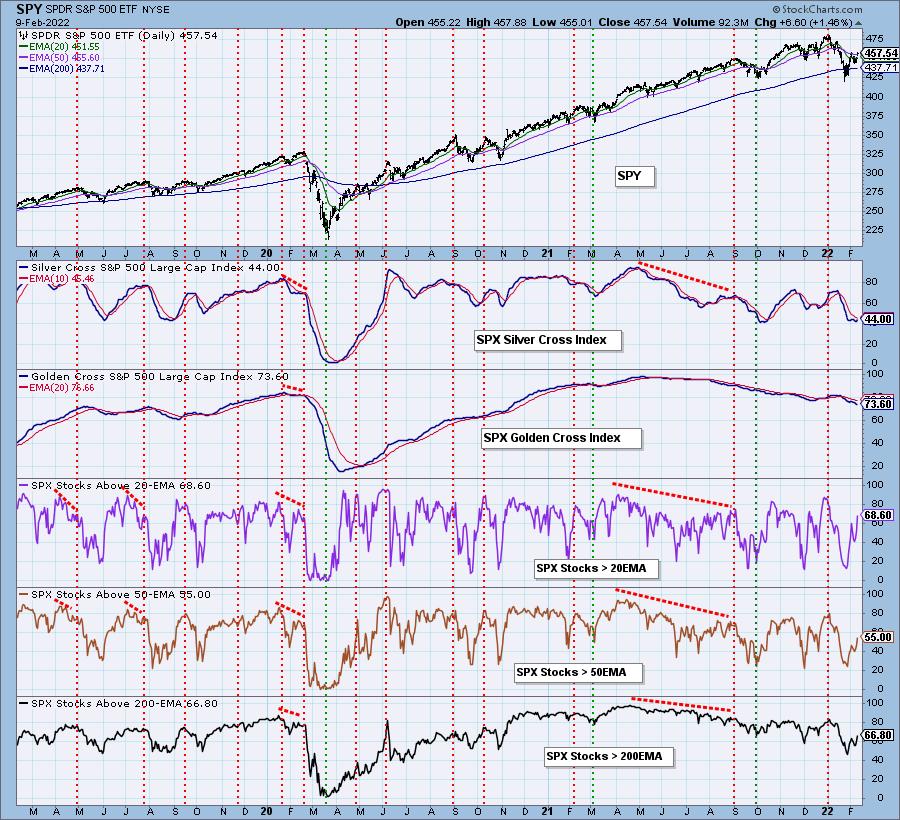
Market Environment: It is important to consider the odds for success by assessing the market tides. The following chart uses different methodologies for objectively showing the depth and trend of participation for intermediate- and long-term time frames.
- The Silver Cross Index (SCI) shows the percentage of SPX stocks on IT Trend Model BUY signals (20-EMA > 50-EMA)
- The Golden Cross Index (GCI) shows the percentage of SPX stocks on LT Trend Model BUY signals (50-EMA > 200-EMA)
Don't forget that as a "Diamonds" member, you have access to our GCI/SCI curated ChartList on DecisionPoint.com. You'll find it under "Members Only" links on the left side on the Blogs and Links Page.
Here is the current chart:
Full Disclosure: I'm 20% invested and 80% is in 'cash', meaning in money markets and readily available to trade with.
I'm required to disclose if I currently own a stock and/or may buy it within the next 72 hours.
Happy Charting!
- Erin
"Technical Analysis is a windsock, not a crystal ball." - Carl Swenlin
(c) Copyright 2022 DecisionPoint.com
Watch the latest episode of DecisionPoint with Carl & Erin Swenlin on Mondays 7:00p EST or on the DecisionPoint playlist on the StockCharts TV YouTube channel here!
NOTE: The stocks reported herein are from mechanical trading model scans that are based upon moving average relationships, momentum and volume. DecisionPoint analysis is then applied to get five selections from the scans. The selections given should prompt readers to do a chart review using their own analysis process. This letter is not a call for a specific action to buy, sell or short any of the stocks provided. There are NO sure things or guaranteed returns on the daily selection of "Diamonds in the Rough."
Helpful DecisionPoint Links:
DecisionPoint Shared ChartList and DecisionPoint Chart Gallery
Price Momentum Oscillator (PMO)
Swenlin Trading Oscillators (STO-B and STO-V)
For more links, go to DecisionPoint.com