
Welcome to a new week of "Diamonds in the Rough"! Two themes arose that define the times. First of all, I had very few results in my scans. Whenever this occurs I remind my readers that our confidence coefficient goes way down when there are fewer stocks that are bullishly configured.
The second theme is Consumer Staples. The majority of my scan results were from this sector. I have three Staples for you to look at today. A reminder, last week Kellogg (K) and Fresh Del Monte Produce (FDP) were covered. I liked Smuckers (SJM) but saw that it was down nearly 2% in after hours trading and opted not to include it.
The fourth pick today is a Financial in Property & Casualty Insurance, ProAssurance Corp (PRA).
Today's "Diamonds in the Rough": BGS, KO, POST and PRA.
Stocks to Review (No order): OGS, SJM, KHC, REYN and CNOB.

RECORDING LINK (2/18/2022):
Topic: DecisionPoint Diamond Mine (2/18/2022) LIVE Trading Room
Start Time: Feb 18, 2022 09:00 AM
Meeting Recording Link.
Access Passcode: February#18
REGISTRATION FOR Friday 2/25 Diamond Mine:
When: Feb 25, 2022 09:00 AM Pacific Time (US and Canada)
Topic: DecisionPoint Diamond Mine (2/25/2022) LIVE Trading Room
Register in advance for this webinar HERE.
Save the registration confirmation email with login instructions in case Zoom doesn't notify you in time.

Topic: DecisionPoint Trading Room
Start Time: Feb 22, 2022 09:00 AM
Meeting Recording Link.
Access Passcode: Feb#22nd
For best results, copy and paste the access code to avoid typos.
Welcome to DecisionPoint Daily Diamonds, wherein I highlight ten "Diamonds in the Rough" per week. These are selected from the results of my DecisionPoint Scans, which search for stocks that could benefit from the trend and condition of the market. Remember, these are not recommendations to buy or sell, but are the most interesting of the stocks that surfaced in my scans. My objective is to save you the work of the initial, tedious culling process, but you need to apply your own analysis to see if these stocks pique your interest as well. There are no guaranteed winners here!
"Predefined Scans Triggered" are taken from StockCharts.com using the "Symbol Summary" option instead of a "SharpChart" on the workbench.
B&G Foods Inc. (BGS)
EARNINGS: 3/1/2022 (AMC)
B&G Foods, Inc.is a holding company, which engages in the manufacture, sale, and distribution of shelf-stable frozen food, and household products in the U.S., Canada, and Puerto Rico. Its products include frozen and canned vegetables, hot cereals, fruit spreads, canned meats and beans, bagel chips, spices, seasonings, hot sauces, and wine vinegar. Its brands include Back to Nature, Bear Creek, Cream of Wheat, Green Giant, Mrs. Dash, and Ortega. The company was founded in 1889 and is headquartered in Parsippany, NJ.
Predefined Scans Triggered: None.
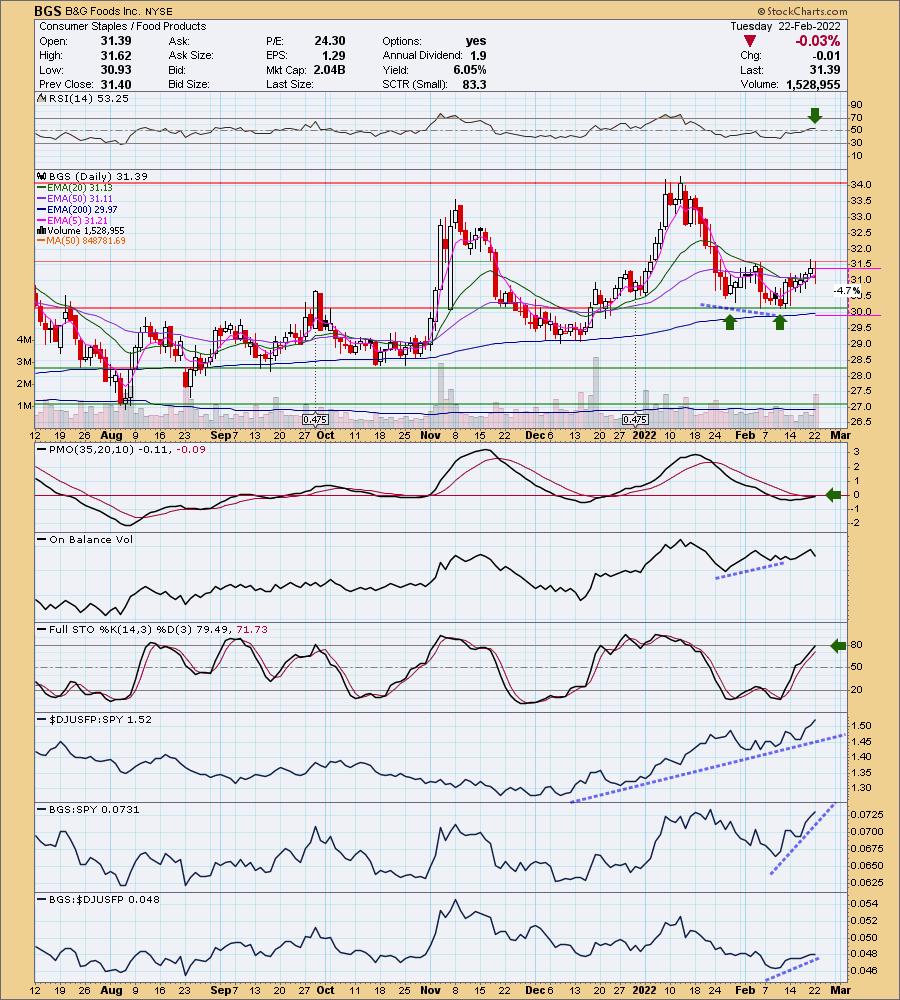
BGS is unchanged in after hours trading. I've covered BGS three times previously on April 21st 2021, September 21st 2021 and January 5th 2022. The first position is still open as the stop was never hit, but it is up only +2.9% currently. The second position is also still open and is up +4.2%. The last position is still open, but is down -2.5%.
Staples stocks tend to not be "sexy". They don't typically make big moves to the upside, but conversely they typically don't make big moves to the downside. When the market is troubled, Staples stocks tend to outperform. Price has formed an "Adam and Eve" double-bottom formation. The pattern hasn't been confirmed yet as it will need a breakout here. Today we had an IT Trend Model "Silver Cross" BUY signal as the 20-day EMA crossed above the 50-day EMA. There is a nice OBV positive divergence that led into this current rally. The RSI is positive and the PMO is about to trigger a crossover BUY signal. Stochastics are rising and should move above 80 tomorrow. Relative performance has been strong, particularly for the industry group. A rising tide lifts all boats they say and BGS is proof given its strong performance against the SPY. I'd like better performance against the group, but when the group is doing this week and the stock is still doing well against the SPY, it's fine. The stop is thin and rests below the 200-day EMA.
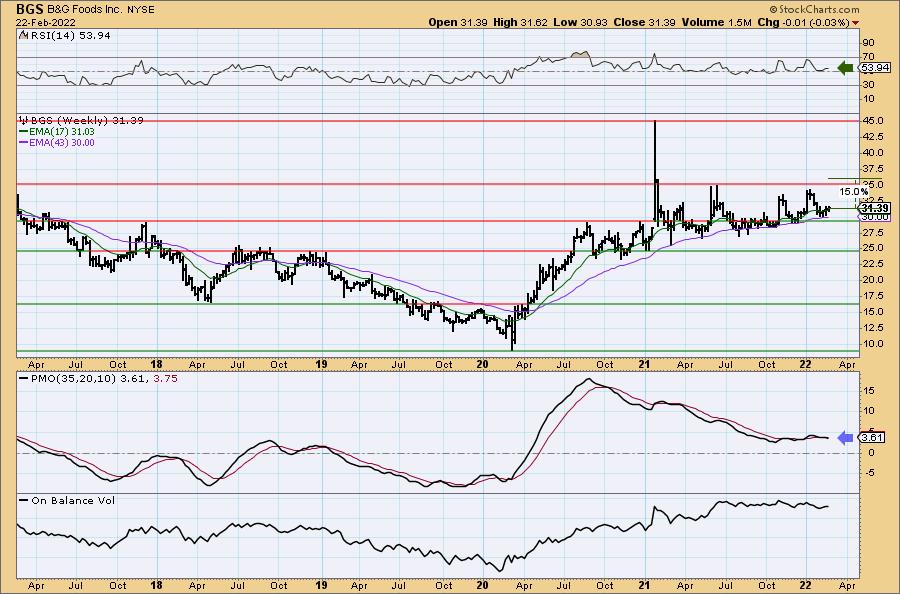
Price is rising along the 43-week EMA. The weekly RSI is positive. The weekly PMO isn't great as it is on a crossover SELL signal. However, the margin is thin between the PMO and its signal line, so we could see a positive crossover on the weekly PMO sooner rather than later. I set the upside target at the 2021 closing high.
Coca Cola Co. (KO)
EARNINGS: 4/19/2022 (BMO)
The Coca-Cola Co. is the nonalcoholic beverage company, which engages in the manufacture, market, and sale of non-alcoholic beverages which include sparkling soft drinks, water, enhanced water and sports drinks, juice, dairy and plant-based beverages, tea and coffee and energy drinks. Its brands include Coca-Cola, Diet Coke, Coca-Cola Zero, Fanta, Sprite, Minute Maid, Georgia, Powerade, Del Valle, Schweppes, Aquarius, Minute Maid Pulpy, Dasani, Simply, Glaceau Vitaminwater, Bonaqua, Gold Peak, Fuze Tea, Glaceau Smartwater, and Ice Dew. It operates through the following segments: Europe, Middle East and Africa, Latin America, North America, Asia Pacific, Bottling Investments and Global Ventures. The company was founded by Asa Griggs Candler in 1886 and is headquartered in Atlanta, GA.
Predefined Scans Triggered: P&F Double Top Breakout and P&F Triple Top Breakout.
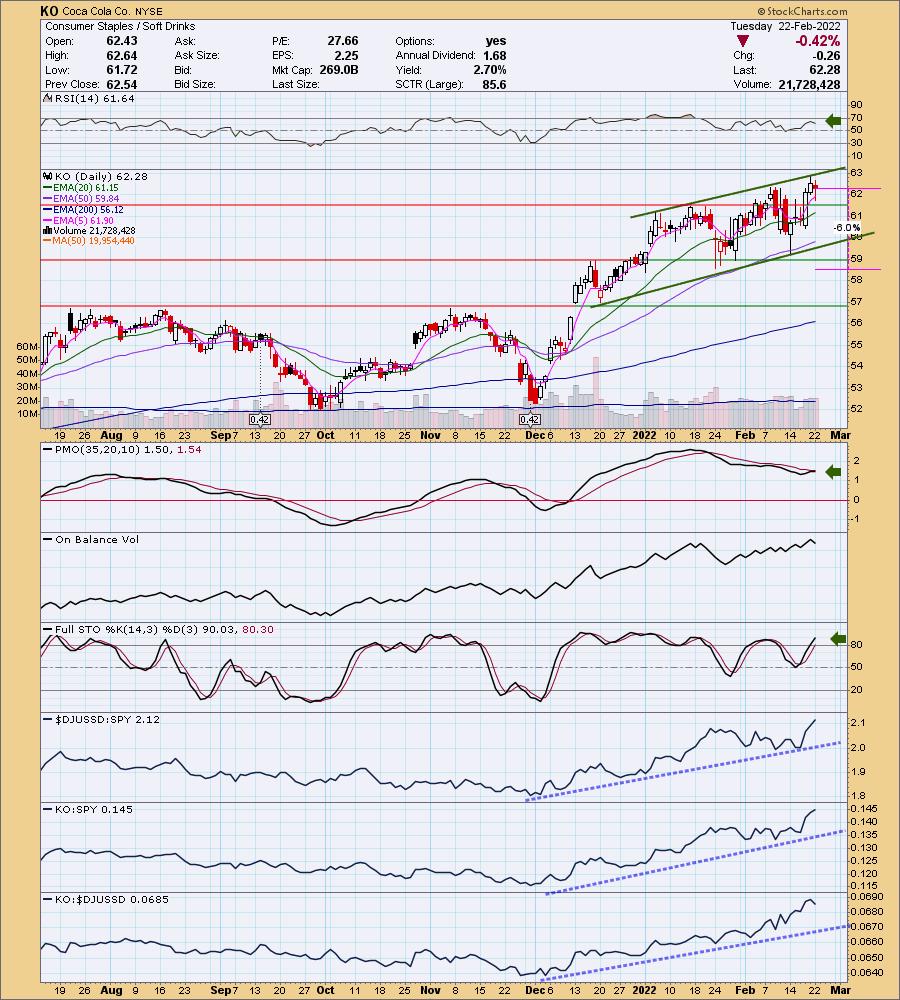
KO is unchanged in after hours trading. I covered KO on May 26th 2020. The position is still open and is up +35.1%. KO is in a solid rising trend channel. The RSI is positive and the PMO is nearing a crossover BUY signal. Stochastics are above 80 and rising meaning there is internal strength. The Soft Drinks group has been doing very well and clearly KO leads the way for the group. Notice that its relative performance line against the SPY is nearly identical to the group's relative strength line. The one problem that may need to be dealt with is that it is at the top of the rising trend channel, so it may require another trip down to test the bottom of it before moving higher. The stop is set below support at the December high; however, if it loses the 50-day EMA, I probably wouldn't stick around too long.
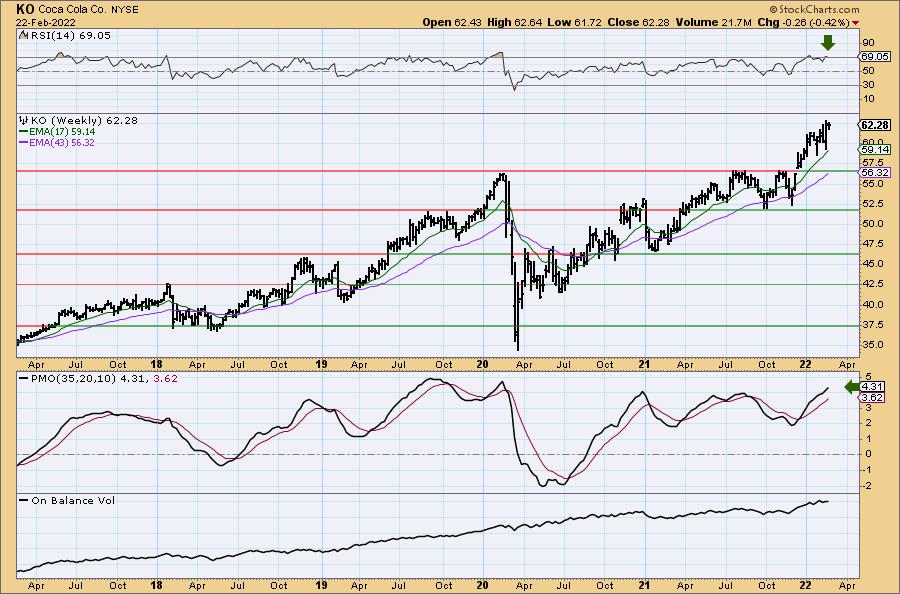
The weekly chart looks very good as it continues to make new all-time highs. The weekly RSI is a bit overbought, but not exceedingly so. The weekly PMO is strongly rising, but is getting overbought. Since it is at all-time highs, you could set an upside target around 14% or $71.
Post Holdings, Inc. (POST)
EARNINGS: 5/5/2022 (AMC)
Post Holdings, Inc. operates as a consumer packaged goods holding company. The firm engages in the operation of center-of-the-store, refrigerated, food service, food ingredient, active nutrition, and private brand food categories. It operates through the following segments: Post Consumer Brands, Weetabix, Foodservice, Refrigerated Retail and BellRing Brands. The Post Consumer Brands segment manufactures, markets, and sells branded and private label ready-to-eat (RTE) cereal and hot cereal products. The Weetabix segment focuses on the marketing and distribution of branded and private label RTE cereal products. The Foodservice segment includes egg and potato products. The Refrigerated Retail segment produces and/or distributes egg products, sausage, side dishes, cheese, and other refrigerated products to retail and foodservice customers. The BellRing Brands segment consists of ready-to-drink (RTD) protein shakes, other RTD beverages, powders, and nutrition bars. The company was founded by Charles William Post in 1895 and is headquartered in St. Louis, MO.
Predefined Scans Triggered: None.
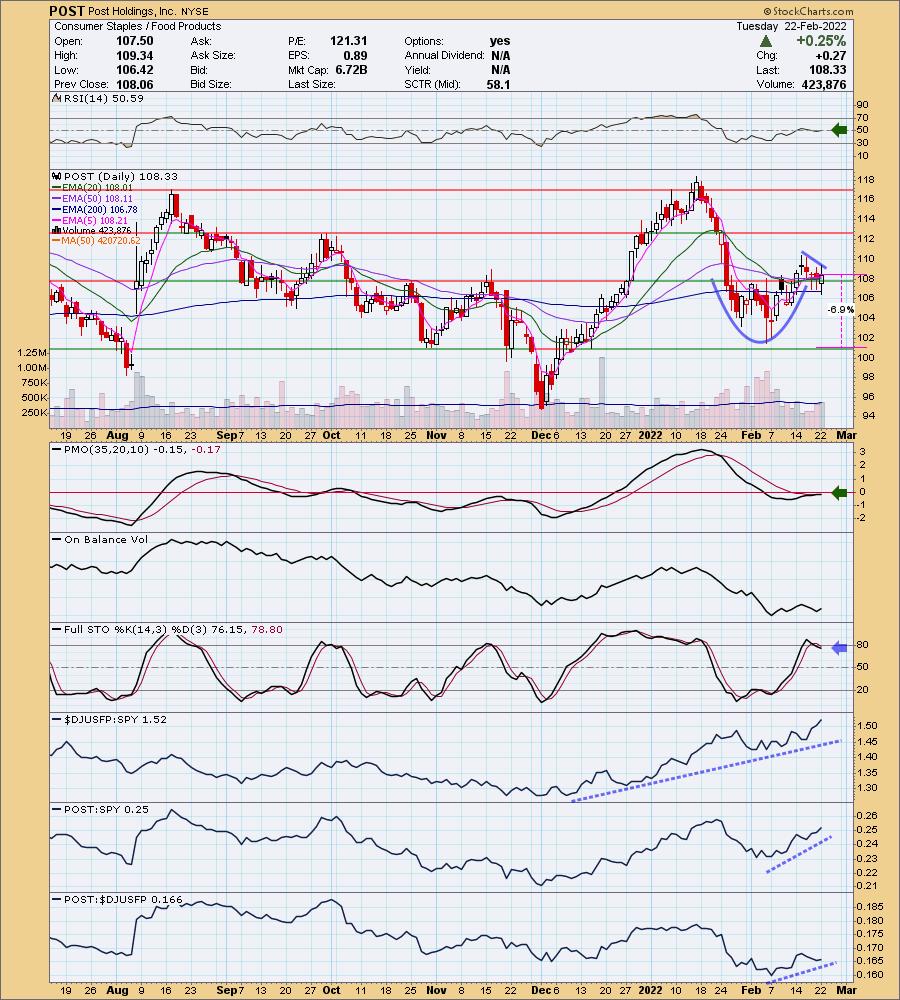
POST is unchanged in after hours trading. We have a beautiful bullish cup with handle chart pattern. The expectation is a breakout above the prior high which in this case is at $118. The RSI just moved back into positive territory. The PMO just triggered a crossover BUY signal. POST is outperforming the SPY and doing slightly better than the group as a whole. Stochastics have dropped below 80 which could be a problem, but I expect the pattern to execute with a breakout soon. The stop is set beneath the cup.
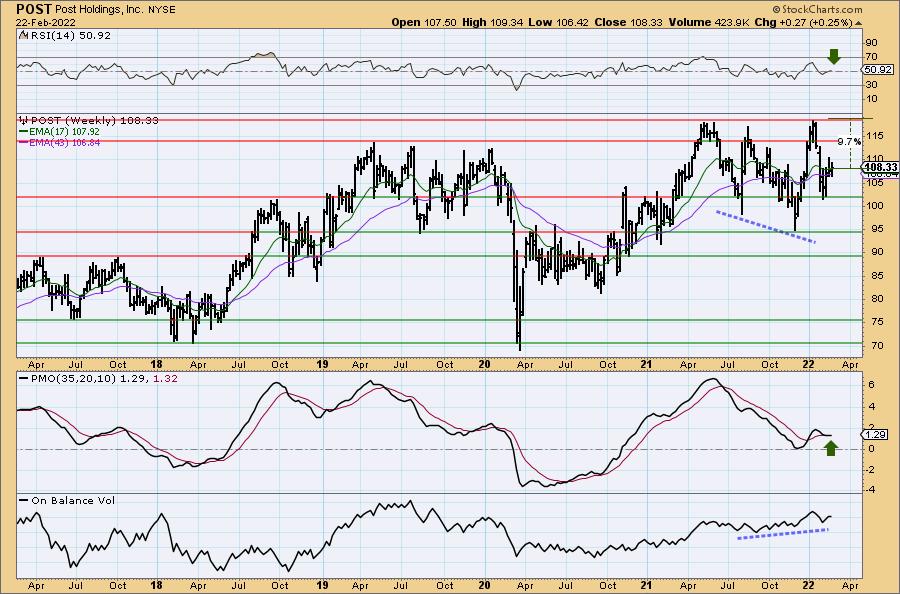
The weekly RSI is positive and the weekly PMO is about to trigger a whipsaw crossover BUY signal. POST is about 9.7% away from its all-time highs. I believe we'll see the breakout so consider an upside target around 14% at $123.50.
ProAssurance Corp. (PRA)
EARNINGS: 2/21/2022 (AMC) ** Reported Yesterday **
ProAssurance Corp. is a holding company. It operates through the following segments: Specialty Property and Casualty, Workers' Compensation Insurance, Lloyd's Syndicate, Segregated Portfolio Cell Reinsurance and Corporate. The Specialty Property and Casualty segment includes professional liability business and medical technology and life sciences business. The Workers' Compensation Insurance segment includes the workers' compensation business which the company provides for employers, groups and associations. The Lloyd's Syndicate segment includes operating results from participation in Lloyd's Syndicate 1729. The Segregated Portfolio Cell Reinsurance segment assumes workers' compensation insurance, healthcare professional liability insurance or a combination of the two from Workers' Compensation Insurance and Specialty Property & Casualty segments. The Corporate segment includes investing operations managed at the corporate level, non-premium revenues generated outside of insurance entities, and corporate expenses, including interest and U.S. income taxes. The company was founded in 1976 and is headquartered in Birmingham, AL.
Predefined Scans Triggered: Moved Above Upper Bollinger Band, Moved Above Ichimoku Cloud and Parabolic SAR Buy Signals.
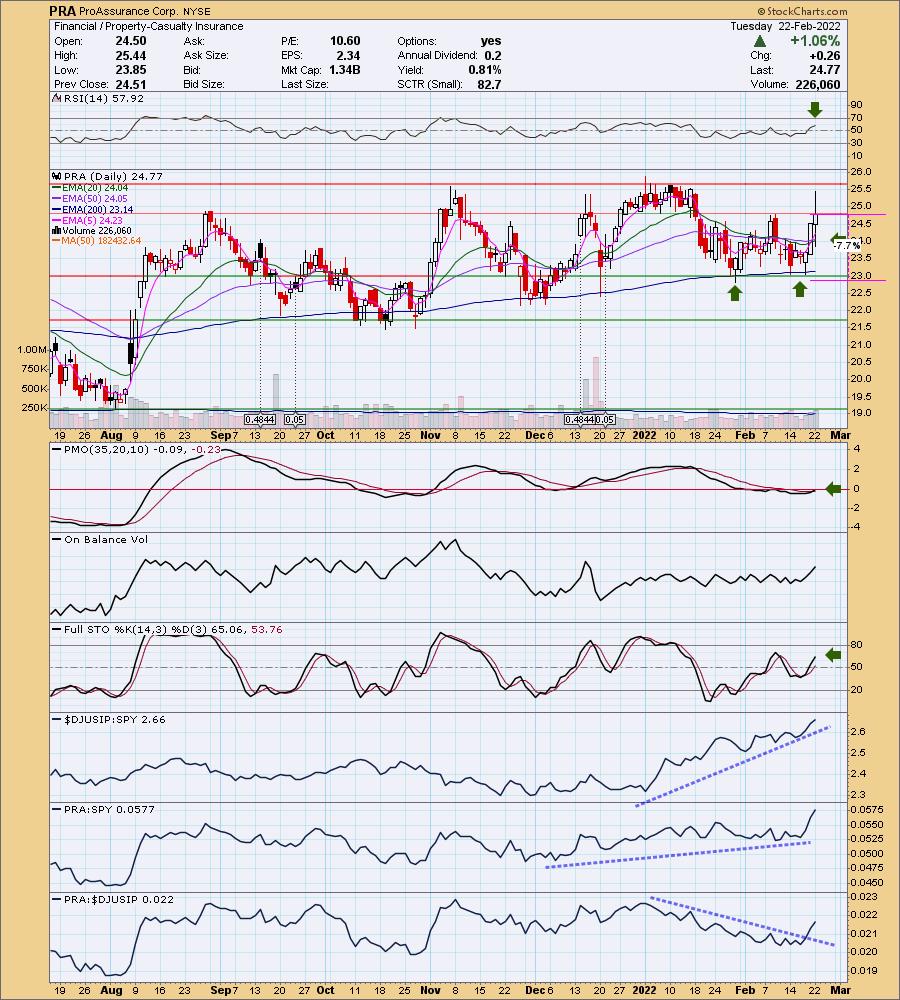
PRA is unchanged in after hours trading. I spot a short-term double-bottom that formed off the January decline. The pattern hasn't been confirmed just yet since we don't have a close above the confirmation line. However, it did breakout intraday. The RSI is positive and rising. The PMO just triggered a crossover BUY signal and should reach above the zero line soon. Relative strength is strong for this stock and it sits in a group that is definitely outperforming. PRA hasn't been strong within the group, but it broke its relative decline and is beginning to outperform the group. Stochastics are rising and should reach above 80 soon. The stop is set below the double-bottom pattern and the 200-day EMA.
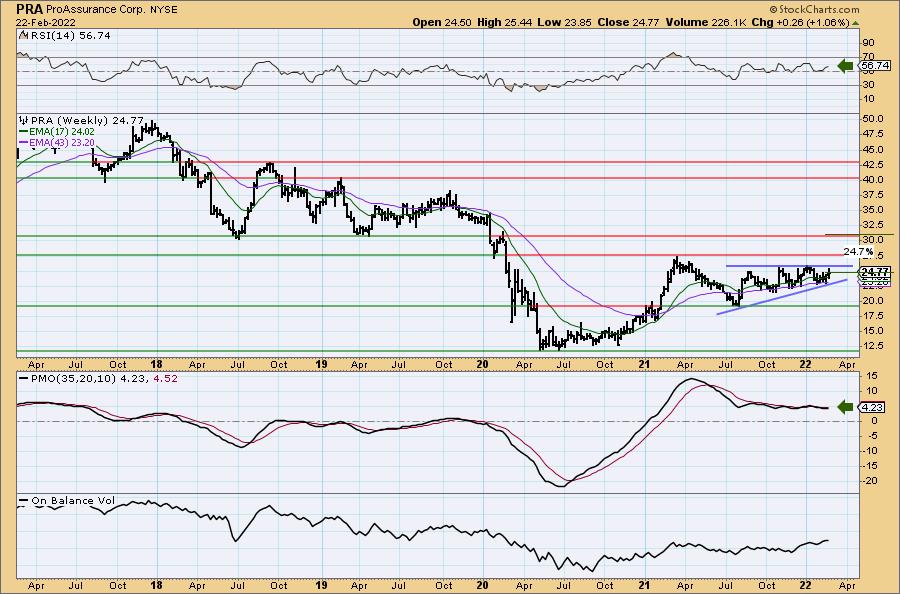
There is a bullish ascending triangle on the weekly chart (flat top, rising bottoms). The expectation is an upside breakout. The weekly RSI is positive. The weekly PMO is indecisive right now, but should see a crossover BUY signal soon.
Don't forget, on Thursdays I look at reader-requested symbols, click HERE to shoot me an email. I read every email I receive and try to answer them all!
Current Market Outlook:
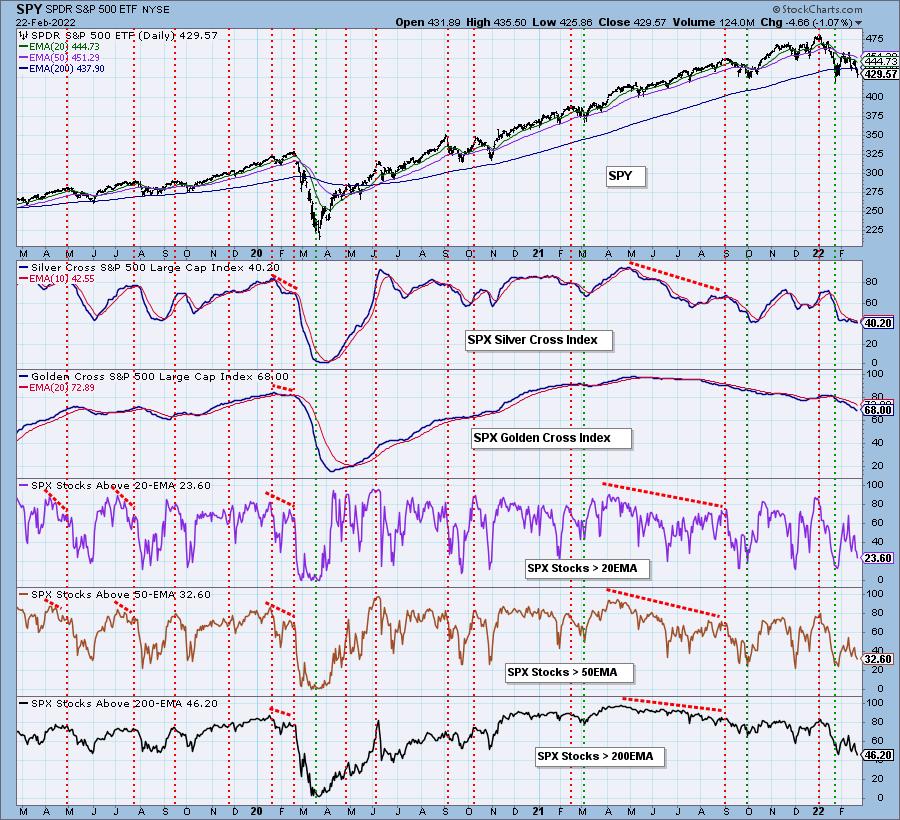
Market Environment: It is important to consider the odds for success by assessing the market tides. The following chart uses different methodologies for objectively showing the depth and trend of participation for intermediate- and long-term time frames.
- The Silver Cross Index (SCI) shows the percentage of SPX stocks on IT Trend Model BUY signals (20-EMA > 50-EMA)
- The Golden Cross Index (GCI) shows the percentage of SPX stocks on LT Trend Model BUY signals (50-EMA > 200-EMA)
Don't forget that as a "Diamonds" member, you have access to our GCI/SCI curated ChartList on DecisionPoint.com. You'll find it under "Members Only" links on the left side on the Blogs and Links Page.
Here is the current chart:
Full Disclosure: I'm 8% invested and 92% is in 'cash', meaning in money markets and readily available to trade with.
I'm required to disclose if I currently own a stock and/or may buy it within the next 72 hours.
Good Luck and Good Trading!
- Erin
"Technical Analysis is a windsock, not a crystal ball." - Carl Swenlin
(c) Copyright 2022 DecisionPoint.com
Watch the latest episode of DecisionPoint with Carl & Erin Swenlin on Mondays 7:00p EST or on the DecisionPoint playlist on the StockCharts TV YouTube channel here!
NOTE: The stocks reported herein are from mechanical trading model scans that are based upon moving average relationships, momentum and volume. DecisionPoint analysis is then applied to get five selections from the scans. The selections given should prompt readers to do a chart review using their own analysis process. This letter is not a call for a specific action to buy, sell or short any of the stocks provided. There are NO sure things or guaranteed returns on the daily selection of "Diamonds in the Rough."
Helpful DecisionPoint Links:
DecisionPoint Shared ChartList and DecisionPoint Chart Gallery
Price Momentum Oscillator (PMO)
Swenlin Trading Oscillators (STO-B and STO-V)
For more links, go to DecisionPoint.com