
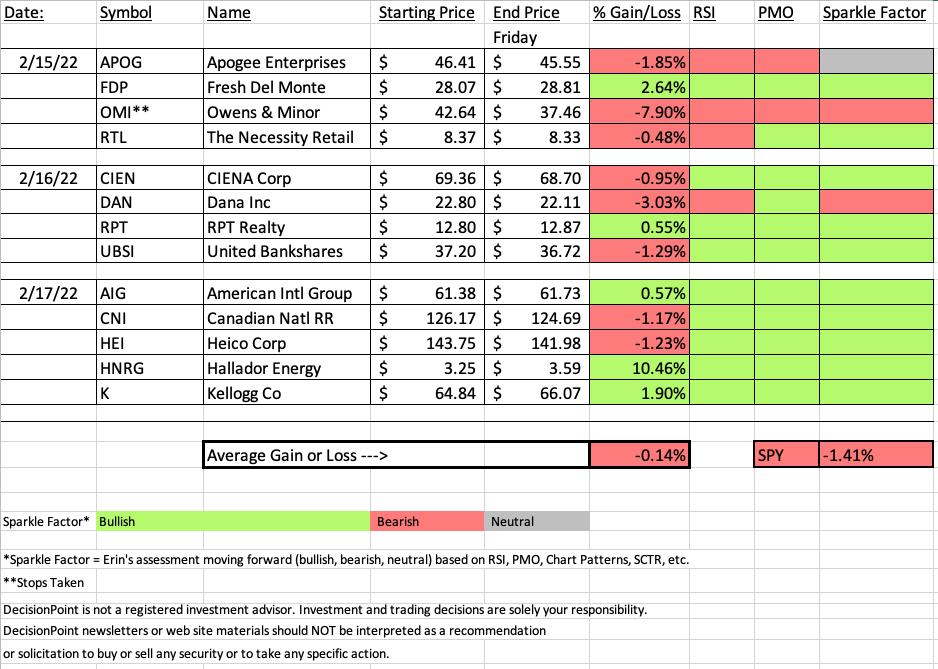
"Diamonds in the Rough" were down slightly on the week while the SPY finished down -1.41% for the week. Winning positions came in Consumer Staples, Real Estate and Coal.
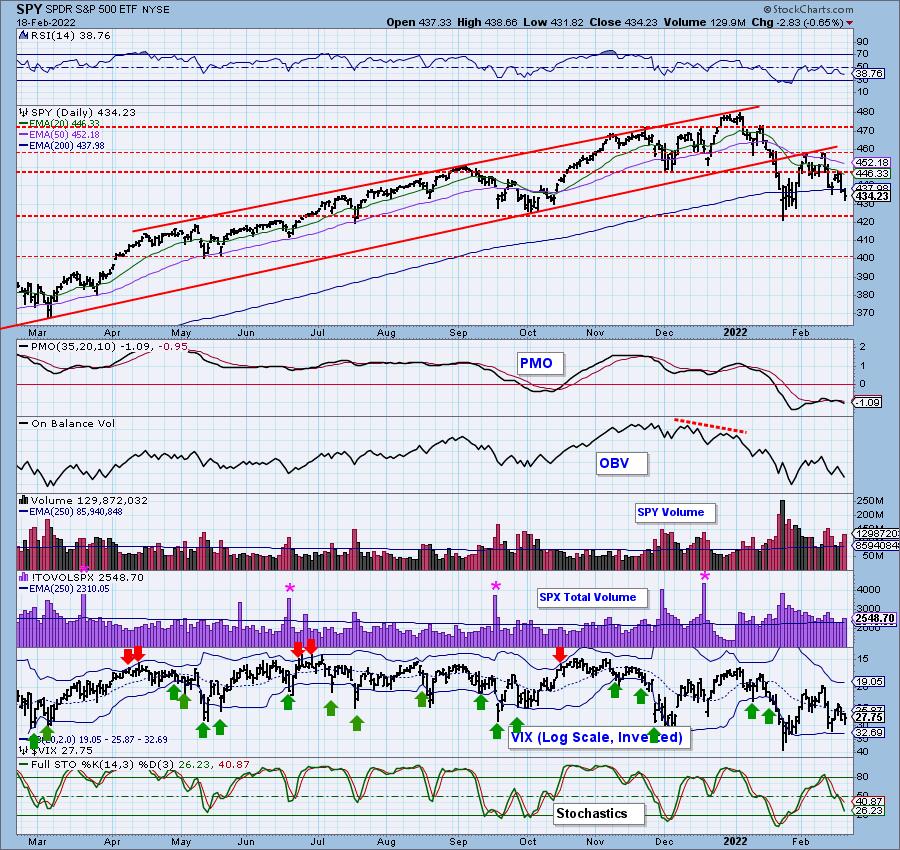
Geopolitical unrest combined with inflation are weighing heavy on the market. Looking at the one-year daily chart of the SPY we can see the damage that was done with today's decline. The 200-EMA was breached and price traded below it the majority of the day. The indicators are very sickly. Keep this in mind as I present "Diamonds in the Rough" or when you see a "green" Sparkle Factor. Just because I present them or see them as a possible hold, it doesn't mean they will be immune to the bear market that is beginning right now.
I ran scans today and there were no discernible themes except to say they returned very few results. I do believe I have a good "Sector to Watch" this week as well as industry groups that I would concentrate on going into Tuesday.
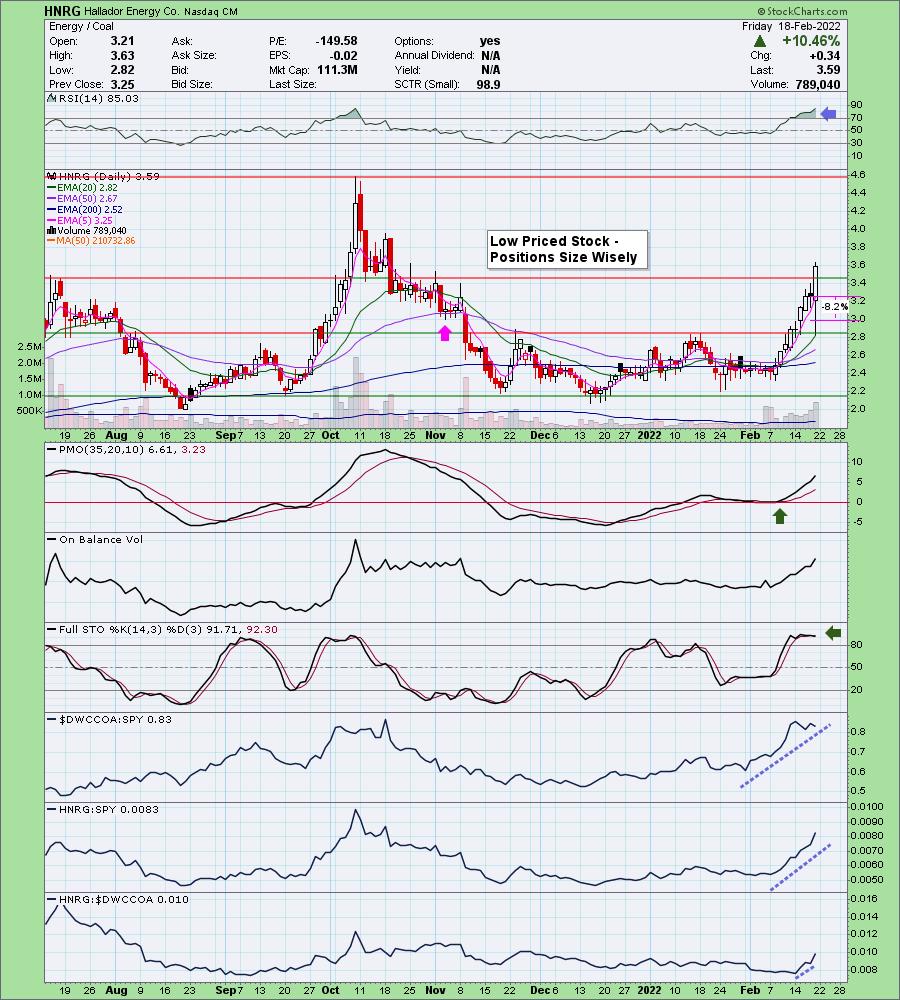
Today's "Darling" was a stock we picked yesterday, Hallador Energy (HNRG). It was low-priced and actually went below the 8.2% stop level intraday, but finished the day up over 10%. This is why you should position size wisely on these volatile low-priced stocks.
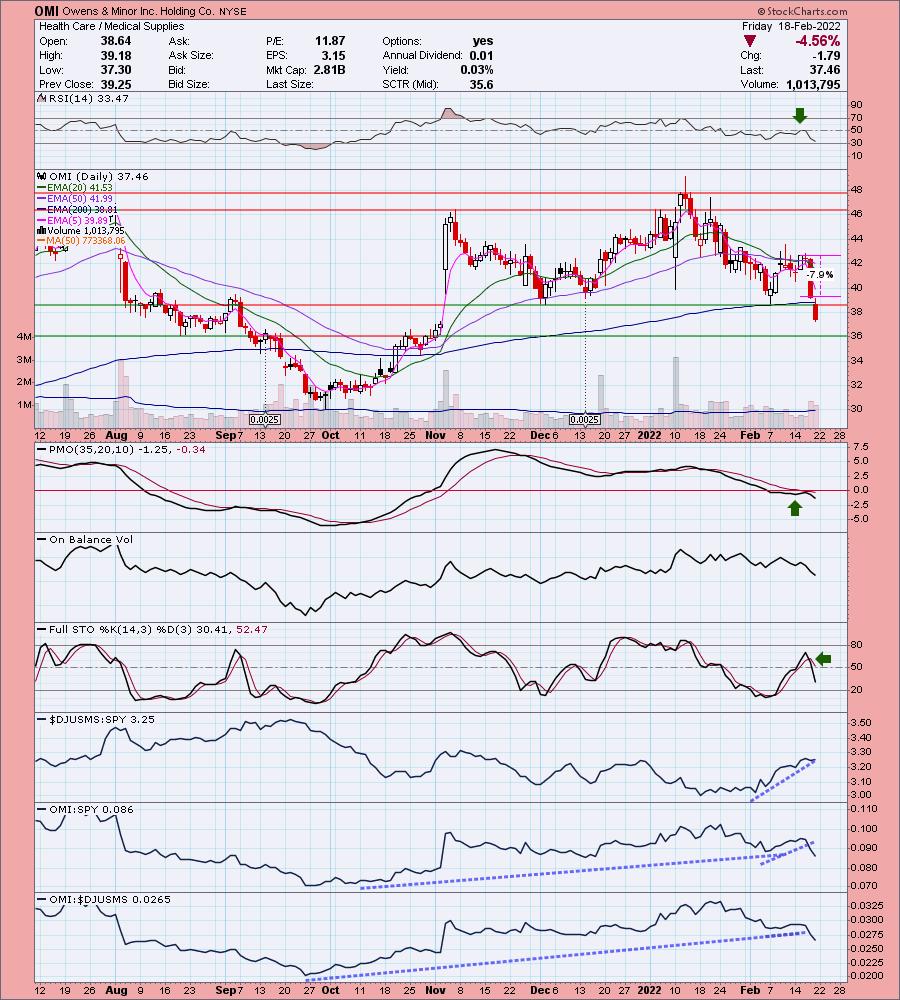
The "Dud" was Owens & Minor (OMI) that was stopped out yesterday. The chart went south very quickly.
The recording link for to today's Diamond Mine trading room is below and will be in every DP Diamonds report as is the registration link for next week's.
The free DecisionPoint Trading Room will be on TUESDAY, not MONDAY since it is a holiday.
Have a great holiday weekend!
Erin

RECORDING LINK (2/18/2022):
Topic: DecisionPoint Diamond Mine (2/18/2022) LIVE Trading Room
Start Time: Feb 18, 2022 09:00 AM
Meeting Recording Link.
Access Passcode: February#18
REGISTRATION FOR Friday 2/25 Diamond Mine:
When: Feb 25, 2022 09:00 AM Pacific Time (US and Canada)
Topic: DecisionPoint Diamond Mine (2/25/2022) LIVE Trading Room
Register in advance for this webinar HERE.
Save the registration confirmation email with login instructions in case Zoom doesn't notify you in time.

Free DP Trading Room (2/7) RECORDING LINK:
Topic: DecisionPoint Trading Room
Start Time: Feb 14, 2022 09:00 AM
Meeting Recording Link.
Access Passcode: Valentine#14
For best results, copy and paste the access code to avoid typos.
A few items about the spreadsheet: I've put on the spreadsheet whether the RSI is positive (green) or negative (red). The PMO column tells you if it is rising (green) or falling (red). Finally I've added my own "Sparkle Factor" that gives you my assessment going forward, bullish (green), bearish (red) or neutral (gray). The Sparkle Factor is basically my thoughts on whether I expect it to rise or fall. A neutral means it could really go either way so it could be added to a watch list. If you're in a stock I consider "neutral" going forward, the ball is in your court.
Darling:
Hallador Energy Co. (HNRG)
EARNINGS: 3/7/2022 (AMC)
Hallador Energy Co. engages in business through its subsidiary, Sunrise Coal, LLC, which produces coal in the Illinois Basin for the electric power generation industry. It also owns summit terminal, a transport facility on the Ohio River. The company was founded by David C. Hardie in 1951 and is headquartered in Terre Haute, IN.
Predefined Scans Triggered: None.
Here are the commentary and chart from Tuesday (2/15):
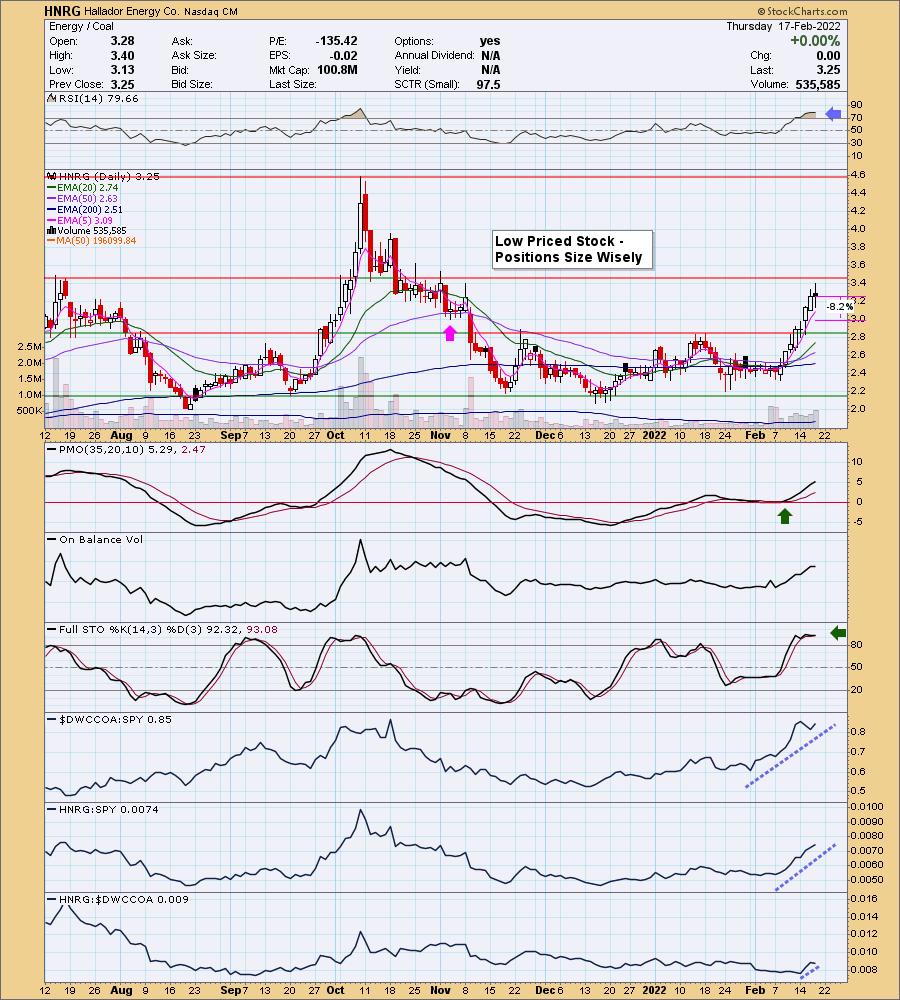
"HNRG is down heavily -2.77% in after hours trading. Given the filled black candlestick, we could see that stick tomorrow. Price is up against overhead resistance at the late July high. Given it is so low-priced, I wouldn't consider buying this without using a 5-minute candlestick chart tomorrow. The other coal company requested was ARCH. I like Coal; it's certainly been outperforming. It may need to cool somewhat given the RSI is so overbought. However, I like the PMO configuration and Stochastics are suggesting internal strength. The stop is set at the early November low. I didn't want to set it much deeper."
Here is today's chart:
Crazy market action on this one. Today's breakout is excellent as it takes it above July overhead resistance. I think there is a high probability that this one will test its October high. However, if you're going to get involved with it, be ready for a very volatile ride.
Don't forget, on Thursdays I look at reader-requested symbols, so shoot me an email at erin@decisionpoint.com. I read every email I receive and try to answer them all!
Dud:
Owens & Minor Inc. Holding Co. (OMI)
EARNINGS: 2/23/2022 (BMO)
Owens & Minor, Inc. engages in the provision of healthcare solutions. It operates through the Global Solutions and Global Products segments. The Global Solutions segment consists of the United States distribution, outsourced logistics, and value-added services businesses. The Global Products segment manufactures and sources medical surgical products through production and kitting operations. The company was founded by Otho O. Owens and G. Gilmer Minor in 1882 and is headquartered in Mechanicsville, VA.
Predefined Scans Triggered: Bullish MACD Crossovers, Elder Bar Turned Green and P&F Low Pole.
Below are the commentary and chart from yesterday (2/17):
"OMI is down -0.09% in after hours trading. I covered OMI not that long ago on December 21st 2021 (stop was hit on the January slide..barely). I like the bounce off the 200-day EMA and the December low and near August/September tops. Price broke above the 20/50-EMAs. This should trigger a "Silver Cross" BUY signal as the 20/50-day EMAs have a positive crossover. The RSI just hit positive territory. The PMO has turned up. Stochastics are rising in positive territory. Over time, OMI has been a good relative performer. The group hasn't reached relative strength highs, so I believe it has a great chance of rallying back to the January high. The stop is set below closing lows from earlier this month."
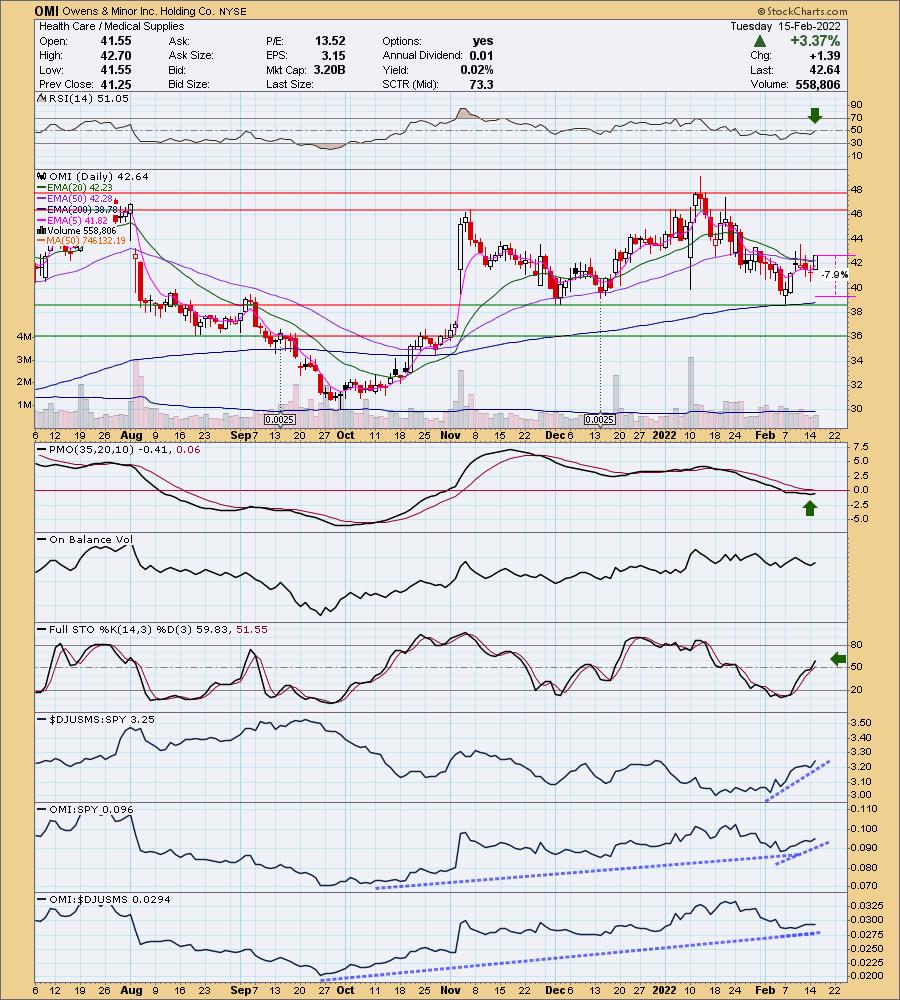
Below is today's chart:
This one never fulfilled its promises based on the indicators. They report next week and with the chart looking this ugly I would not be bottom feeding here. Today price traded below the 200-day EMA and closed near its lows. It's a spectacular breakdown. Support is near but with this much negative momentum, it will difficult for price to hold it.
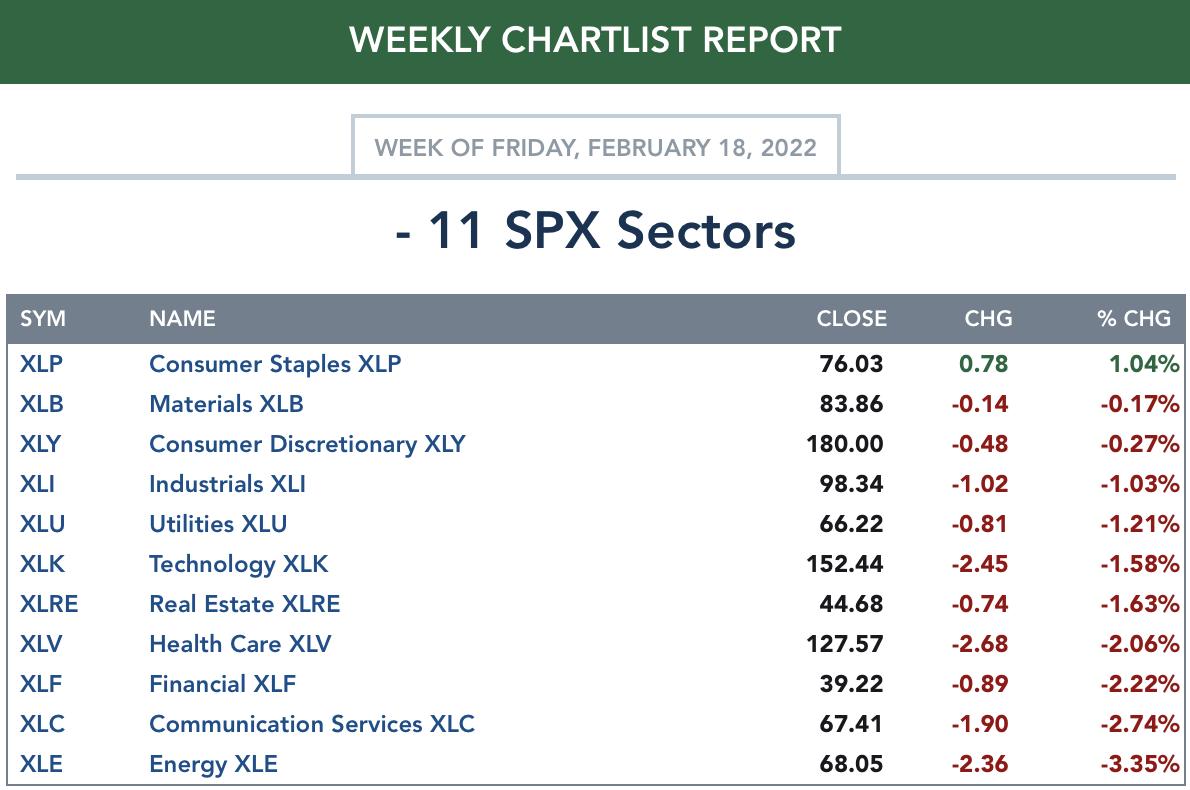
TODAY'S Sector Performance:
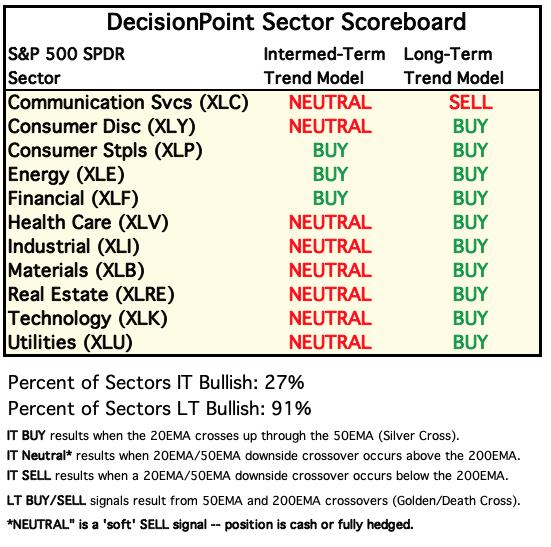
DecisionPoint Sector Scoreboard (Mechanical Trend Model Signals):
Click Hereto view Carl's annotated Sector ChartList!
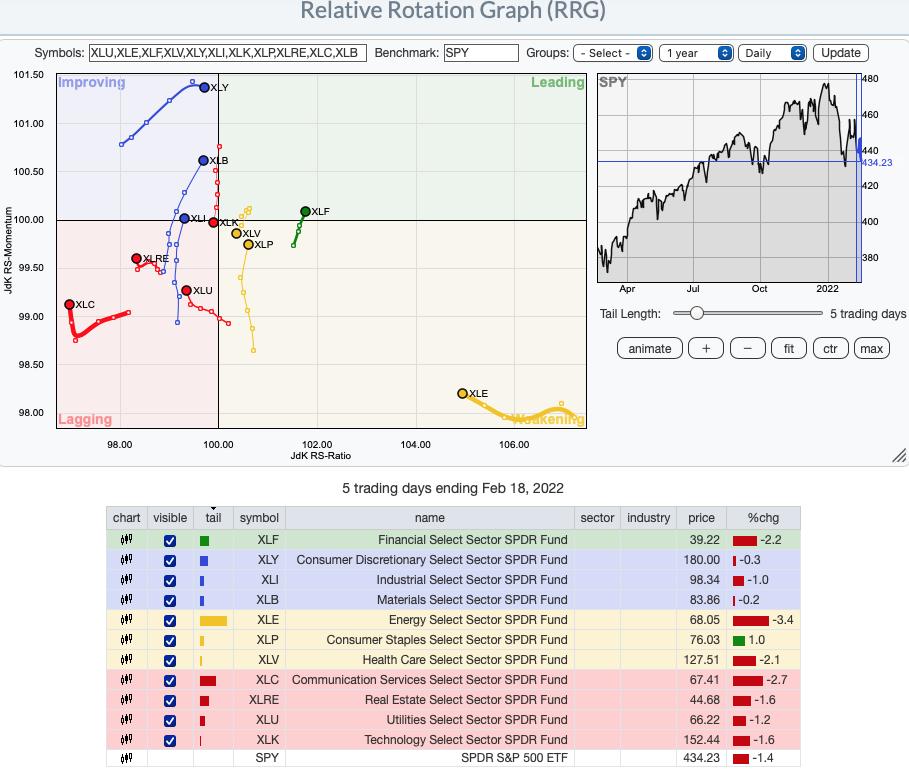
Short-term (Daily) RRG: Short term, the strongest sectors on the RRG are XLF, XLB, XLI and XLP. All four are moving in the bullish northeast direction and none reside in Lagging. XLK entered Lagging today and while XLC, XLU and XLRE are at least traveling northward, they are still in Lagging. XLV has a bearish southwest heading and could enter Lagging very soon. XLE is mostly neutral. We know it is experiencing a pause that could result in a pullback. When it begins to move northeast, I would then want to nibble. XLY could enter Leading soon, but relative strength is already fading as it moves southeast now.
Intermediate-Term (Weekly) RRG: We determined the XLB, XLI, XLF, XLV and XLP looked the strongest on the short-term RRG with all traveling in the bullish northeast direction. Intermediate term, XLE and XLP look the strongest. The weakest are clearly XLK and XLY. XLU is neutral to bullish as it resides in Leading, but is swinging southward. XLRE is Leading, but it has a bearish southwest heading so we should be careful there. XLC looks somewhat enticing on the IT RRG given it has a bullish northeast heading and is in Improving. However, I still do not favor bottom fishing in that sector.
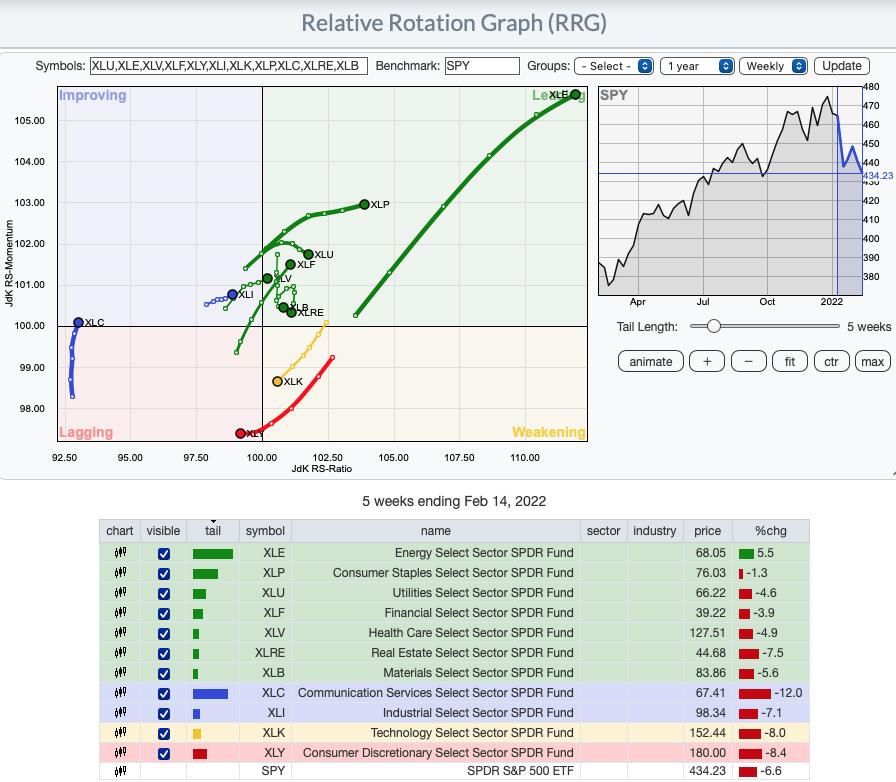
RRG® charts show you the relative strength and momentum for a group of stocks. Stocks with strong relative strength and momentum appear in the green Leading quadrant. As relative momentum fades, they typically move into the yellow Weakening quadrant. If relative strength then fades, they move into the red Lagging quadrant. Finally, when momentum starts to pick up again, they shift into the blue Improving quadrant.
CLICK HERE for an animated version of the RRG charts.
Sector to Watch: Consumer Staples (XLP)
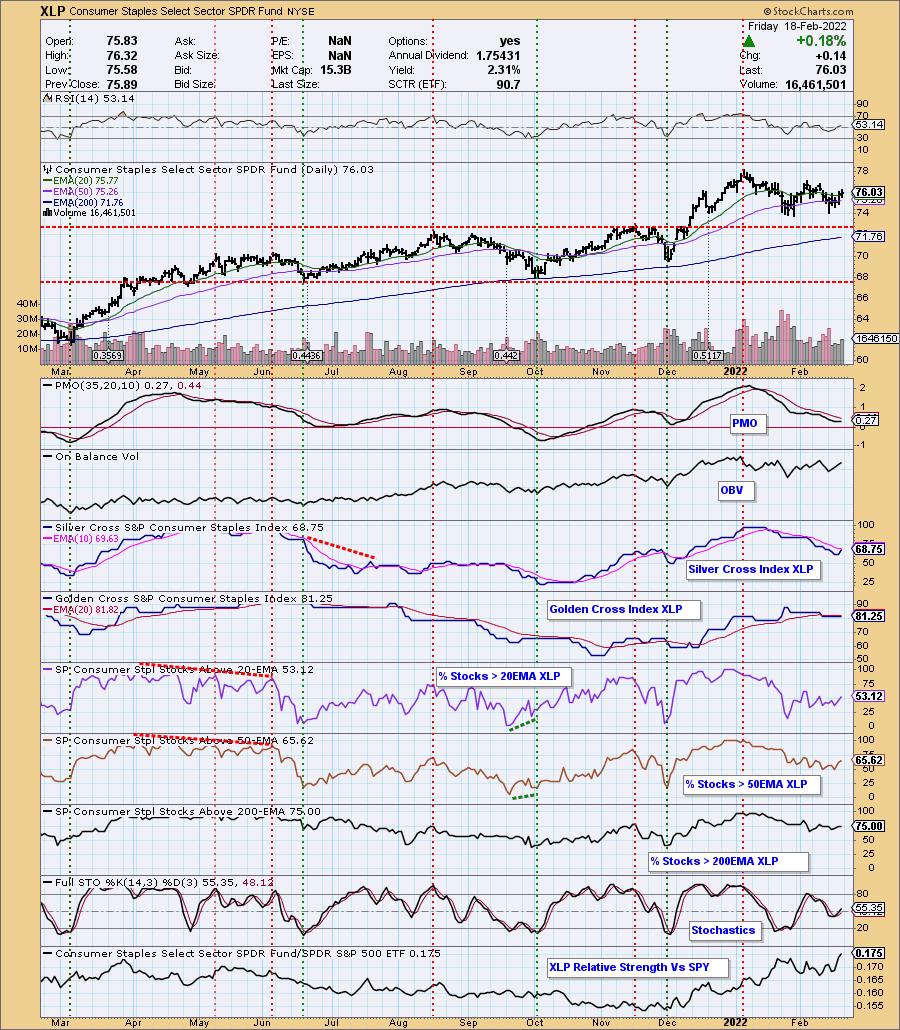
Today's sector to watch was a slam dunk. XLP is the only sector showing positive momentum. The only sector with Stochastics rising (with the exception of XLU) and one of the few sectors with an SCI rising. It still isn't the healthiest of charts, but there are certainly areas that are improving. While %Stocks > 20/50-EMAs are still below the SCI, that participation is showing improvement. We have a bullish short-term double-bottom price pattern developing as well.
Industry Group to Watch: US Nondurable Household Products ($DJUSHN)
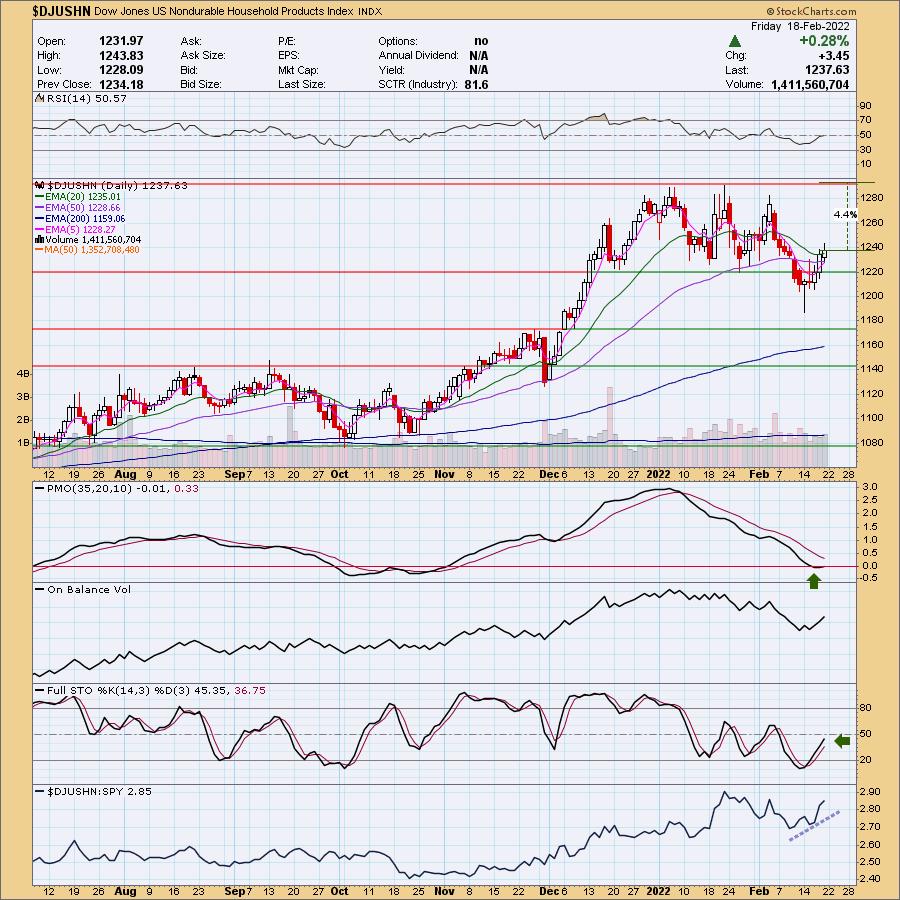
Honestly there three groups inside Staples that I like: Soft Drinks, Tobacco and Nondurable Household Products. I picked NHP over Soft Drinks because it had the best upside potential (4.4% v. 2.6%). Tobacco has been running hot for some time and while there is likely more upside to be had, I have to wonder how and when it might end. Price closed above the 20/50-day EMAs which has prevented a "dark cross" of the 20/50-day EMAs (opposite of a "silver cross"). The RSI just hit positive territory and Stochastics are rising. Relative strength definitely picked up this week. Stocks to consider in the three industry groups I mentioned? REYN in this group. KO in Soft Drinks. This week's Tobacco stock, UVV.
Go to our Sector ChartList on DecisionPoint.com to get an in depth view of all the sectors.
Have a great weekend! The next Diamonds Report is TUESDAY 2/15.
Don't forget the free DecisionPoint Trading Room will be on TUESDAY not Monday.
- Erin
erin@decisionpoint.com
Full Disclosure: I'm about 8% exposed to the market.
Watch the latest episode of DecisionPoint with Carl & Erin Swenlin on Mondays 7:00p EST or on the DecisionPoint playlist on the StockCharts TV YouTube channel here!
Technical Analysis is a windsock, not a crystal ball. --Carl Swenlin
NOTE: The stocks reported herein are from mechanical trading model scans that are based upon moving average relationships, momentum and volume. DecisionPoint analysis is then applied to get five selections from the scans. The selections given should prompt readers to do a chart review using their own analysis process. This letter is not a call for a specific action to buy, sell or short any of the stocks provided. There are NO sure things or guaranteed returns on the daily selection of "diamonds in the rough."
Helpful DecisionPoint Links:
DecisionPoint Shared ChartList and DecisionPoint Chart Gallery
Price Momentum Oscillator (PMO)
Swenlin Trading Oscillators (STO-B and STO-V)
(c) Copyright 2021 DecisionPoint.comf