
One new item I've added to DP Diamonds is finding a common theme amongst my many scan results. Normally it is pretty clear where the interest and new momentum are, but it becomes very difficult if you don't have any scan results to look at.
Here is how slim the pickings are right now. I ran SIX scans and in total had only 18 results! Of those 18, I only liked seven. Of those 18 results, there was no discernible theme. The theme is stay out of the market given there are very few stocks with potential. Even yesterday's defensive Staples stocks struggled today.
Subscriber Fred sent me a list of agricultural ETFs for Reader Request Day tomorrow. I like his thinking. These ETFs should benefit from inflation and even geopolitical concerns. Here are four that I definitely like. I opted not to present these today, but likely will pick one tomorrow: WEAT, RJA, CORN and SOYB. I think these charts are worth a look, as are DBA and GSG.
Today's "Diamonds in the Rough": CHRW, CPB and LNG.
Stocks to Review (No order): KBR, ED, AVNS and GRFS.

RECORDING LINK (2/18/2022):
Topic: DecisionPoint Diamond Mine (2/18/2022) LIVE Trading Room
Start Time: Feb 18, 2022 09:00 AM
Meeting Recording Link.
Access Passcode: February#18
REGISTRATION FOR Friday 2/25 Diamond Mine:
When: Feb 25, 2022 09:00 AM Pacific Time (US and Canada)
Topic: DecisionPoint Diamond Mine (2/25/2022) LIVE Trading Room
Register in advance for this webinar HERE.
Save the registration confirmation email with login instructions in case Zoom doesn't notify you in time.

Topic: DecisionPoint Trading Room
Start Time: Feb 22, 2022 09:00 AM
Meeting Recording Link.
Access Passcode: Feb#22nd
For best results, copy and paste the access code to avoid typos.
Welcome to DecisionPoint Daily Diamonds, wherein I highlight ten "Diamonds in the Rough" per week. These are selected from the results of my DecisionPoint Scans, which search for stocks that could benefit from the trend and condition of the market. Remember, these are not recommendations to buy or sell, but are the most interesting of the stocks that surfaced in my scans. My objective is to save you the work of the initial, tedious culling process, but you need to apply your own analysis to see if these stocks pique your interest as well. There are no guaranteed winners here!
"Predefined Scans Triggered" are taken from StockCharts.com using the "Symbol Summary" option instead of a "SharpChart" on the workbench.
C.H. Robinson Worldwide, Inc. (CHRW)
EARNINGS: 4/26/2022 (BMO)
C.H. Robinson Worldwide, Inc. engages in the provision of freight transportation services and logistics solutions. It operates through the following three segments: North American Surface Transportation and Global Forwarding. The North American Surface Transportation segment provides freight transportation services across North America through a network of offices in the United States, Canada, and Mexico. The Global Forwarding segment provides global logistics services through an international network of offices in North America, Europe, Asia, Australia, New Zealand, and South America. The company was founded by Charles Henry Robinson in 1905 and is headquartered in Eden Prairie, MN.
Predefined Scans Triggered: None.
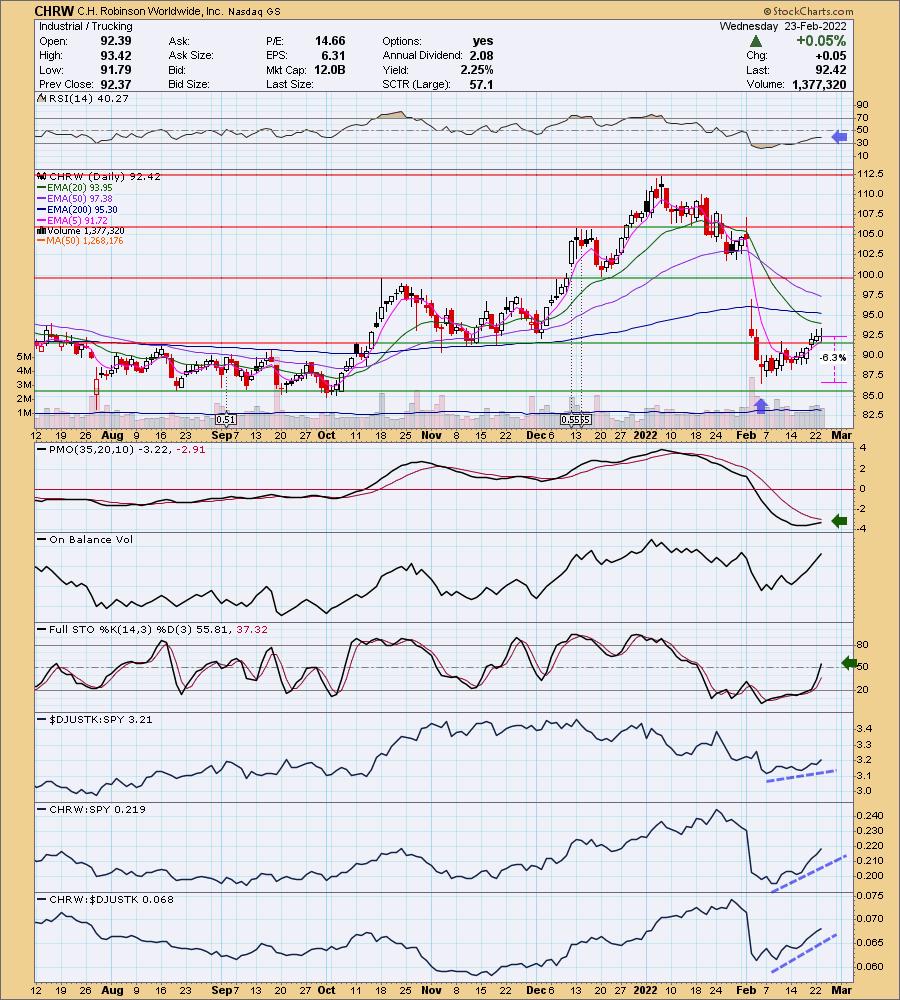
CHRW is unchanged in after hours trading. I covered CHRW twice before on February 19th 2020 (position stopped out in bear market decline) and March 19th 2020 (position was timed almost perfectly and is up +44.3%). I debated this one as I'm not sure how the Trucker demonstrations are effecting these companies. I'm looking purely at the technicals here. The chart isn't perfect, but as I said earlier, I didn't have too many choices.
Price gapped down on earnings which is a problem, along with the negative RSI. However, past that it is a favorable chart. Price has broken above resistance and is headed to test the 20-day EMA. Notice that price didn't have to test support at the September lows before rebounding. That's bullish. It certainly has some work today with key moving averages coming up as resistance. Indicators look pretty good and imply we should see price move higher. The PMO is rising and should trigger a crossover BUY signal soon. Stochastics just hit positive territory above net neutral (50). Relative strength for the group is improving. I liked CHRW's performance against both the SPY and the industry group. The stop can be set thinly at 6.3% below this month's low.
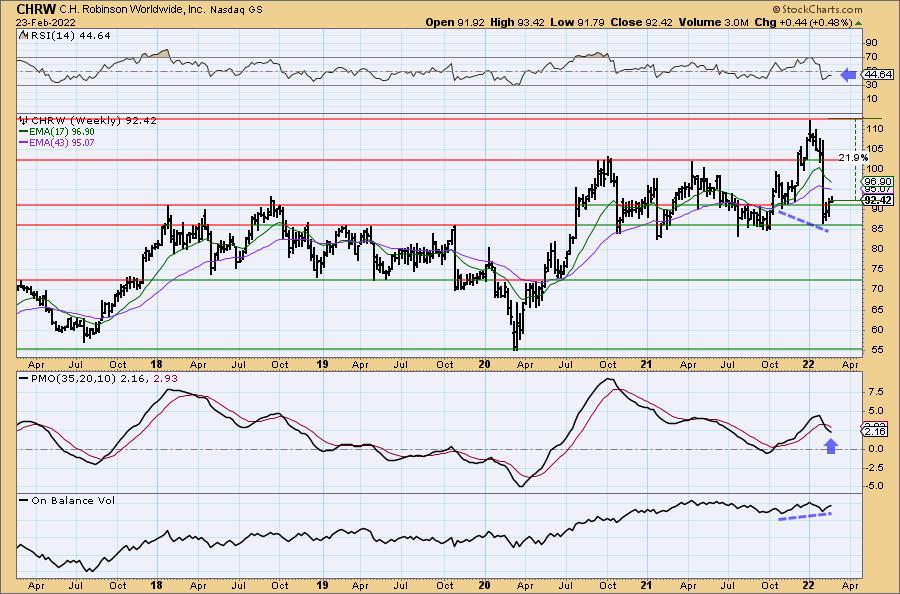
I like that price tested longer-term support and bounced on the weekly chart. There is a positive divergence between the weekly OBV and price lows. Those generally lead to extended rallies. The RSI and PMO don't look so good. Consider this a short-term investment to start. Of course Bear Market Rules tell us to consider all positions as short-term. Upside potential is almost 22% if it can challenge its all-time high.
Campbell Soup Co. (CPB)
EARNINGS: 3/9/2022 (BMO)
Campbell Soup Co. engages in manufacture and marketing of convenience food products such as soup, simple meals, snacks, and healthy beverages. It operates through the following segments: Meals and Beverages, and Snacks. The Meals and Beverages segment includes the retail and food service businesses in the U.S., Canada and Latin America. The Snacks segment offers Pepperidge Farm cookies, crackers, bakery and frozen products in U.S. retail, Arnott's biscuits in Australia and Asia Pacific, and Kelsen cookies globally. The company was founded on November 23, 1922, and is headquartered in Camden, NJ.
Predefined Scans Triggered: P&F High Pole.
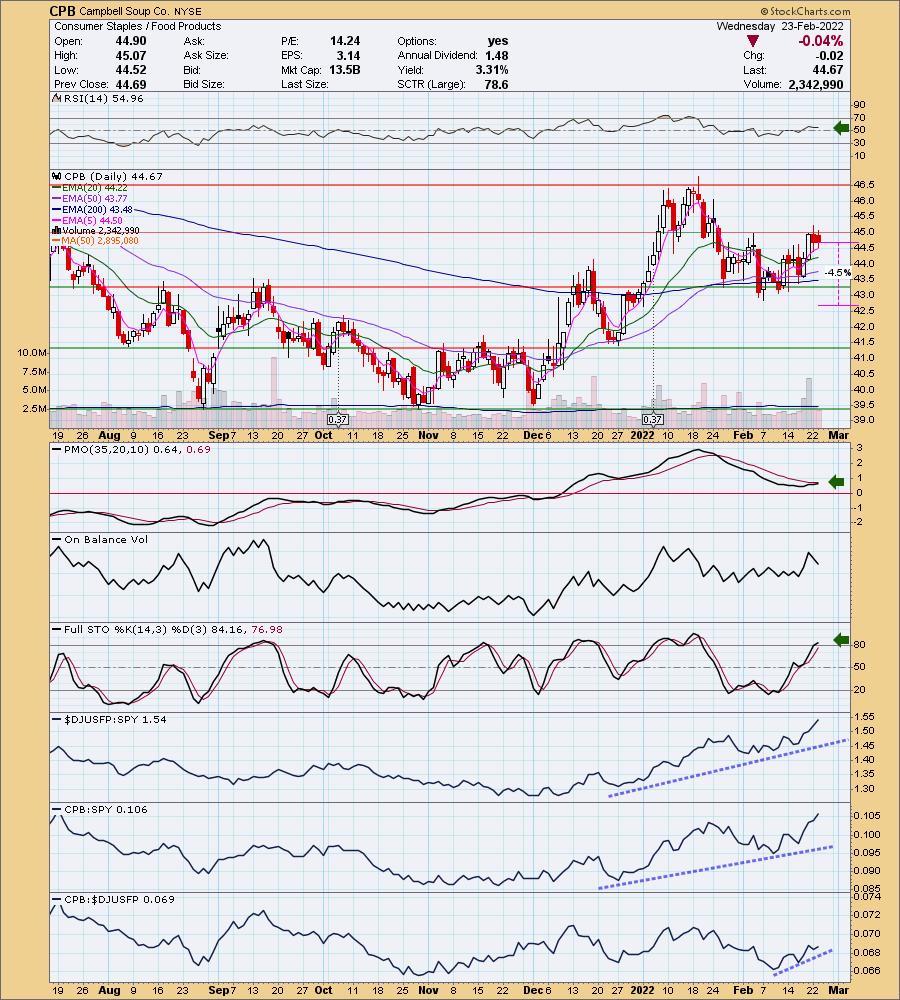
CPB is up +0.13% in after hours trading. I covered CPB twice before on March 11th 2020 (position stopped out) and April 15th 2020 (position stopped out later that year). CPB was actually quite volatile during the bear market and didn't really enjoy the same steady rise that some of its peers in the Staples sector like PG, KO and BGS to name a few. Given the defensive nature of the market right now, I like CPB's chart. We have a short-term rounded bottom. Price hasn't overcome resistance yet, but the indicators are positive. The RSI is above net neutral (50) and the PMO is nearing a crossover BUY signal. Stochastics are now above 80 suggesting internal strength. I like that you can set a thin stop below the price bottom.
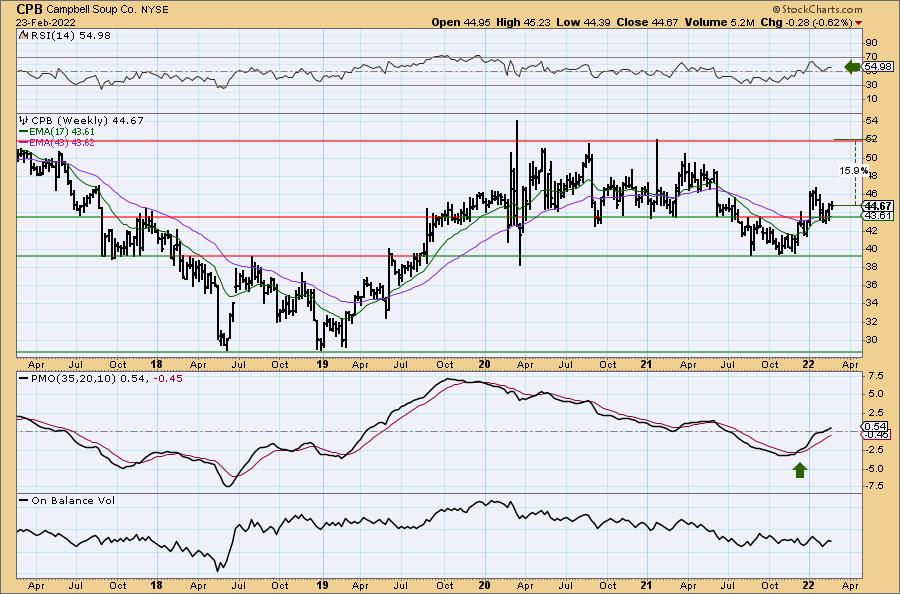
The weekly chart is very bullish. The weekly RSI is positive and not overbought. I very much like that the weekly PMO is on a crossover BUY signal, rising, not overbought and now sitting above the zero line. If CPB can recapture 2020 highs it would be an almost 16% gain. If it can reach its all-time closing high from 2016 that would be an over 24% gain.
Cheniere Energy, Inc. (LNG)
EARNINGS: 2/24/2022 (BMO) ** REPORTS TOMORROW **
Cheniere Energy, Inc. engages in liquefied natural gas (LNG) related businesses. It owns and operates LNG terminals, and develops, constructs, and operates liquefaction projects near Corpus Christi, Texas, and at the Sabine Pass LNG terminal. The company was founded by Charif Souki in 1983 and is headquartered in Houston, TX.
Predefined Scans Triggered: Elder Bar Turned Green and New CCI Buy Signals.
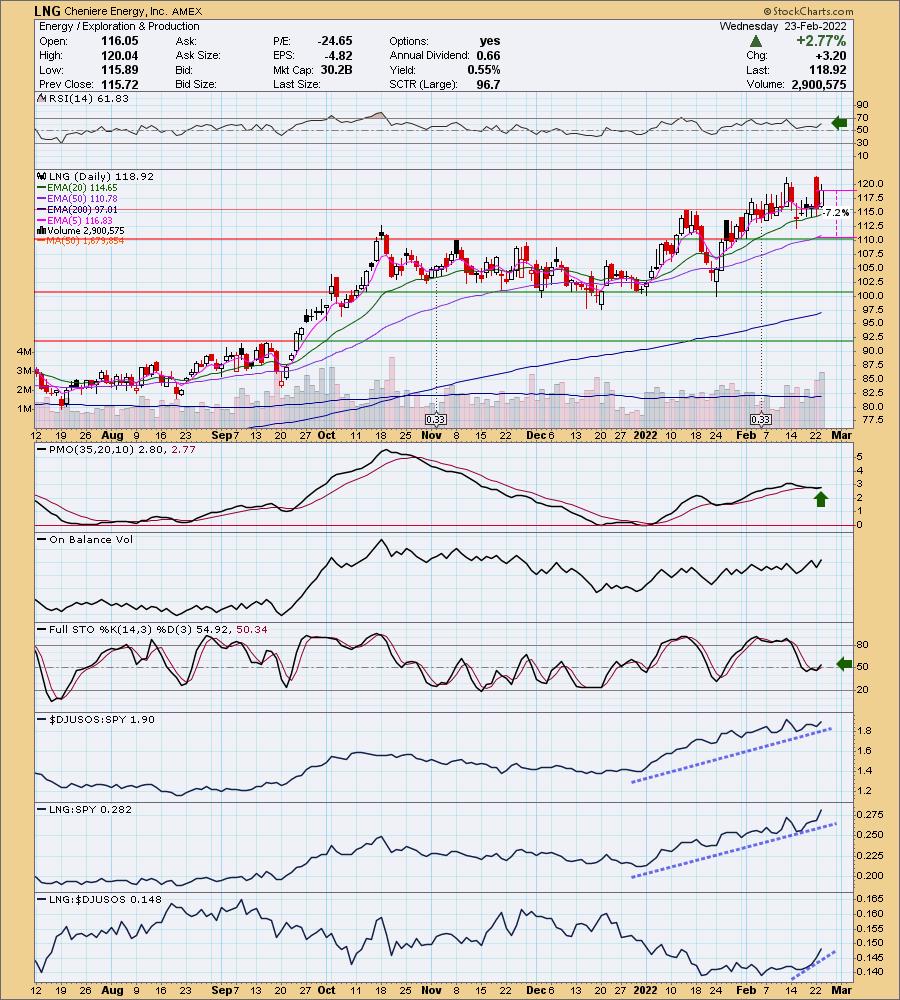
LNG is down -0.06% in after hours trading. I hesitated to include this one because it reports earnings tomorrow. If you decide you like this one, you'll at least have a heads up and can avoid any earnings death drops. I covered LNG on January 6th 2021 (position is still open and currently up a whopping +90.0%!
I like this area of the market, but it is hard to find stocks that don't have an overbought PMO SELL signal like XLE. This one has a brand new whipsaw PMO BUY signal and the PMO is not overbought. The RSI is positive and Stochastic have reversed. The group is still outperforming the market and LNG is outperforming the group and has been beating the SPY. I've set the stop at the 50-day EMA and November highs.
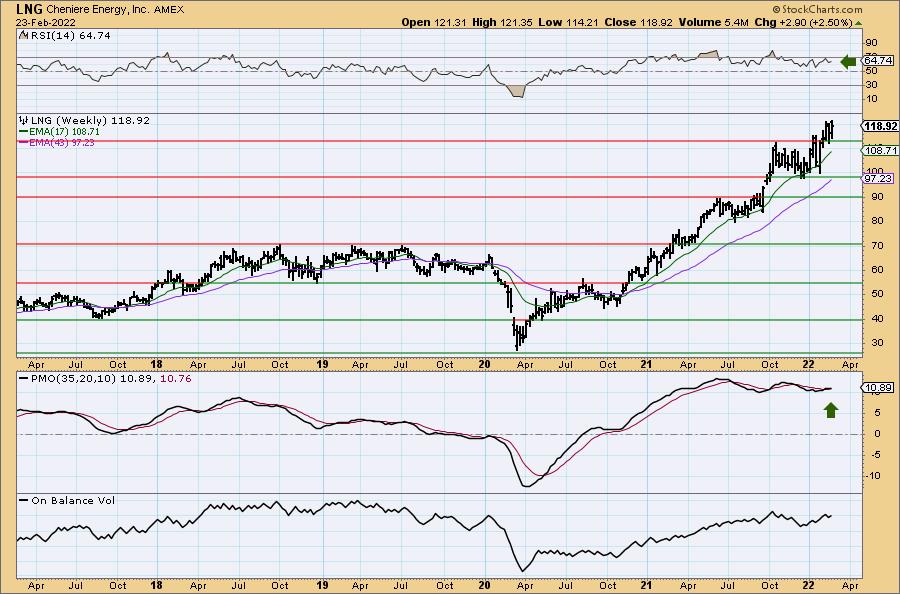
The weekly chart looks very good with the positive weekly RSI and weekly PMO crossover BUY signal. The PMO is overbought, but as you can see it can spend months in overbought territory right now. It's at all-time highs so consider an upside target of 14% around $135.57.
Don't forget, on Thursdays I look at reader-requested symbols, click HERE to shoot me an email. I read every email I receive and try to answer them all!
Current Market Outlook:
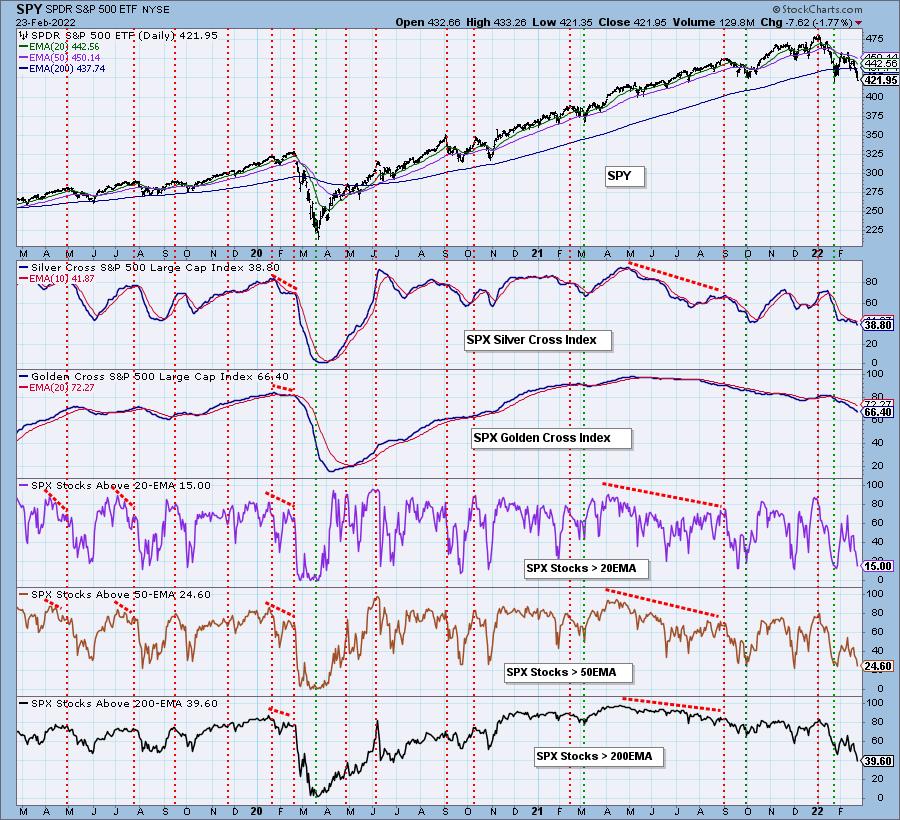
Market Environment: It is important to consider the odds for success by assessing the market tides. The following chart uses different methodologies for objectively showing the depth and trend of participation for intermediate- and long-term time frames.
- The Silver Cross Index (SCI) shows the percentage of SPX stocks on IT Trend Model BUY signals (20-EMA > 50-EMA)
- The Golden Cross Index (GCI) shows the percentage of SPX stocks on LT Trend Model BUY signals (50-EMA > 200-EMA)
Don't forget that as a "Diamonds" member, you have access to our GCI/SCI curated ChartList on DecisionPoint.com. You'll find it under "Members Only" links on the left side on the Blogs and Links Page.
Here is the current chart:
Full Disclosure: I'm 8% invested and 92% is in 'cash', meaning in money markets and readily available to trade with.
I'm required to disclose if I currently own a stock and/or may buy it within the next 72 hours.
Good Luck and Good Trading!
- Erin
"Technical Analysis is a windsock, not a crystal ball." - Carl Swenlin
(c) Copyright 2022 DecisionPoint.com
Watch the latest episode of DecisionPoint with Carl & Erin Swenlin on Mondays 7:00p EST or on the DecisionPoint playlist on the StockCharts TV YouTube channel here!
NOTE: The stocks reported herein are from mechanical trading model scans that are based upon moving average relationships, momentum and volume. DecisionPoint analysis is then applied to get five selections from the scans. The selections given should prompt readers to do a chart review using their own analysis process. This letter is not a call for a specific action to buy, sell or short any of the stocks provided. There are NO sure things or guaranteed returns on the daily selection of "Diamonds in the Rough."
Helpful DecisionPoint Links:
DecisionPoint Shared ChartList and DecisionPoint Chart Gallery
Price Momentum Oscillator (PMO)
Swenlin Trading Oscillators (STO-B and STO-V)
For more links, go to DecisionPoint.com