
The Diamond PMO Scan turned up zero results for the fourth day in a row. This is not good for the market and tells me that while the market is moving higher, participation is not broad. There are pockets of strength and we had two themes emerge in the few results I did get.
Miners and Materials in general were prominent in my scans but I've already pounded the table hard enough on Miners. I did include some in today's "Stocks to Review".
Many Diamonds subscribers send me their stock ideas early for Thursday's Reader Request Day. Usually I wait to present them on Thursday, but one I felt needed to presented today. The other I'm presenting as a follow-on to my "Diamond in Rough" that popped in my scans today. We'll see which one does better, eh?
UNG gapped up on the open and was up over 13% today. I apologize that I didn't bring this one to you on Monday after I saw the breakout, but I too didn't get a great entry today, but I did enter it. Upside potential is great. I also added GFI as I said I would yesterday. I added two other positions and that brings me to 30% exposure. I do have stops on all of my positions, but I believe Energy, Materials and Financials will be the place to be moving into 2022.
Today's "Diamonds in the Rough": BTU, TK and ZIM.
"Stocks to Review": RANI, REGN, BATT, AG, SLV, CEF and NUGT.

RECORDING LINK (1/7/2022):
Topic: DecisionPoint Diamond Mine (1/7/2022) LIVE Trading Room
Start Time: Jan 7, 2022 09:00 AM
Meeting Recording Link.
Access Passcode: January@7
REGISTRATION FOR 1/14 Diamond Mine:
When: Jan 14, 2022 09:00 AM Pacific Time (US and Canada)
Topic: DecisionPoint Diamond Mine (1/14/2022) LIVE Trading Room
Register in advance for this webinar HERE.
Save the registration confirmation email with login instructions in case Zoom doesn't notify you in time.

Free DP Trading Room (1/3) RECORDING LINK:
Topic: DecisionPoint Trading Room
Start Time: Jan 3, 2022 09:00 AM
Meeting Recording Link.
Access Passcode: January#3
For best results, copy and paste the access code to avoid typos.
Welcome to DecisionPoint Daily Diamonds, wherein I highlight ten "Diamonds in the Rough" per week. These are selected from the results of my DecisionPoint Scans, which search for stocks that could benefit from the trend and condition of the market. Remember, these are not recommendations to buy or sell, but are the most interesting of the stocks that surfaced in my scans. My objective is to save you the work of the initial, tedious culling process, but you need to apply your own analysis to see if these stocks pique your interest as well. There are no guaranteed winners here!
Predefined Scan Results are taken from the StockCharts.com Scan List.
Peabody Energy Corp. (BTU)
EARNINGS: 2/3/2022 (BMO)
Peabody Energy Corp. engages in the business of coal mining. It operates through the following segments: Powder River Basin Mining, Midwestern U.S. Mining, Western U.S. Mining, Seaborne Metallurgical Mining, Seaborne Thermal Mining and Corporate and Other. The Powder River Basin Mining segment consists of its mines in Wyoming. The Midwestern U.S. Mining segment includes Illinois and Indiana mining operations. The Western U.S. Mining segment reflects the aggregation of its New Mexico, Arizona and Colorado mining operations. The Seaborne Metallurgical Mining segment covers mines in Queensland, Australia. The Seaborne Thermal Mining segment handles operations in New South Wales, Australia. The Corporate and Other segment includes selling and administrative expenses, results from equity affiliates, corporate hedging activities and trading and brokerage activities. The company was founded by Francis S. Peabody in 1883 and is headquartered in St. Louis, MO.
Predefined Scans Triggered: Moved Above Upper Keltner Channel, Moved Above Upper Bollinger Band, Moved Above Upper Price Channel, P&F Double Top Breakout and P&F Bearish Signal Reversal.
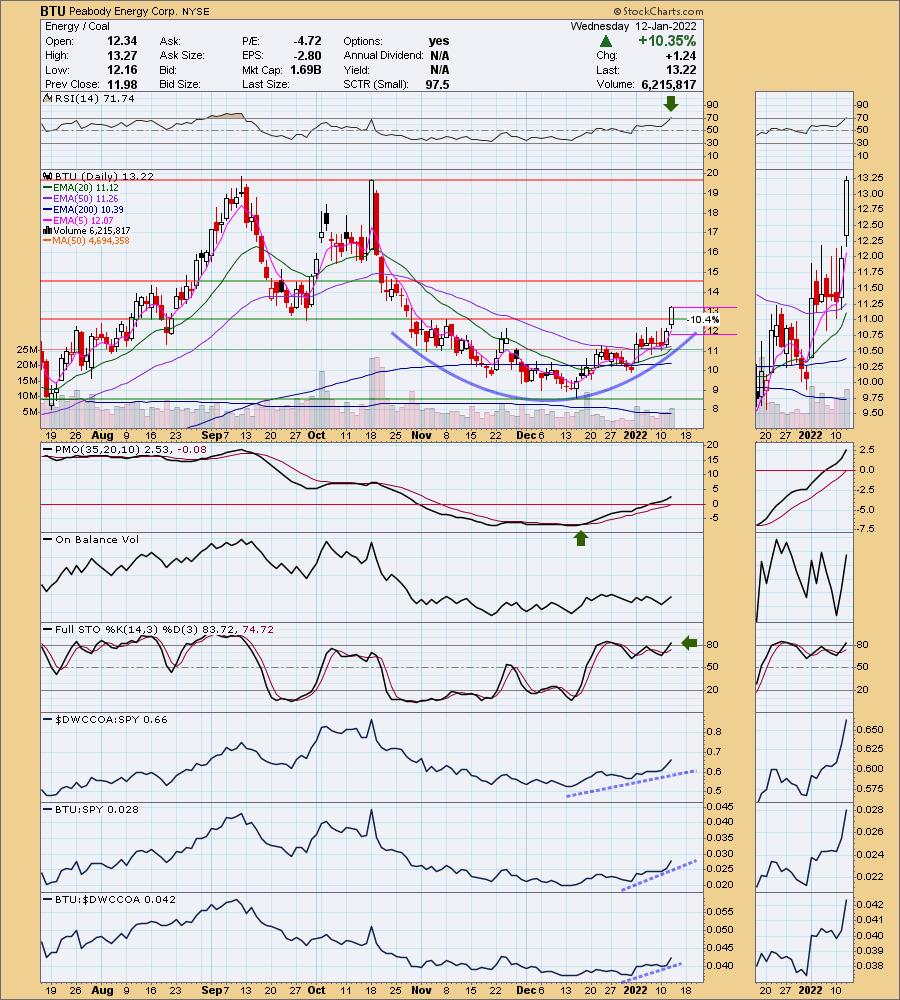
BTU is up +0.23% in after hours trading. I covered this one three times before and each of those positions was stopped out. Here are the links: September 3rd 2020, September 10th 2020 and October 5th 2021. This one was sent in this morning by a subscriber. It popped today and was up over 10% which makes setting the stop a bit tricky. It should give you an opportunity to enter on a pullback that will likely occur tomorrow after such a huge move. Today's pop did move the RSI into overbought territory but you can see in early September, it managed to stay overbought for quite a few trading days. We have a lovely rounded price bottom or basing pattern as Mary Ellen McGonagle often refers to them. Today's big rally pushed price above overhead resistance easily. The PMO is rising on an oversold BUY signal. Stochastics have just reached above 80 and relative strength is great across the board for the group and the stock. The stop is deep and is set just below $12.
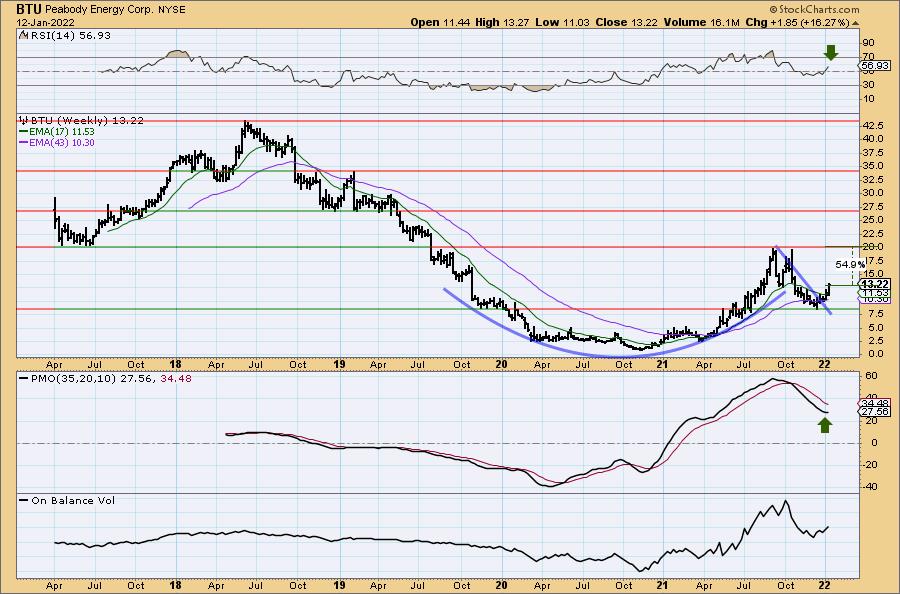
We have a textbook cup with handle pattern on the weekly chart which is bullish. Last week began a breakout and this week we are seeing a continuation. This has moved the weekly RSI into positive territory and it is helping the weekly PMO decelerate and possibly bottom soon.
Teekay Corp. (TK)
EARNINGS: 2/17/2022 (BMO)
Teekay Corp. is an investment holding company, which engages in the provision of international crude oil and gas marine transportation services. Its lines of business include offshore production (FPSO units), LNG and LPG carriers and conventional tankers. The firm operates through the following segments: Teekay LNG; Teekay Tankers and Teekay Parent. The Teekay LNG segment comprises of the liquefied natural gas and liquefied petroleum gas carriers. The Teekay Tankers segment offers conventional crude oil tankers and product carriers. The Teekay Parent owns floating production, storage, and offloading (FPSO) units and a minority investment in Tanker Investments Ltd. The company was founded by Jens Torben Karlshoej in 1973 and is headquartered in Hamilton, Bermuda.
Predefined Scans Triggered: Stocks in a New Uptrend (Aroon).
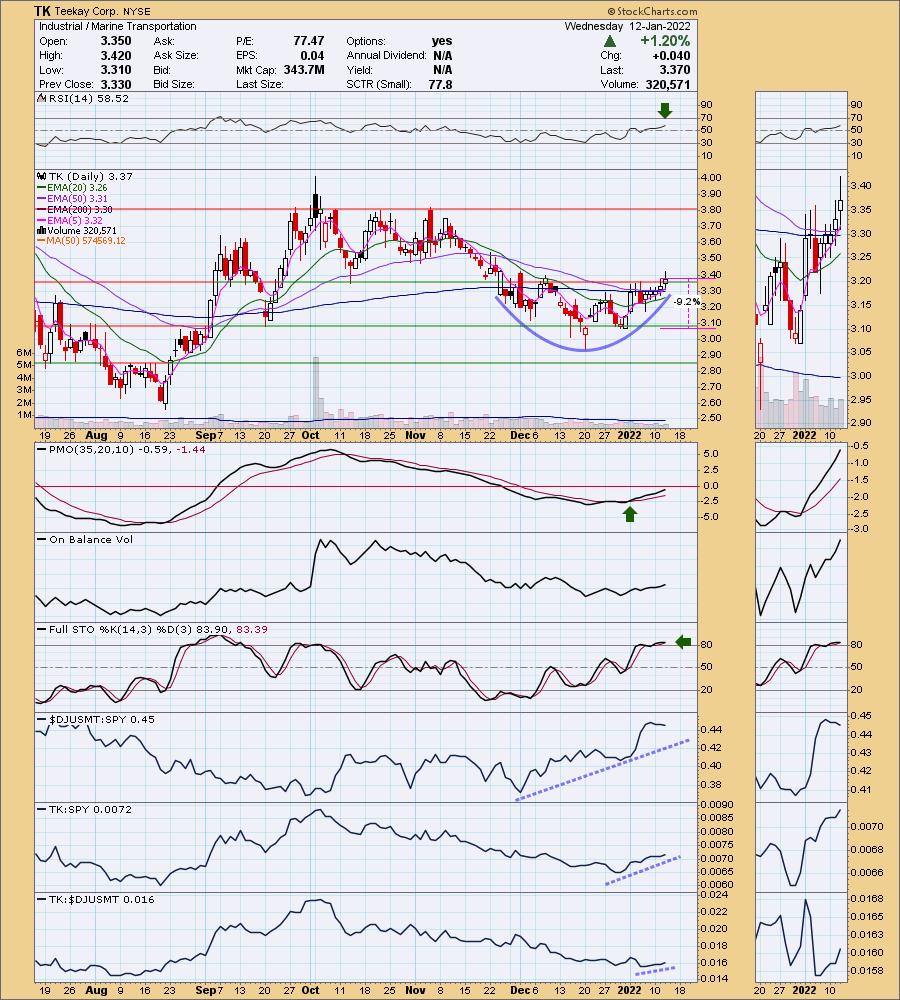
TK is unchanged in after hours trading. We have another rounded price bottom and a breakout. The RSI is positive. The PMO is rising on a crossover BUY signal. Stochastics are oscillating above 80. Price rallied above all of the key moving averages. This prevented a "death cross" of the 50/200-day EMAs. Relative strength is strong, although the group is cooling somewhat after reaching relative highs. The stop is deep, but lined up below the late December lows.
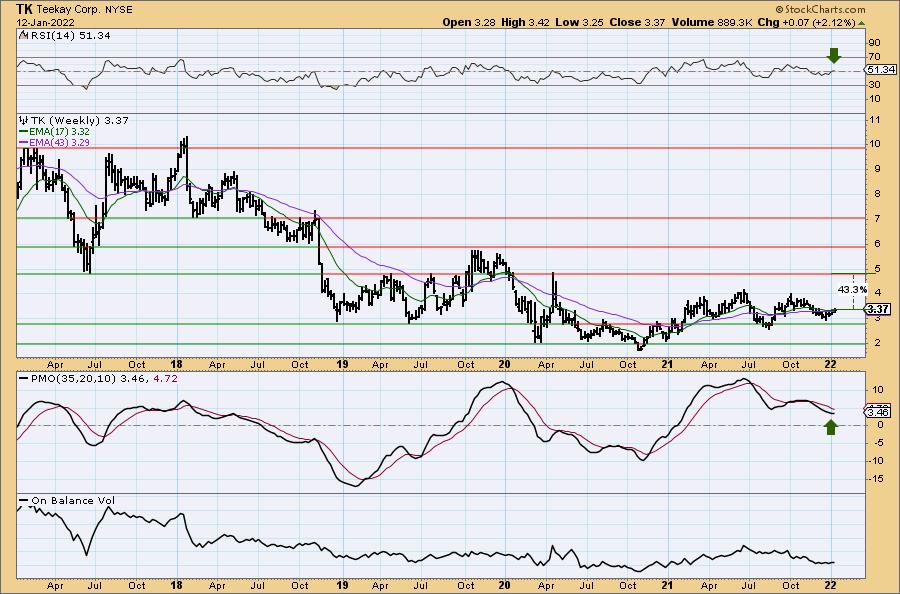
The weekly chart shows a newly positive weekly RSI and a weekly PMO that is decelerating and should turn up soon. Upside potential is excellent if it reaches the 2017 low and 2020 price top.
Zim Integrated Shipping Services Ltd. (ZIM)
EARNINGS: 3/21/2022 (BMO)
ZIM Integrated Shipping Services Ltd. engages in the provision of shipping and logistics services. It offers services such as shipping agencies, storage, distribution, forwarding and land transportation. The company was founded in 1945 and is headquartered in Haifa, Israel.
Predefined Scans Triggered: Improving Chaikin Money Flow, Moved Above Upper Bollinger Band, P&F Ascending Triple Top Breakout and P&F Double Top Breakout.
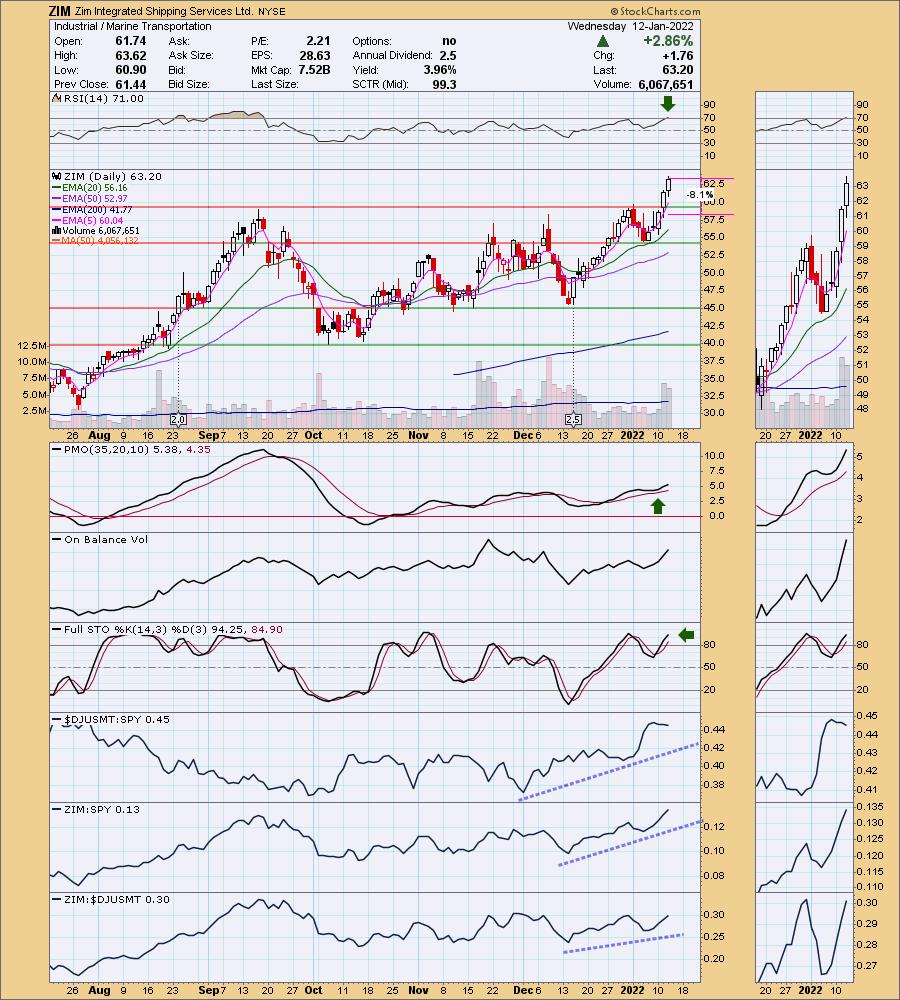
ZIM is up +0.55% in after hours trading. Unlike TK it is has already broken out to new highs. I like the pullback to the 20-day EMA followed by the breakout. The RSI is overbought right now, but like BTU, it stayed overbought for half of September. The PMO has bottomed above its signal line which is especially bullish. Additionally, the PMO is not overbought. ZIM is doing a better job outperforming its industry group. We'll see how both do on Friday's spreadsheet, but I must say trading room Joe tends to pick well. The stop is set below support, but I would watch the 20-day EMA. I would want to see it lose that level of support.
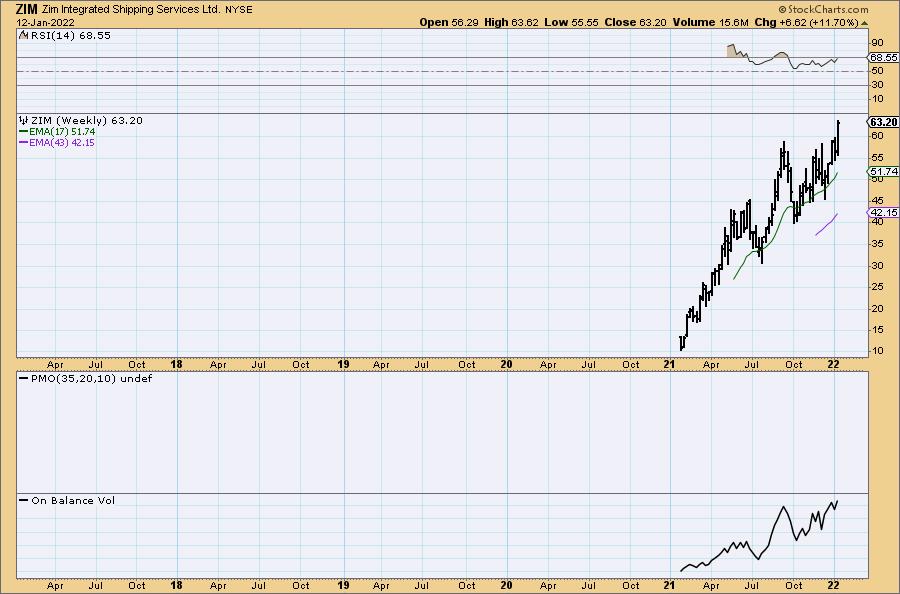
ZIM is making new highs and the weekly RSI is positive. I don't have much more information. You could set an 18% upside target at $74.57.
Don't forget, on Thursdays I look at reader-requested symbols, click HERE to shoot me an email. I read every email I receive and try to answer them all!
Current Market Outlook:
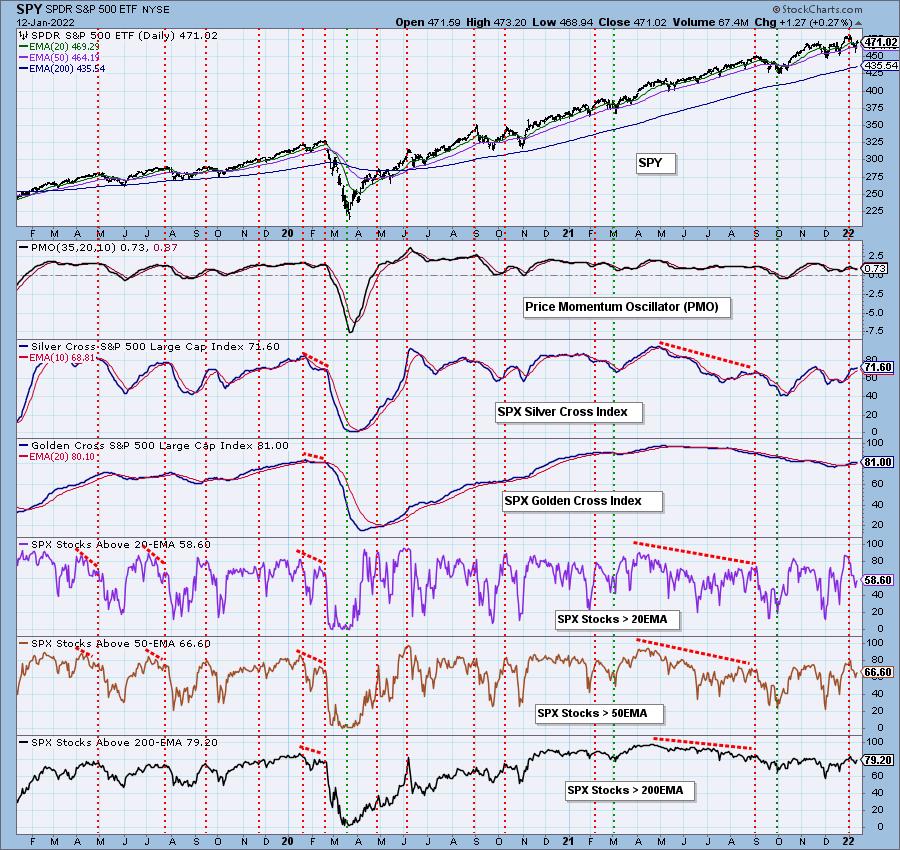
Market Environment: It is important to consider the odds for success by assessing the market tides. The following chart uses different methodologies for objectively showing the depth and trend of participation for intermediate- and long-term time frames.
- The Silver Cross Index (SCI) shows the percentage of SPX stocks on IT Trend Model BUY signals (20-EMA > 50-EMA)
- The Golden Cross Index (GCI) shows the percentage of SPX stocks on LT Trend Model BUY signals (50-EMA > 200-EMA)
Don't forget that as a "Diamonds" member, you have access to our GCI/SCI curated ChartList on DecisionPoint.com. You'll find it under "Members Only" links on the left side on the Blogs and Links Page.
Here is the current chart:
Full Disclosure: I'm 30% invested and 70% is in 'cash', meaning in money markets and readily available to trade with.
I'm required to disclose if I currently own a stock and/or may buy it within the next 72 hours.
Happy Charting!
- Erin
"Technical Analysis is a windsock, not a crystal ball." - Carl Swenlin
(c) Copyright 2022 DecisionPoint.com
Watch the latest episode of DecisionPoint with Carl & Erin Swenlin on Mondays 7:00p EST or on the DecisionPoint playlist on the StockCharts TV YouTube channel here!
NOTE: The stocks reported herein are from mechanical trading model scans that are based upon moving average relationships, momentum and volume. DecisionPoint analysis is then applied to get five selections from the scans. The selections given should prompt readers to do a chart review using their own analysis process. This letter is not a call for a specific action to buy, sell or short any of the stocks provided. There are NO sure things or guaranteed returns on the daily selection of "Diamonds in the Rough."
Helpful DecisionPoint Links:
DecisionPoint Shared ChartList and DecisionPoint Chart Gallery
Price Momentum Oscillator (PMO)
Swenlin Trading Oscillators (STO-B and STO-V)
For more links, go to DecisionPoint.com