
I had quite a few Reader Requests come through my email box this week which is good since my scans are simply not producing anything. There were no themes in my results today, they were all over the board and I honestly liked the Reader Requests better so all five were sent in. I've included some of the requests that I didn't cover as well as a few that came in my scans that were runner-ups.
Yesterday when I recorded Chartwise Women with Mary Ellen McGonagle, I asked her to look at JETS which is as the symbol implies an airline ETF. It is very bullish. I'll admit that a subscriber let me know that Larry Williams was zeroing in on this industry group, in particular, American Airlines (AAL). I like both JETS and AAL going into this year as the technicals look good.
The other four requests are excellent technically and come from XLF, XLI, XLY and XLC. I'm not thrilled with XLY and XLC in general but the selections brought to the table deserve the title "Diamond in the Rough".
Don't forget to register for the Diamond Mine trading room for tomorrow below or right here. And remember, the recordings are always listed in every DP Diamonds report.
Today's "Diamonds in the Rough": AAL, FAF, GSL, SCX and TU.
"Stocks to Review": HBM, TELL, OGE, DVN, ARKO, FLNG, CBZ, MSA, LTHM, MOS, VALE and AMBP.

RECORDING LINK (1/7/2022):
Topic: DecisionPoint Diamond Mine (1/7/2022) LIVE Trading Room
Start Time: Jan 7, 2022 09:00 AM
Meeting Recording Link.
Access Passcode: January@7
REGISTRATION FOR 1/14 Diamond Mine:
When: Jan 14, 2022 09:00 AM Pacific Time (US and Canada)
Topic: DecisionPoint Diamond Mine (1/14/2022) LIVE Trading Room
Register in advance for this webinar HERE.
Save the registration confirmation email with login instructions in case Zoom doesn't notify you in time.

Free DP Trading Room (1/3) RECORDING LINK:
Topic: DecisionPoint Trading Room
Start Time: Jan 3, 2022 09:00 AM
Meeting Recording Link.
Access Passcode: January#3
For best results, copy and paste the access code to avoid typos.
Welcome to DecisionPoint Daily Diamonds, wherein I highlight ten "Diamonds in the Rough" per week. These are selected from the results of my DecisionPoint Scans, which search for stocks that could benefit from the trend and condition of the market. Remember, these are not recommendations to buy or sell, but are the most interesting of the stocks that surfaced in my scans. My objective is to save you the work of the initial, tedious culling process, but you need to apply your own analysis to see if these stocks pique your interest as well. There are no guaranteed winners here!
Predefined Scan Results are taken from the StockCharts.com Scan List.
American Airlines Group Inc. (AAL)
EARNINGS: 1/20/2022 (BMO)
American Airlines Group, Inc. is a holding company, which engages in the operation of a network carrier through its principal wholly-owned mainline operating subsidiary, American. The firm offers air transportation for passengers and cargo. It operates through the following geographical segments: Department of Transportation Domestic; Department of Transportation Latin America; Department of Transportation Atlantic; and Department of Transportation Pacific. The company was founded on December 9, 2013 and is headquartered in Fort Worth, TX.
Predefined Scans Triggered: Elder Bar Turned Green, New CCI Buy Signals, Moved Above Ichimoku Cloud and P&F Double Top Breakout.
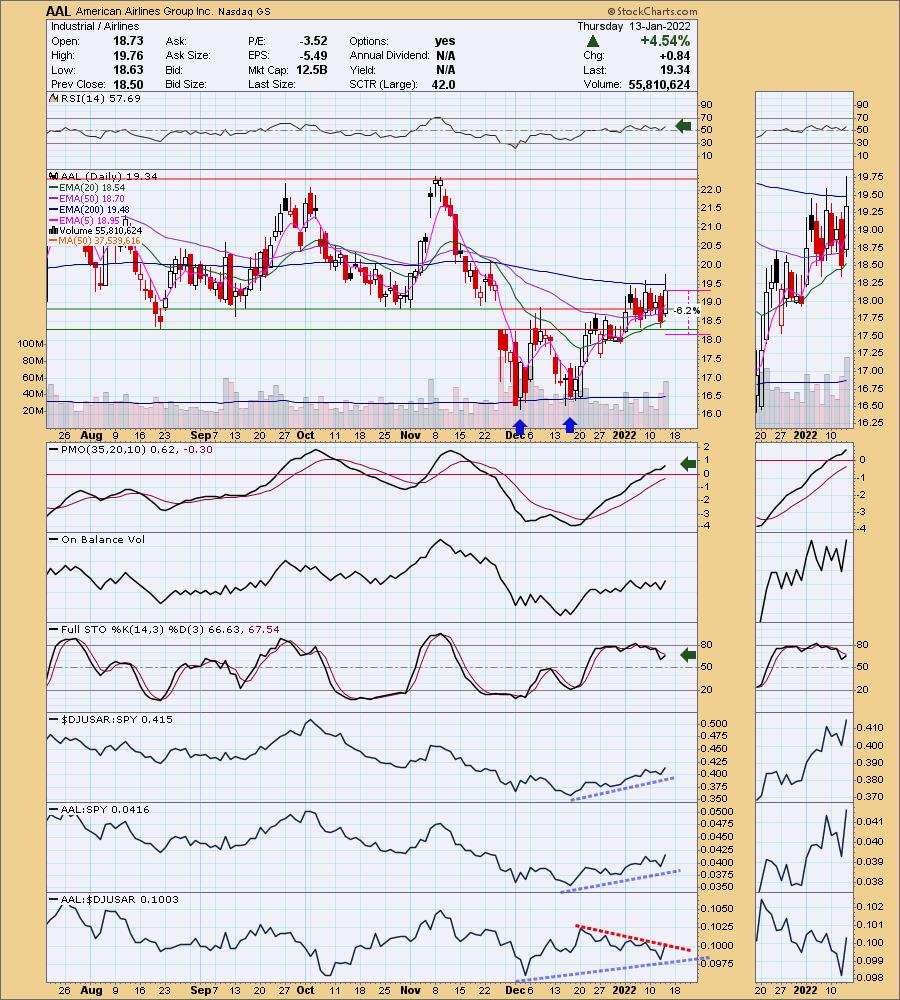
AAL is down -0.10% in after hours trading. I've covered AAL once before on May 18th 2021. The position was up about 10% at the June top, but ultimately dropped and triggered the stop. One issue for me on the chart is that price hasn't closed above the 200-day EMA yet; however, given the positive indicators, in particular the accelerating PMO, I believe it has merit. The RSI is positive and Stochastics are in positive territory and appear ready to move higher again. We want to see them get above 80 quickly. The group is certainly starting to outperform and AAL is outperforming the SPY. It isn't outperforming its group, but it is trying to break the relative declining trend. I wouldn't give this one too much rope which is why I set a 6.2% stop.
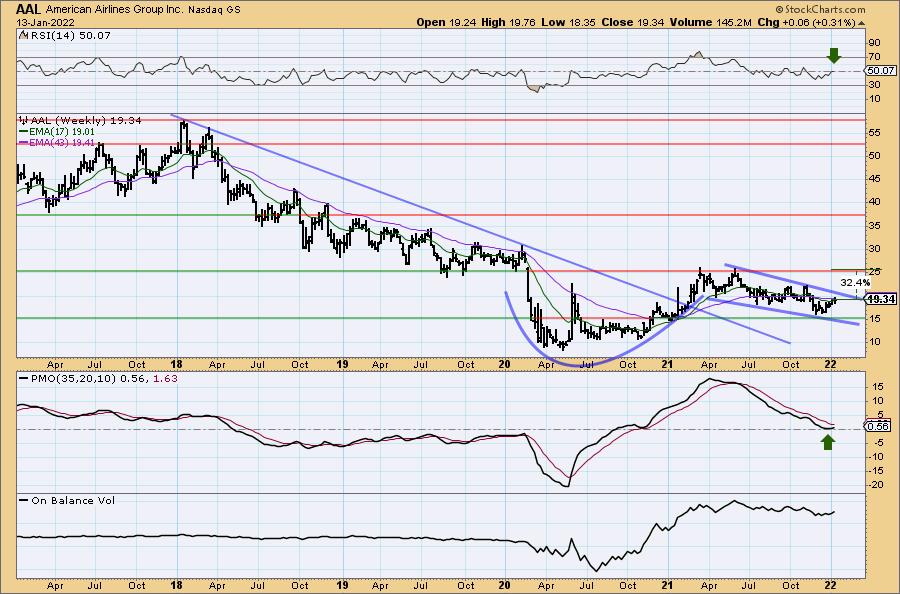
The weekly chart shows a cup and handle pattern. More importantly, the "handle" is a falling wedge. Those are bullish patterns that tell us to expect and upside breakout. The weekly RSI just hit positive territory and the weekly PMO has turned up. I've set the upside target at the 2021 high.
First American Corp. (FAF)
EARNINGS: 2/10/2022 (BMO)
First American Financial Corp. operates as an insurance company. It provides title insurance and settlement services to the real estate and mortgage industries. The company operates its business through the following segments: Title Insurance & Services and Specialty Insurance. The Title Insurance & Services segment provides title insurance, escrow, closing services and similar or related financial services domestically and internationally in connection with residential and commercial real estate transactions. It also maintains, manages and provides access to title plant records and images and provides banking, trust and investment advisory services. The Specialty Insurance segment issues property & casualty insurance policies and sells home warranty products. It also provides title plant management services, which include title and other real property records and images, valuation products and services, home warranty products, property and casualty insurance and banking, trust and investment advisory services. First American Financial was founded in January, 2008 and is headquartered in Santa Ana, CA.
Predefined Scans Triggered: New 52.-week Highs, P&F Double Top Breakout and P&F Triple Top Breakout.
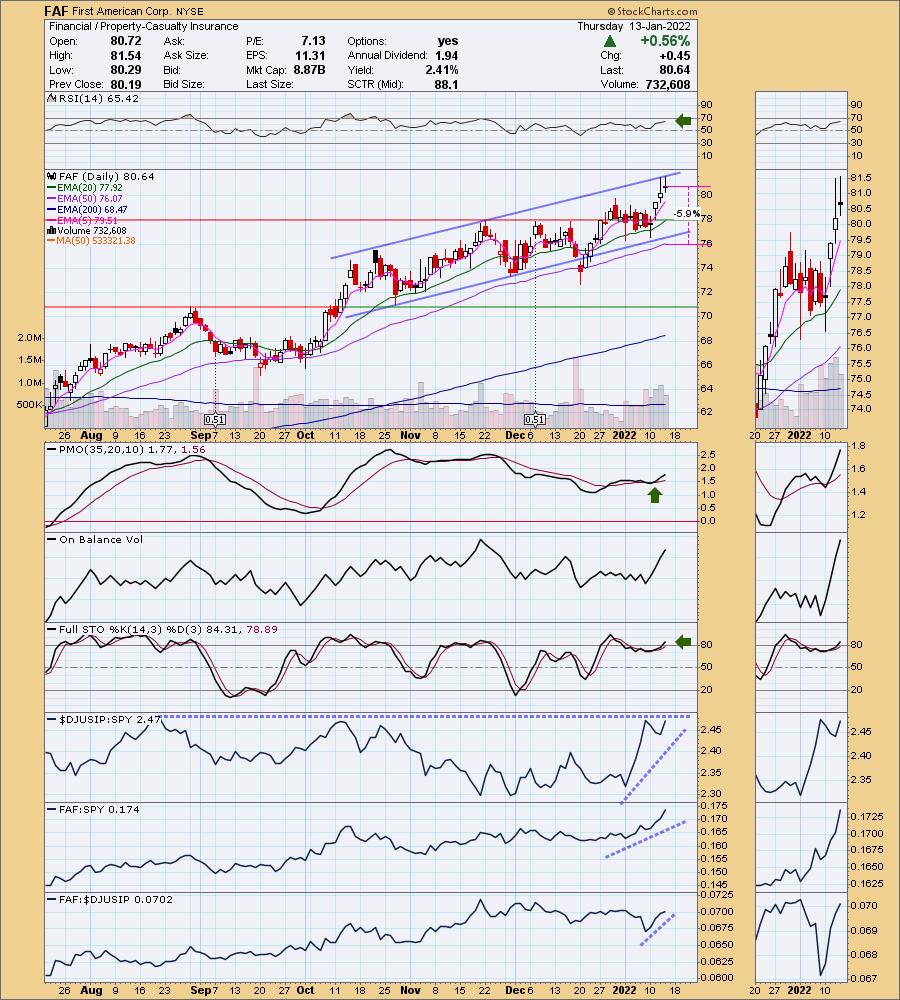
FAF is unchanged in after hours trading. FAF has been in a rising trend channel since October. Now that it has reached the top of the channel, there is a chance we will get a pullback before we get more rally. However, this industry group continues to be on fire and FAF is starting to outperform this strong group and the SPY. RSI is positive and not overbought. The PMO is on a whipsaw BUY signal and Stochastics are rising and above 80. The stop is set below the rising trend channel around the 50-day EMA.
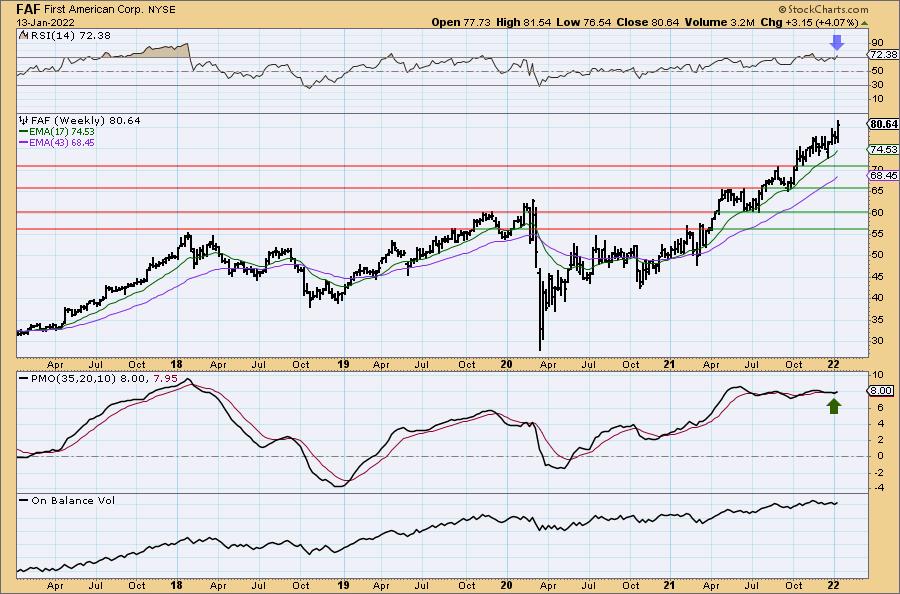
The weekly chart looks pretty good given the weekly PMO just triggered a crossover BUY signal. The RSI is overbought, but we've seen it stay that way in the midst of a good rally like the end of 2017. It's at all-time highs so I would consider a 14% upside target at around $16.04 (more than double my stop level).
Global Ship Lease, Inc. (GSL)
EARNINGS: 3/3/2022 (BMO)
Global Ship Lease, Inc. is a holding company, which owns and charters out containerships under long-term and fixed rate charters to container shipping companies. It also focuses on the operation and technical management of each vessel, such as crewing, provision of lubricating oils, maintaining the vessel, periodic dry docking, and performing work required by regulations. The company was founded on May 3, 2007 and is headquartered in London, the United Kingdom.
Predefined Scans Triggered: Moved Above Ichimoku Cloud.
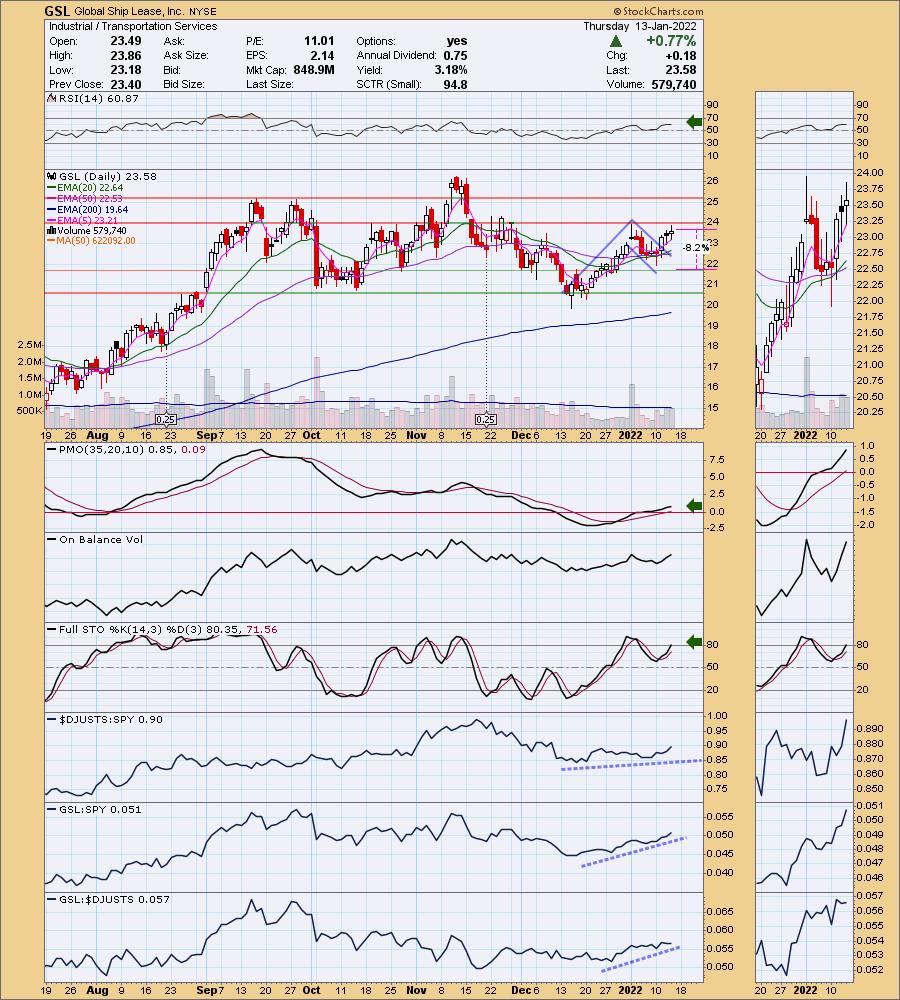
GSL is unchanged in after hours trading. It's been traveling in a trading channel between $20.50 and $25 since September/October so upside potential could be a bit limited if it sticks to this trading range. However, there is a bull flag that has a minimum upside target of about $27; that implies a breakout from the channel. The RSI is positive. The PMO has reached positive territory on a crossover BUY signal. Stochastics reversed in positive territory and are now above 80. Relative strength is beginning to build within the group and GSL is outperforming both the group and the SPY. The stop is at 8.2% which would mean the busting of the flag.
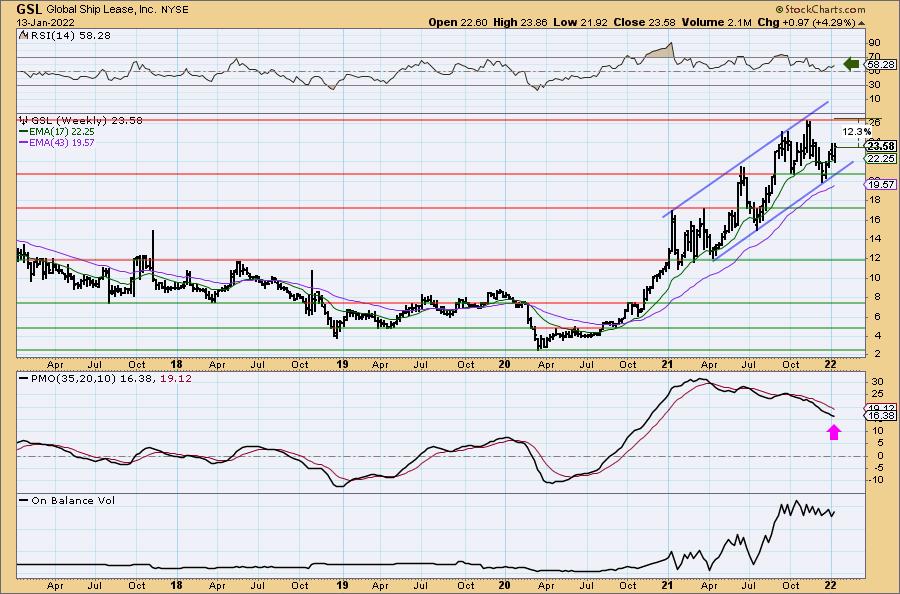
The weekly chart is mixed. The weekly PMO is still looking negative, but the weekly RSI is positive. Breaking that tie is price rallying within a rising trend channel. In the case of GSL, it has room to run before encountering possible resistance at the top of the channel. The upside target could be set at 15% around $27.12 which is the upside target of the flag pattern on the daily chart.
Starrett L S Co. (SCX)
EARNINGS: N/A
The L.S. Starrett Co. engages in the business of manufacturing products for industrial, professional, and consumer markets. Its products include precision tools, electronic gages, gage blocks, optical vision and laser measuring equipment, custom engineered granite solutions, tape measures, levels, chalk products, squares, hole saws, band saw, hacksaw, jig saw blades, reciprocating saw blades, and precision ground flat stock. It operates through the following segments: North American Operations and International Operations. The company was founded by Laroy S. Starrett in 1880 and is headquartered in Athol, MA.
Predefined Scans Triggered: None.
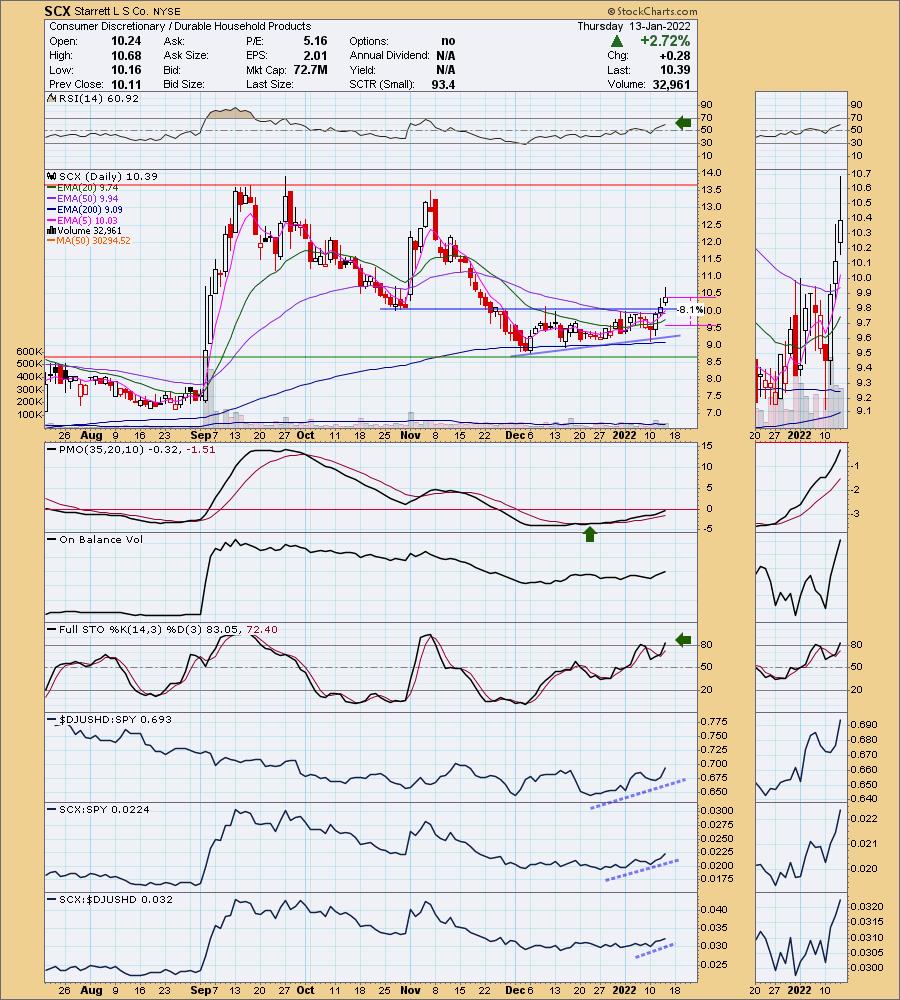
SCX is unchanged in after hours trading. Before I get started, I do want to mention that this is a very thinly traded stocks, one that wouldn't make my threshold of average daily volume of 100,000. This means it can be open to some manipulation. Price has broken out of a bullish ascending triangle (flat top, rising bottoms). Besides breaking out to confirm the pattern, this breakout takes it above strong resistance at the 50-day EMA and October low. The PMO is rising on a crossover BUY signal and the RSI is positive. Stochastics have now reached above 80. Relative performance looks good. The stop is set below the 20-day EMA at my average stop level of 8%.
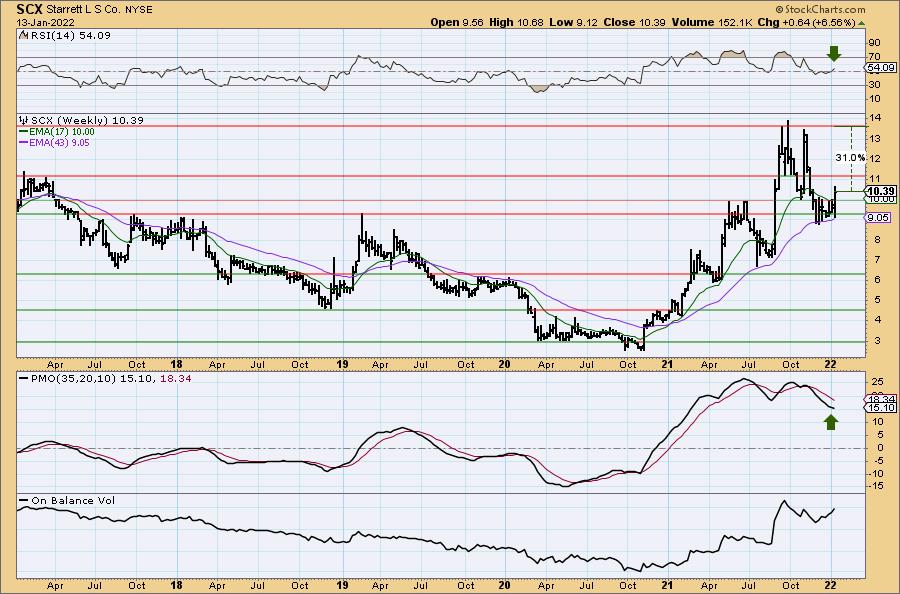
The weekly chart shows a decelerating weekly PMO and newly positive weekly RSI. If it can reach the September high, that would be a 31% gain.
Telus Corp. (TU)
EARNINGS: 2/10/2022 (BMO)
TELUS Corp. is a telecommunications company. The company specializes in telecommunication services and products primarily for wireless and wireline voice and data. It operates through the following segments: Wireless and Wireline. The Wireless segment refers to the data and voice products for mobile technologies. The Wireline segment offers data solutions such as internet protocol, television, hosting, managed information technology and cloud-based services, business process outsourcing, certain healthcare solutions, as well as voice and other telecommunications services, and equipment sales. The company was founded on October 4, 1990 and is headquartered in Vancouver, Canada.
Predefined Scans Triggered: New 52-week Highs, Moved Above Upper Price Channel, P&F Ascending Triple Top Breakout and P&F Double Top Breakout.
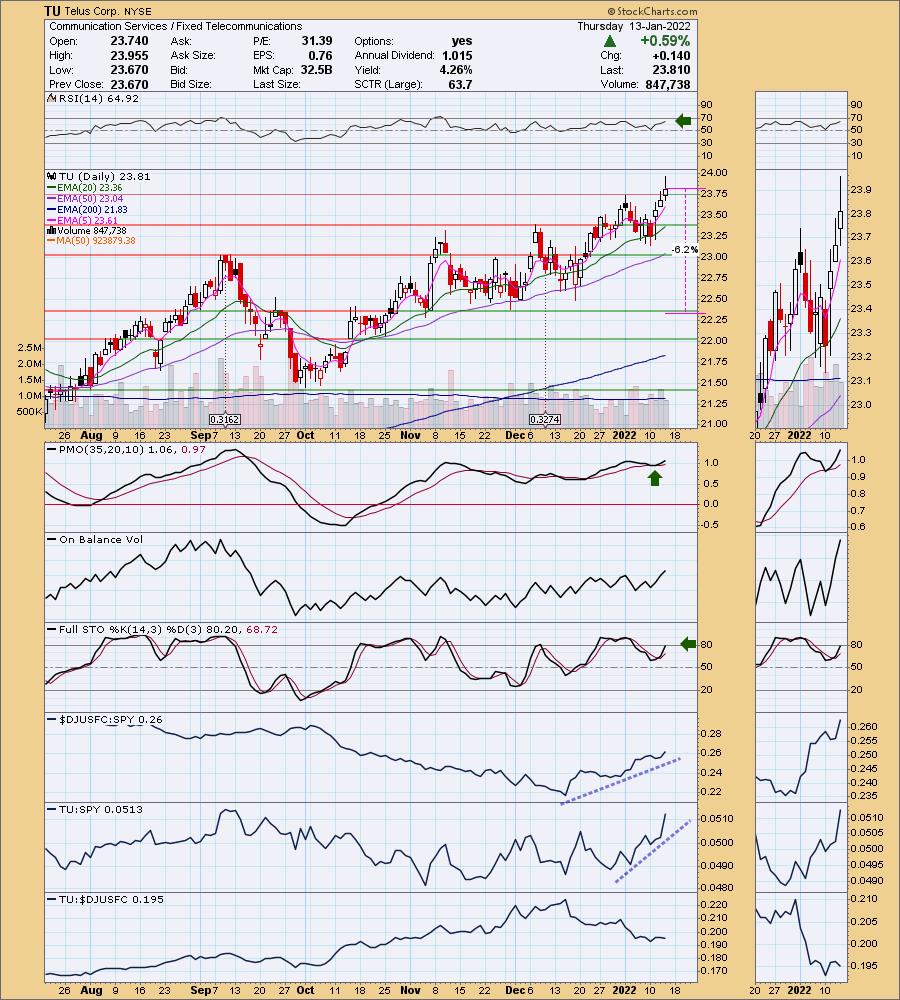
TU is down -0.80% in after hours trading. TU is making new all-time highs. As I told one subscriber, I typically look at reversals at lows rather than stocks making New Highs, but strength begets strength or as Mary Ellen always says, "Winners keep on winning!" The RSI is positive and the PMO has whipsawed into a BUY signal. Stochastics reversed in positive territory and have just inched above 80. While TU may not be performing as well as it group, it doesn't need to. It is outperforming the SPY by a mile. The stop is set way down below the late November low, but you could certainly tighten it up significantly.
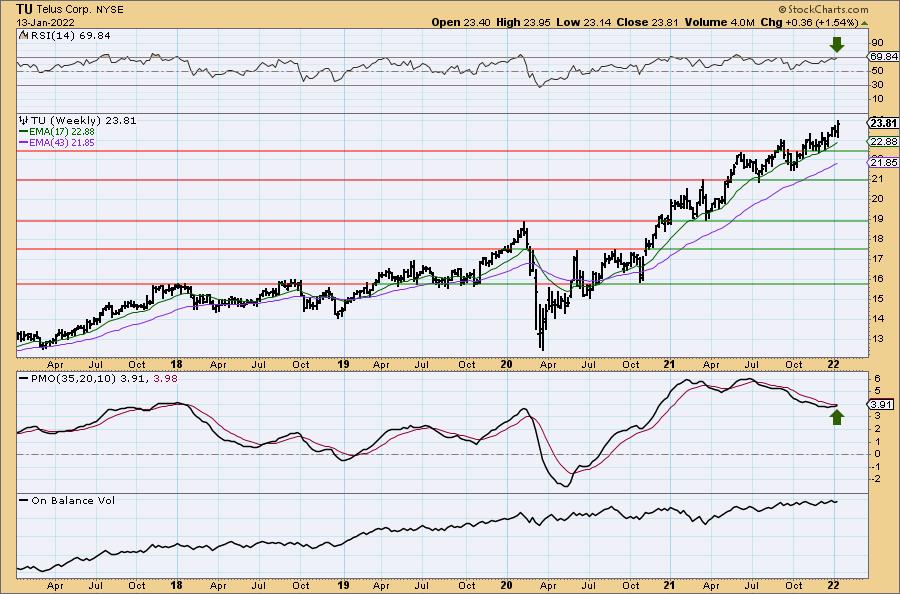
The weekly chart is very bullish. The weekly RSI is positive, albeit getting a bit overbought and the weekly PMO is going in for a crossover BUY signal. Since it is making new highs, consider an upside target of about 14% at $27.14.
Don't forget, on Thursdays I look at reader-requested symbols, click HERE to shoot me an email. I read every email I receive and try to answer them all!
Current Market Outlook:
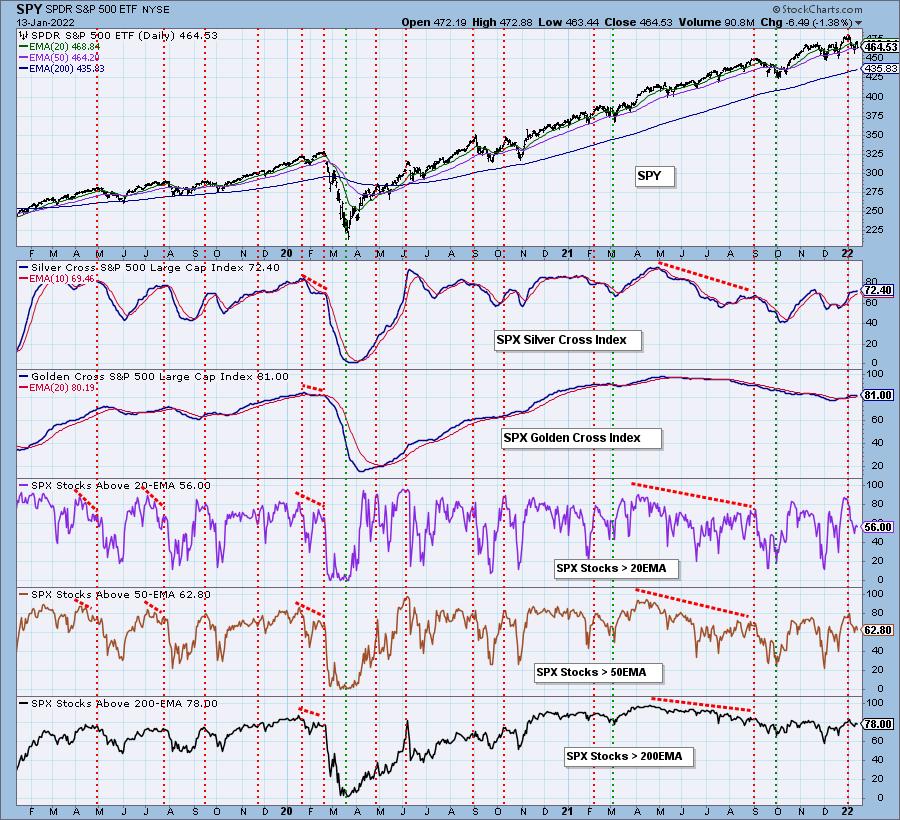
Market Environment: It is important to consider the odds for success by assessing the market tides. The following chart uses different methodologies for objectively showing the depth and trend of participation for intermediate- and long-term time frames.
- The Silver Cross Index (SCI) shows the percentage of SPX stocks on IT Trend Model BUY signals (20-EMA > 50-EMA)
- The Golden Cross Index (GCI) shows the percentage of SPX stocks on LT Trend Model BUY signals (50-EMA > 200-EMA)
Don't forget that as a "Diamonds" member, you have access to our GCI/SCI curated ChartList on DecisionPoint.com. You'll find it under "Members Only" links on the left side on the Blogs and Links Page.
Here is the current chart:
Full Disclosure: I'm 30% invested and 70% is in 'cash', meaning in money markets and readily available to trade with.
I'm required to disclose if I currently own a stock and/or may buy it within the next 72 hours.
Happy Charting!
- Erin
"Technical Analysis is a windsock, not a crystal ball." - Carl Swenlin
(c) Copyright 2022 DecisionPoint.com
Watch the latest episode of DecisionPoint with Carl & Erin Swenlin on Mondays 7:00p EST or on the DecisionPoint playlist on the StockCharts TV YouTube channel here!
NOTE: The stocks reported herein are from mechanical trading model scans that are based upon moving average relationships, momentum and volume. DecisionPoint analysis is then applied to get five selections from the scans. The selections given should prompt readers to do a chart review using their own analysis process. This letter is not a call for a specific action to buy, sell or short any of the stocks provided. There are NO sure things or guaranteed returns on the daily selection of "Diamonds in the Rough."
Helpful DecisionPoint Links:
DecisionPoint Shared ChartList and DecisionPoint Chart Gallery
Price Momentum Oscillator (PMO)
Swenlin Trading Oscillators (STO-B and STO-V)
For more links, go to DecisionPoint.com