
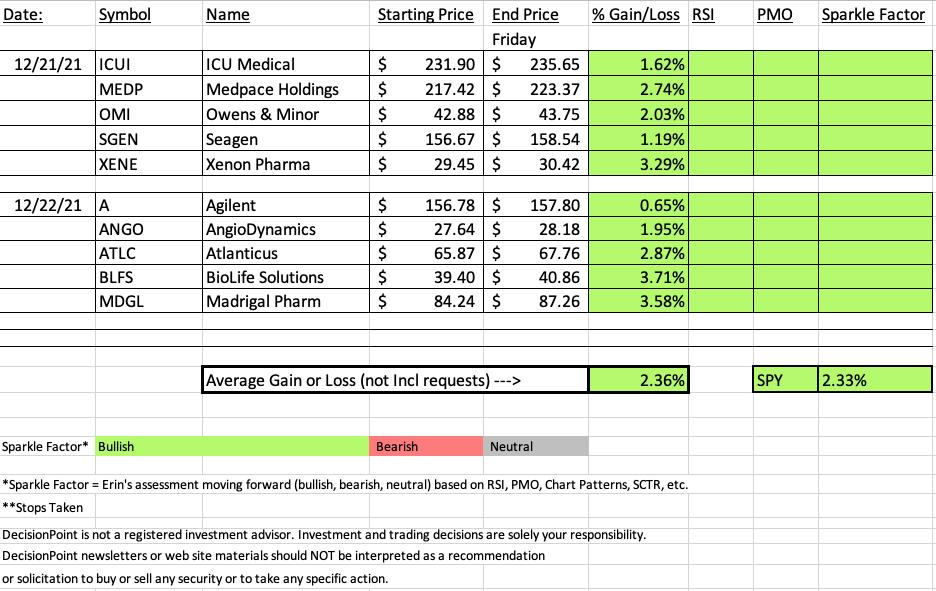
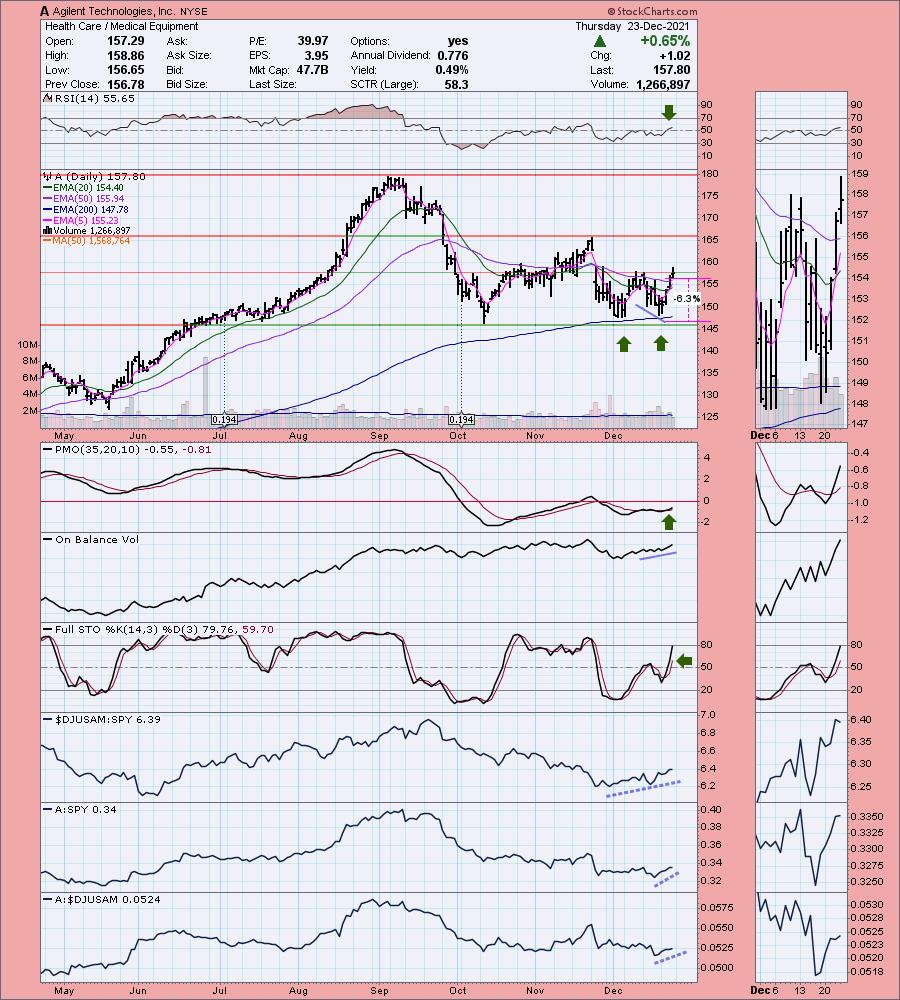
Like the SPY, "Diamonds in the Rough" had a great week, albeit an abbreviated week. All picks were in the green and all of them look good moving into next week. Technically, there is no "Dud" this week. The 'worst' performer was Agilent (A) which was up +0.65% this week.
This week's "Darling" is BioLife Solutions (BLFS) which was up +3.71%. However, a close second is Madrigal Pharmaceuticals (MDGL) which was up +3.58%.
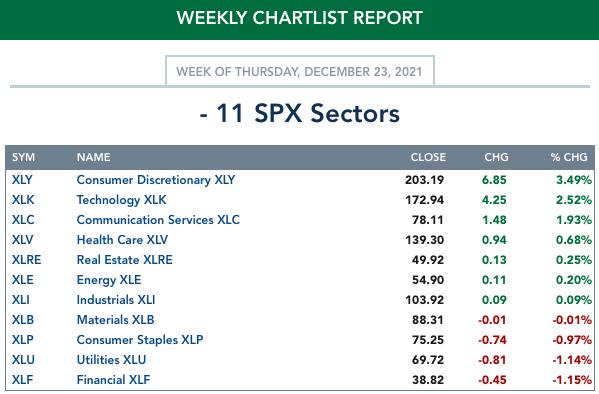
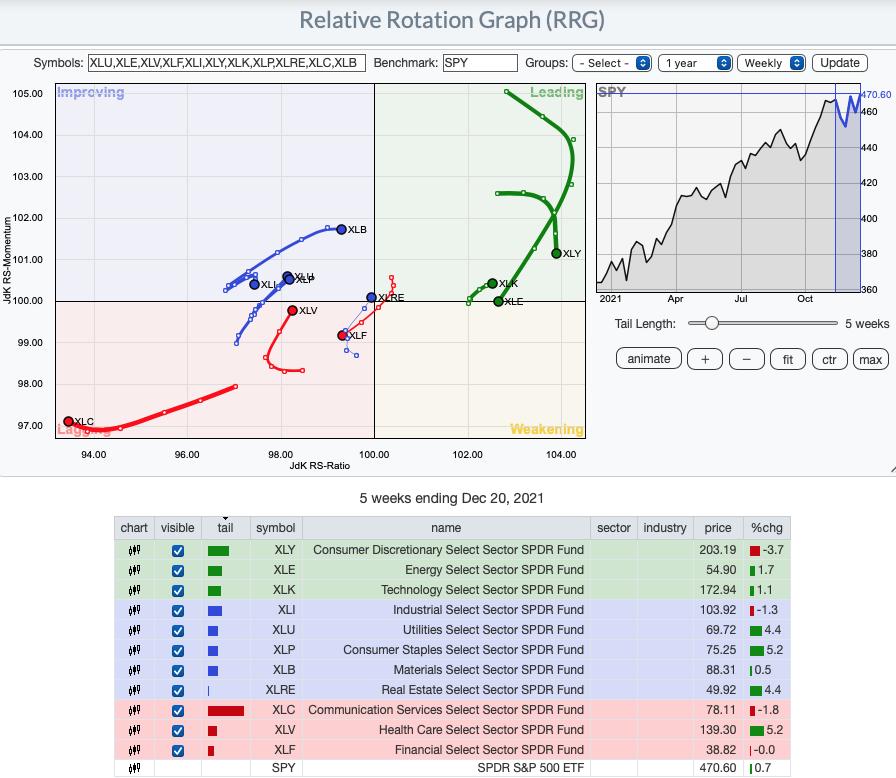
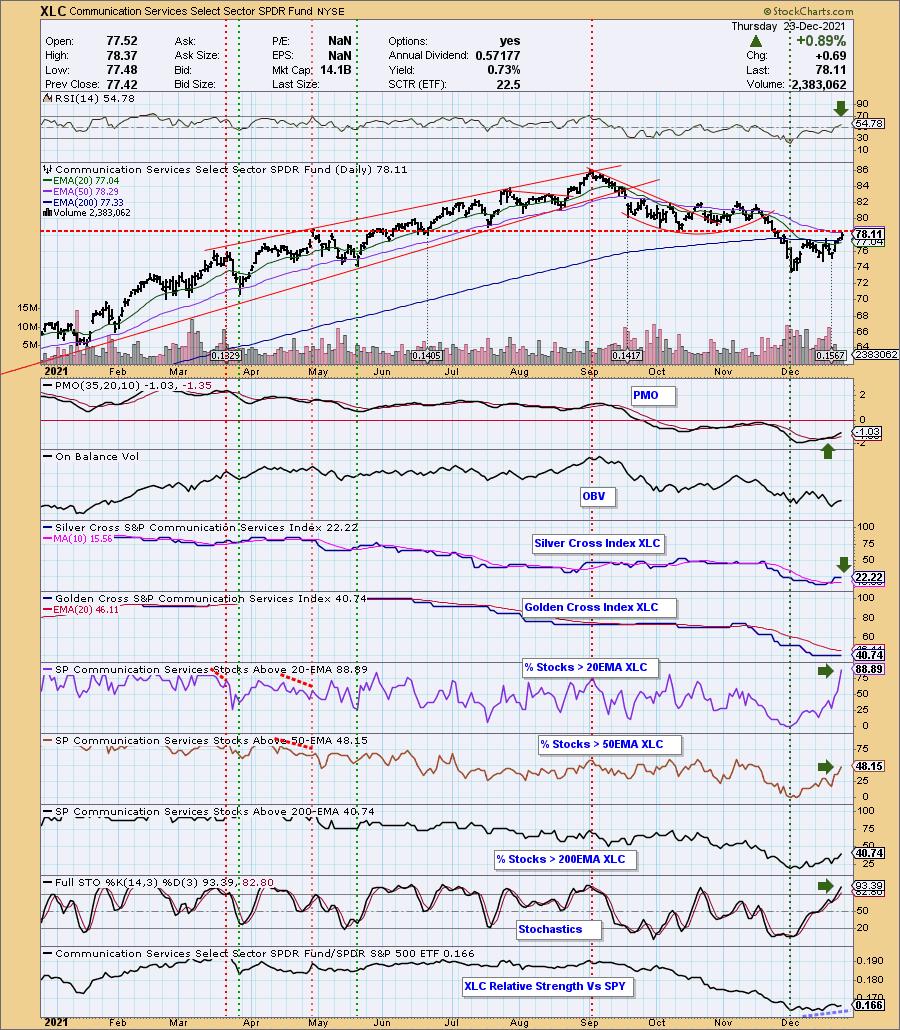
As far as the "Sector to Watch", there were quite a few that looked good, but ultimately based on momentum and participation, the winner is Communication Services (XLC) is the winner. I can't believe that I'm picking this sector, but I'm not going to argue with the "under the hood" indicators and improving relative performance.
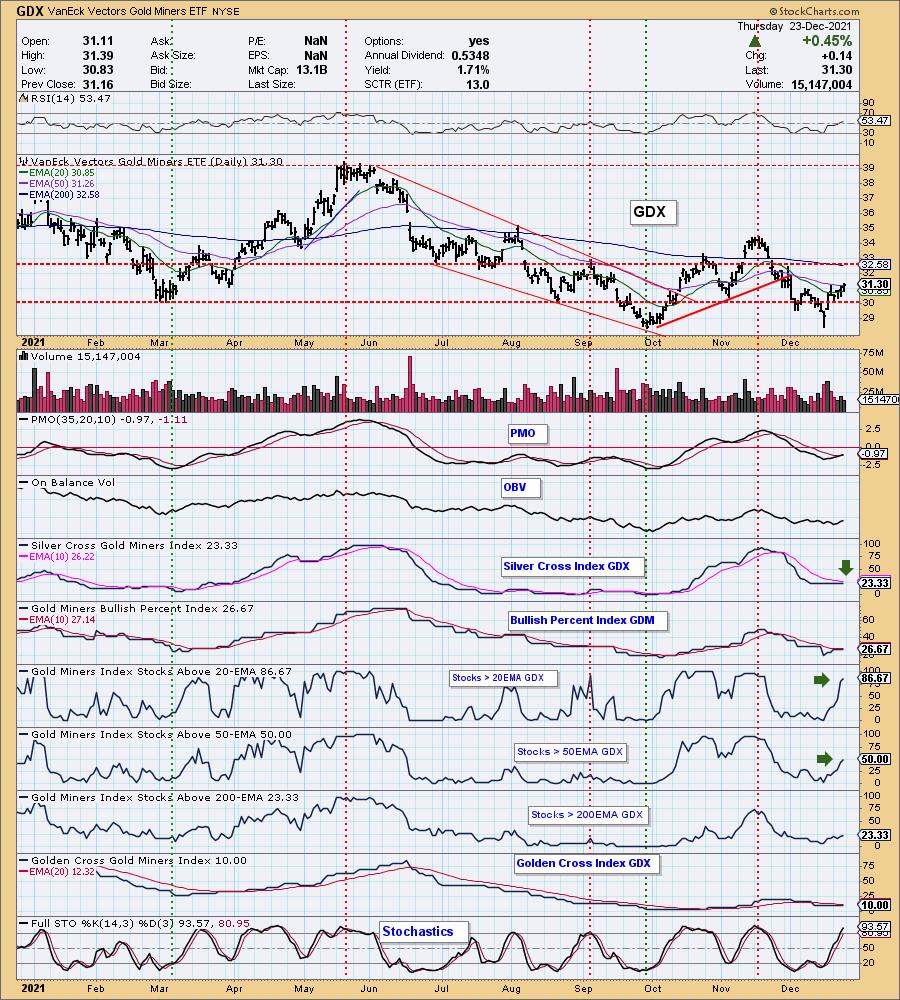
The "Industry Group to Watch" is going to be Gold Miners (GDX). They are reversing and we are fortunate to have participation numbers for this group and based on that, there is a strong bullish bias happening in this group so it was an easy choice. However, there were a few other groups you might want to watch. Coal still looks very bullish with my favorite stocks being AMR, ARCH and HCC. As far as Gold Miners, my favorite stocks based on the charts would be IAG, SSRM, NEM and AUY.
Next week is also shortened by the observance of New Year's on Friday, so I will hold the Diamond Mine trading room on THURSDAY again. The link to register is below.
Have a very Merry Christmas! The next Diamonds report will be on Tuesday of next week.

RECORDING LINK Friday (12/17):
Topic: DecisionPoint Diamond Mine (THURSDAY, 12/23/2021) LIVE Trading Room
Start Time: Dec 23, 2021 09:00 AM
Meeting Recording Link.
Access Passcode: Christmas@25
REGISTRATION FOR Thursday 12/23 Diamond Mine:
When: Dec 30, 2021 09:00 AM Pacific Time (US and Canada)
Topic: DecisionPoint Diamond Mine THURSDAY (12/30/2021) LIVE Trading Room
Register in advance for this webinar HERE.
Save the registration confirmation email with login instructions in case Zoom doesn't notify you in time.

Free DP Trading Room (12/20) RECORDING LINK:
Topic: DecisionPoint Trading Room
Start Time: Dec 20, 2021 09:00 AM
Meeting Recording Link.
Access Passcode: December@20
For best results, copy and paste the access code to avoid typos.
A few items about the spreadsheet: I've put on the spreadsheet whether the RSI is positive (green) or negative (red). The PMO column tells you if it is rising (green) or falling (red). Finally I've added my own "Sparkle Factor" that gives you my assessment going forward, bullish (green), bearish (red) or neutral (gray). The Sparkle Factor is basically my thoughts on whether I expect it to rise or fall. A neutral means it could really go either way so it could be added to a watch list. If you're in a stock I consider "neutral" going forward, the ball is in your court.
Darling:
BioLife Solutions Inc. (BLFS)
EARNINGS: 2/10/2022 (AMC)
BioLife Solutions, Inc. engages in the development, manufacture and marketing of bio preservation tools for cells and tissues. Its product offerings include proprietary hypothermic storage and cryopreservation freeze media products for cells, tissues, and organs, generic blood stem cell freezing and cell thawing media products and custom product formulation and custom packaging services. The company was founded by Boris Rubinsky in 1987 and is headquartered in Bothell, WA.
Predefined Scans Triggered: P&F Double Top Breakout and P&F Bearish Signal Reversal.
Below are the commentary and chart from yesterday (12/22):
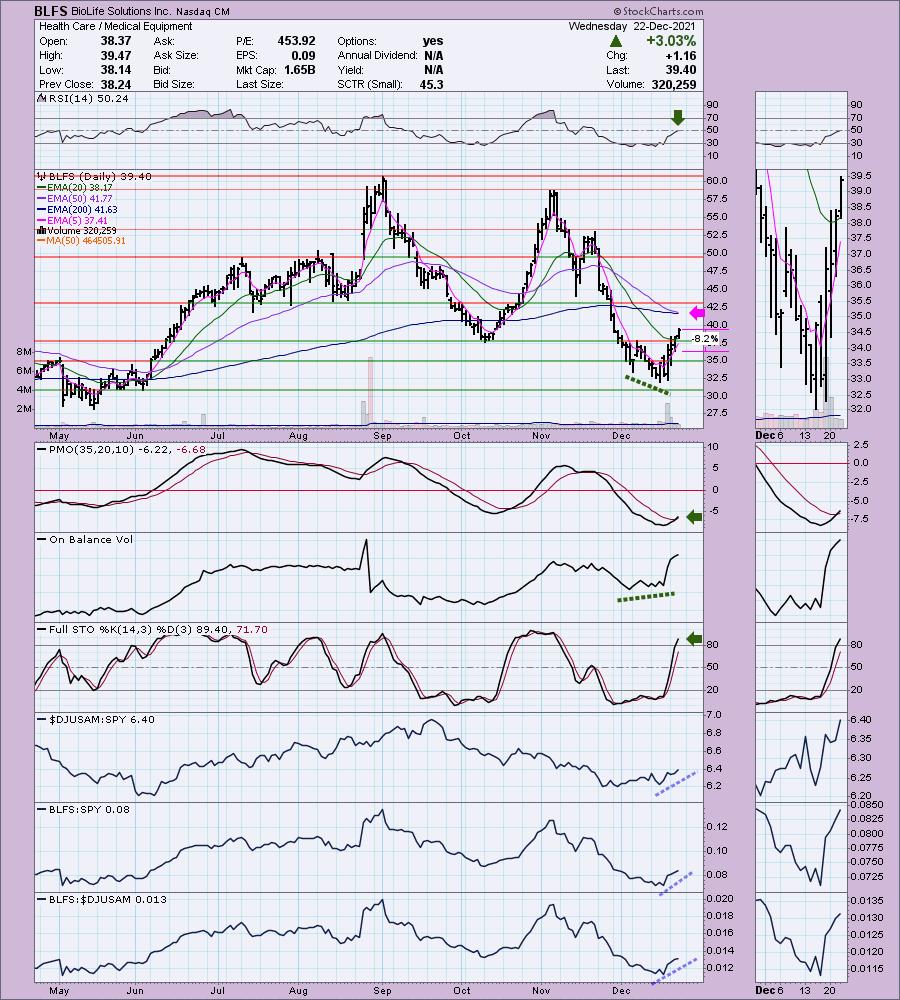
"BLFS is unchanged in after hours trading. I covered BLFS back on July 7th 2020. The position is still open and is up 124.1%. One I wish I'd bought for sure. It's lining up favorably again. The one major detractor is the "Death Cross" of the 50/200-EMAs which appears imminent. The rest of the chart looks great. The RSI just hit positive territory. The PMO just triggered a crossover BUY signal and Stochastics are rising strongly above 80. There is a very positive OBV divergence leading into the current rally. Relative strength studies are bullish. The stop is set at 8.2% which would bring price to the middle of the support resistance zone I annotated between the April top and October bottom."
Here is today's chart:
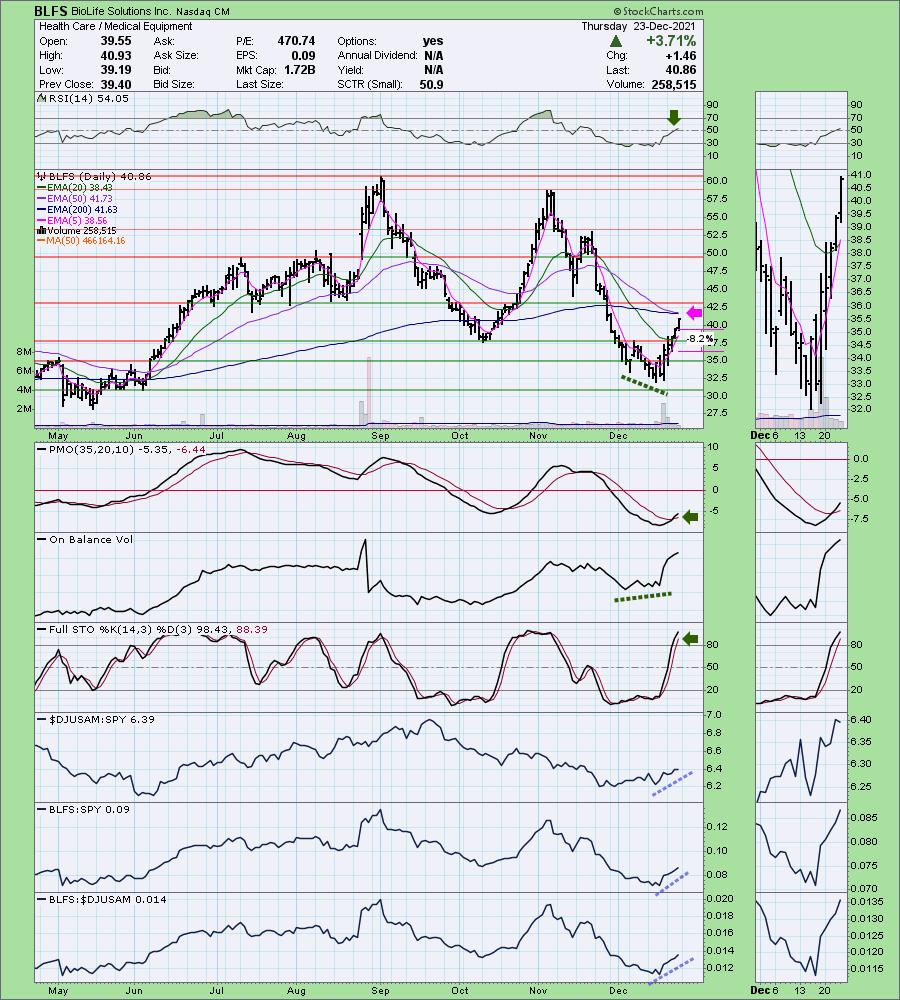
The chart still looks very bullish. The PMO has a crossover BUY signal and the RSI has hit positive territory. The only detractor is the "Death Cross" that is lining up as the 50-EMA is nearing a negative crossover the 200-EMA. Still, if price can get above the 200-EMA, which it looks like it will do, the "Death Cross" might be avoided.
Don't forget, on Thursdays I look at reader-requested symbols, so shoot me an email at erin@decisionpoint.com. I read every email I receive and try to answer them all!
Dud:
Agilent Technologies, Inc. (A)
EARNINGS: 2/15/2022 (AMC)
Agilent Technologies, Inc. engages in the provision of application focused solutions for life sciences, diagnostics, and applied chemical markets. It operates through the following segments: Life Sciences and Applied Markets; Diagnostics and Genomics; and Agilent CrossLab. The Life Sciences and Applied Markets segment offers application-focused solutions that include instruments and software that enable to identify, quantify, and analyze the physical and biological properties of substances and products, as well as the clinical and life sciences research areas to interrogate samples at the molecular and cellular level. The Diagnostics and Genomics segment consists of activity providing active pharmaceutical ingredients for oligo-based therapeutics, as well as solutions that include reagents, instruments, software and consumables. The Agilent CrossLab segment includes startup, operational, training and compliance support, software as a service, and asset management and consultative services. The company was founded in May 1999 and is headquartered in Santa Clara, CA.
Predefined Scans Triggered: New CCI Buy Signals and Entered Ichimoku Cloud.
Below are the commentary and chart from yesterday (12/22):
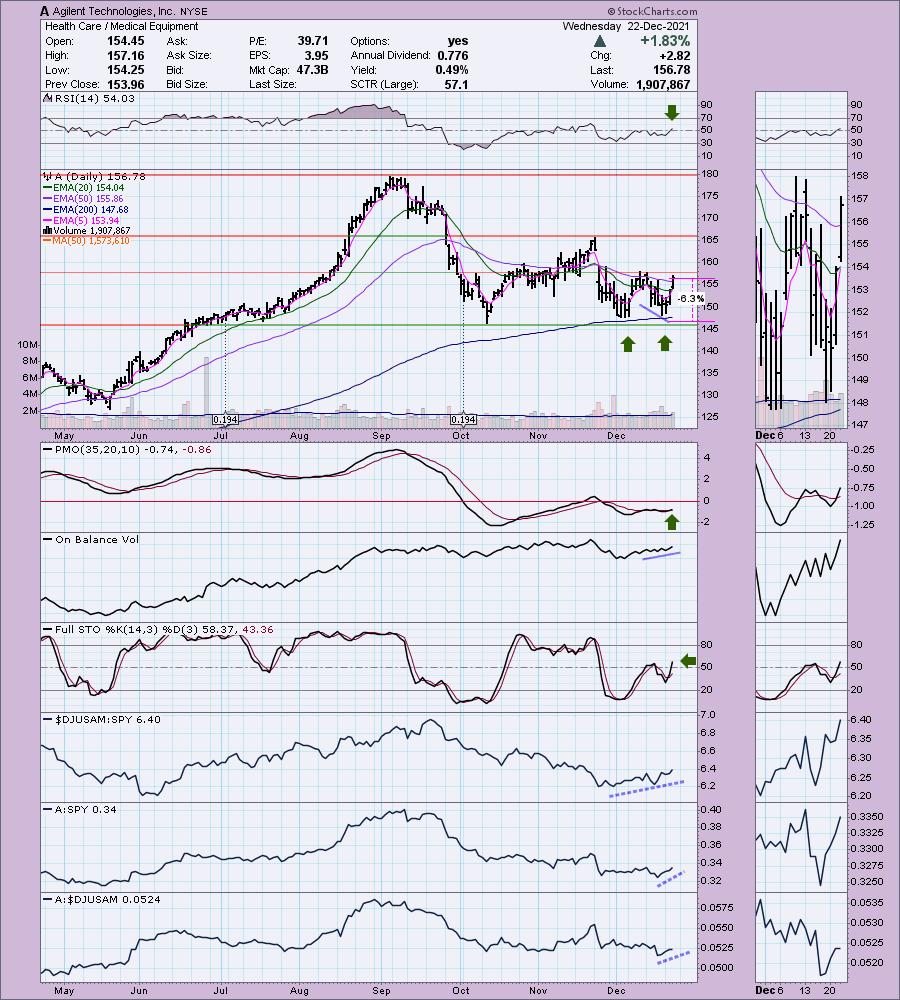
"A is down -0.26% in after hours trading. Price broke out above the 50-EMA, but hasn't quite executed the bullish double-bottom pattern. It will need to get above the December high to do that. The chart is configured positively so I believe it will trigger the pattern soon. The RSI just moved into positive territory and the PMO just generated a crossover BUY signal. Stochastics are rising and are in positive territory. I like the short-term positive OBV divergence. Those positive divergences typically lead to a sustained rally. Relative strength for the industry group is improving. A is outperforming both the group and the SPY. I set the stop below the 200-EMA and double-bottoms."
Below is today's chart:
I hesitated to give this one a red ChartStyle since the chart is still quite bullish. We didn't get price to close above the confirmation line of the double-bottom, but intraday it did break above it. Other than that, the chart is still bullish and I like A moving forward.
THIS WEEK's Sector Performance:
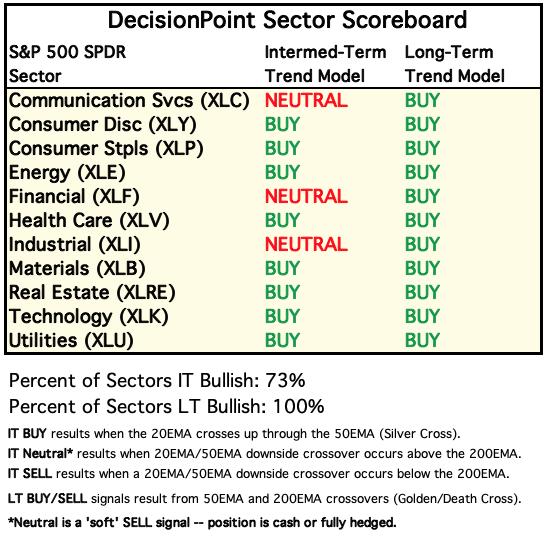
DecisionPoint Sector Scoreboard (Mechanical Trend Model Signals):
Click Hereto view Carl's annotated Sector ChartList!
Short-term RRG: The defensive sectors are still the only sectors in Leading with XLRE and XLU beginning to turnover and head toward Weakening. XLC is making a comeback as it heads toward Leading out of Improving. XLY is turning the corner in Lagging, but still isn't moving in the bullish northeast direction. XLF, XLI and XLE don't look promising. There is hope for XLB which could hit Leading next week.
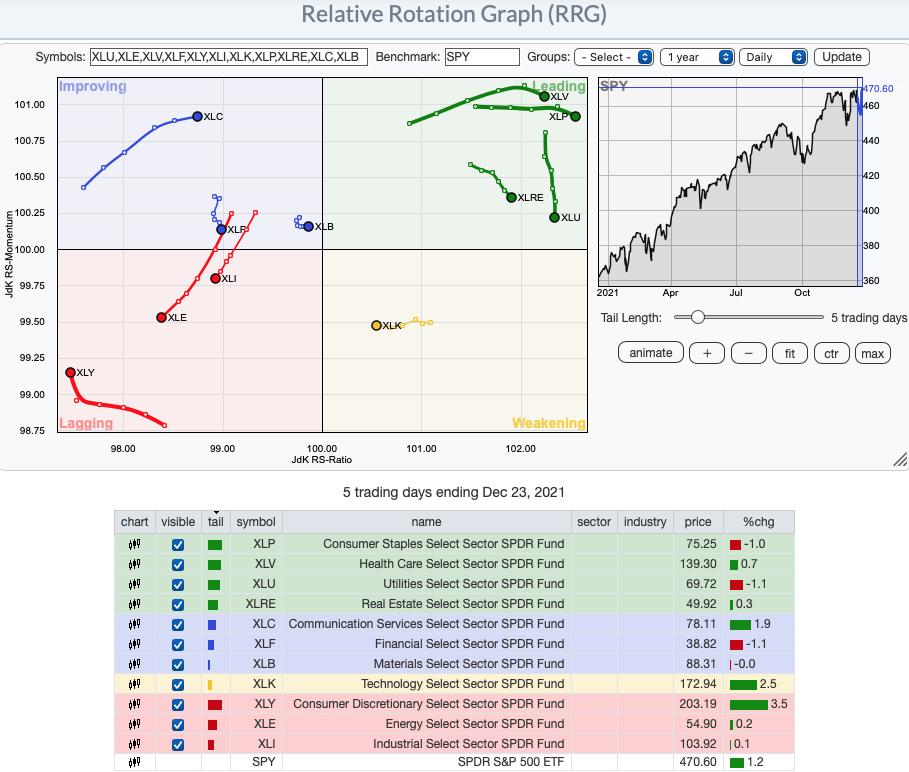
Intermediate-Term RRG: In the longer term, XLC is still Lagging, but it is at least righting the ship on the daily RRG. XLV, XLB, XLRE, XLP and XLU are traveling toward Leading out of Improving which is bullish. XLK is improving its position in Leading, while XLE and XLY have begun to move toward Weakening. XLI and XLF look the most bearish as they have a southwest heading.
Sector to Watch: Communication Services (XLC)
The only detractor is that price is stuck beneath strong overhead resistance at the 50-EMA that aligns with April high and October lows. Additionally, if the market turns over, this sector may lose upside momentum. Other than that, I like this reversal and move back above the 20-EMA and 200-EMA. The PMO is on an oversold BUY signal and rising. The SCI is flat, but above its signal line. Given the massive participation improvement, the SCI should easily rise. More stocks are beginning to recapture the 200-EMA as support. Stochastics are strong and rising. The OBV isn't great, but volume is coming in.
Industry Group to Watch: Gold Miners (GDX)
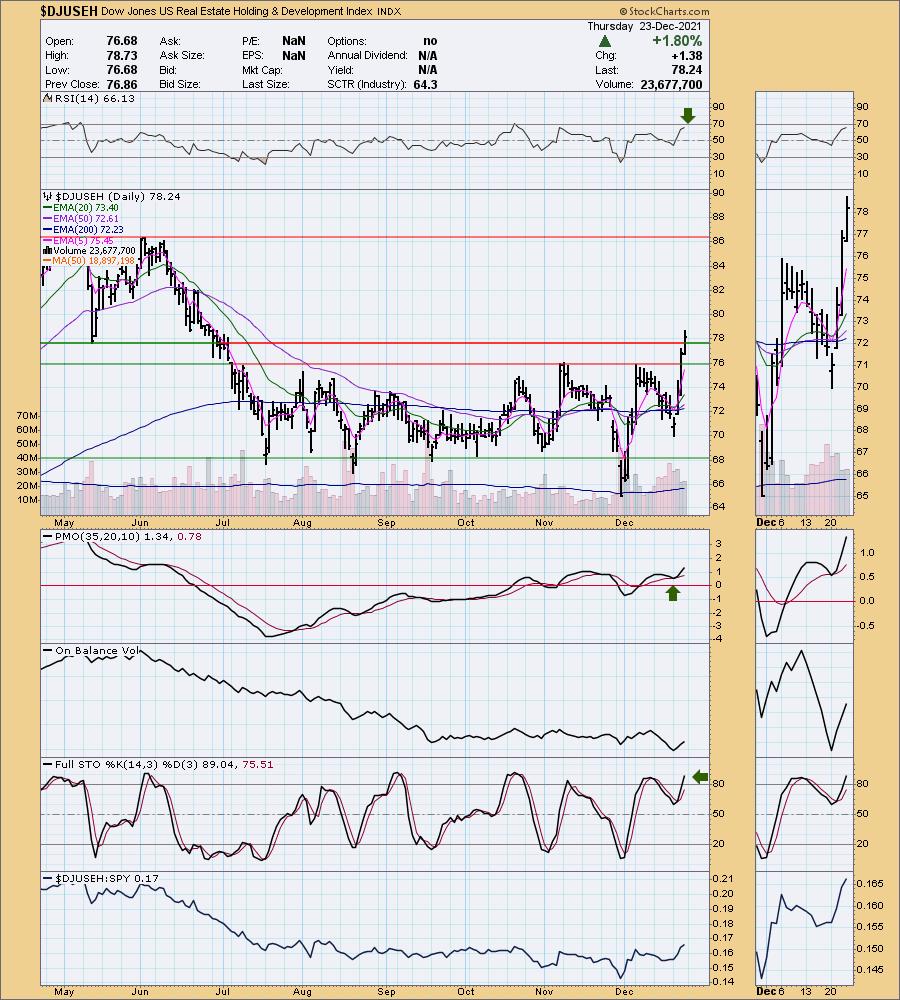
This was an easy pick, but in the Diamond Mine I also noted that Real Estate Holdings ($DJUSEH) looked very promising too so I've included that chart below GDX. I also still like Coal.
Today price closed above the 50-EMA. The PMO triggered a crossover BUY signal today as well. What has impressed me most is the upward thrust in participation of stocks > 20/50-EMAs. Those readings are well-above the Silver Cross Index (SCI) reading which gives Gold Miners a very bullish bias going into next week. The RSI is now in positive territory. Stochastics are now above 80 and are still rising strongly.
Gold Miners that are on my watch list: IAMGOLD (IAG), SSR Mining (SSRM), Newmont Corp (NEM) and Yamana Gold (AUY). Please note that IAG and AUY are priced very low, so position size wisely.
I love the breakouts above $76 or November/December highs and the May low at $78. The PMO whipsawed into a crossover BUY signal and is not overbought. The RSI is positive and also not overbought. Stochastics are strongly rising above 80 and relative performance is improving. The OBV doesn't thrill me, but it's not a deal breaker.
Go to our Sector ChartList on DecisionPoint.com to get an in depth view of all the sectors.
Technical Analysis is a windsock, not a crystal ball.
Have a very Merry Christmas! The next Diamonds Report is Tuesday 12/21.
- Erin
erin@decisionpoint.com
Full Disclosure: I'm about 10% exposed to the market.
Watch the latest episode of DecisionPoint with Carl & Erin Swenlin on Mondays 7:00p EST or on the DecisionPoint playlist on the StockCharts TV YouTube channel here!
NOTE: The stocks reported herein are from mechanical trading model scans that are based upon moving average relationships, momentum and volume. DecisionPoint analysis is then applied to get five selections from the scans. The selections given should prompt readers to do a chart review using their own analysis process. This letter is not a call for a specific action to buy, sell or short any of the stocks provided. There are NO sure things or guaranteed returns on the daily selection of "diamonds in the rough."
Helpful DecisionPoint Links:
DecisionPoint Shared ChartList and DecisionPoint Chart Gallery
Price Momentum Oscillator (PMO)
Swenlin Trading Oscillators (STO-B and STO-V)
(c) Copyright 2021 DecisionPoint.com