
The big problem I see right now is overhead resistance. What do I mean? While going through the scan results, I noticed that most of the charts showed price balking at overhead resistance--all-time highs or key moving averages. Santa Claus came to town, but like in our homes, the tree and tinsel will come down after the new year for this rally. There are too many negative divergences and too much overhead resistance on the majority of stocks.
On Friday I discussed bottom fishing in the Communications Services (XLC) sector. I had a few stocks in my scan results from this sector, but I only found one that I thought should be included in my write up today. The majority are in the Industrials (XLI) and Materials (XLB) sectors.
Don't forget that this week's Diamond Mine trading will be held THURSDAY! Registration information is below.
THIS WEEK's HOLIDAY SCHEDULE:
I will present five "Diamonds in the Rough" Tuesday/Wednesday. On Thursday, we will hold the Diamond Mine and I will do a Recap of the ten stocks picked this week.
Today's "Diamonds in the Rough": ATR, AVNT, EXP, RMBL and SITE.
"Stocks to Review": HAFC, GAIN, AX, GT, KKR, OLN, PDFS, UNVR and OC.

RECORDING LINK Friday (12/23):
Topic: DecisionPoint Diamond Mine (THURSDAY, 12/23/2021) LIVE Trading Room
Start Time: Dec 23, 2021 09:00 AM
Meeting Recording Link.
Access Passcode: Christmas@25
REGISTRATION FOR Thursday 12/30 Diamond Mine:
When: Dec 30, 2021 09:00 AM Pacific Time (US and Canada)
Topic: DecisionPoint Diamond Mine THURSDAY (12/30/2021) LIVE Trading Room
Register in advance for this webinar HERE.
Save the registration confirmation email with login instructions in case Zoom doesn't notify you in time.

Free DP Trading Room (12/27) RECORDING LINK:
Topic: DecisionPoint Trading Room
Start Time: Dec 27, 2021 09:00 AM
Meeting Recording Link.
Access Passcode: Holiday@2
For best results, copy and paste the access code to avoid typos.
Welcome to DecisionPoint Daily Diamonds, wherein I highlight ten "Diamonds in the Rough" per week. These are selected from the results of my DecisionPoint scans, which search for stocks that could benefit from the trend and condition of the market. Remember, these are not recommendations to buy or sell, but are the most interesting of the stocks that surfaced in my scans. My objective is to save you the work of the initial, tedious culling process, but you need to apply your own analysis to see if these stocks pique your interest as well. There are no guaranteed winners here!
Aptargroup, Inc. (ATR)
EARNINGS: 2/17/2022 (AMC)
AptarGroup, Inc. develops manufactures and sales of consumer product dispensing systems. It operates through the following business segments: Beauty & Home, Pharma and Food & Beverage. The Beauty & Home segment primarily sells pumps, aerosol valves and accessories to the personal care and household markets and pumps and decorative components to the fragrance/cosmetic market. The Pharma segment supplies pumps and metered dose inhaler valves to the pharmaceutical market worldwide. The Food & Beverage segment sell dispensing and non-dispensing closures and, to a lesser degree, spray pumps and aerosol valves to the food and beverage markets. The company was founded in 1940 and is headquartered in Crystal Lake, IL.
Predefined Scans Triggered: New CCI Buy Signals.
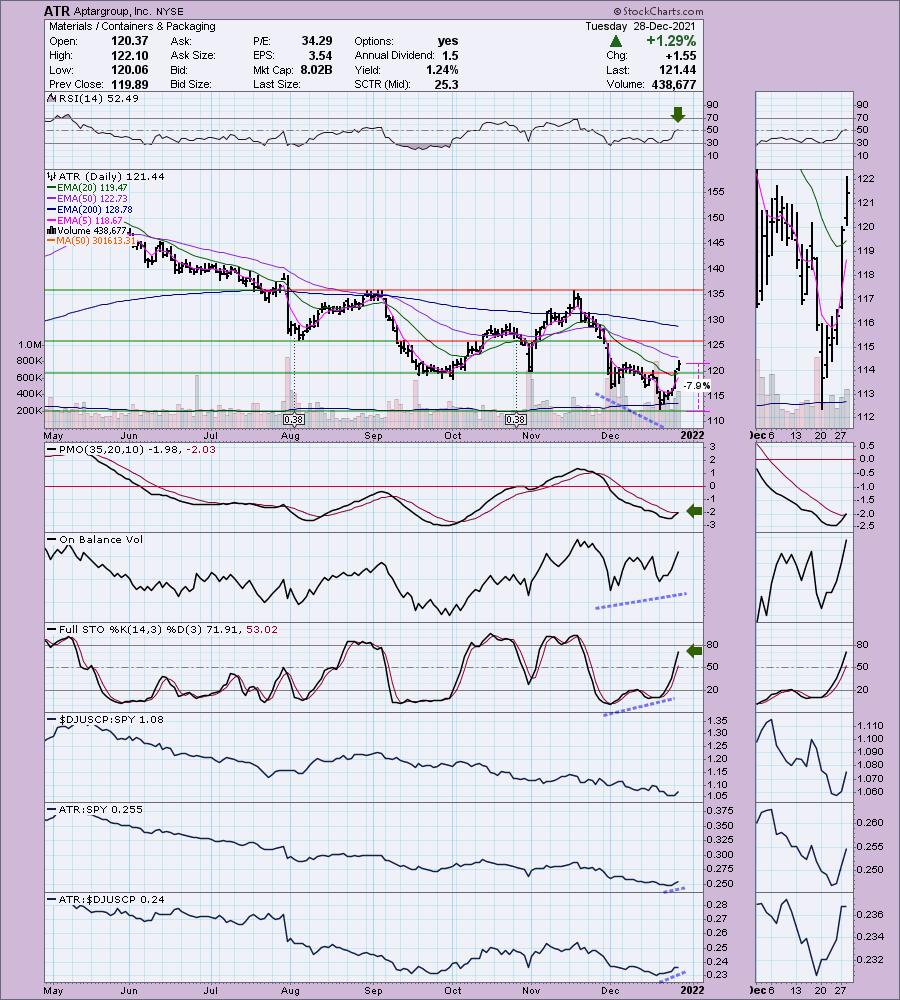
ATR is unchanged in after hours trading. This is definitely my favorite chart of the day and a stock that I may take a small position in depending on how the market and this stock acts on a 5-min candlestick. I like the follow-through on yesterday's breakout above the 20-day EMA. The rally has also put price above the October/November low. The PMO just triggered a new BUY signal and the RSI is now positive. There is a VERY strong OBV positive divergence leading into this rally and we also see Stochastics with a positive divergence with price lows. Stochastics are also rising strongly and nearing 80. The group is in the doldrums. ATR could be ready to outperform after this week's breakout. The stop is set below support at the December low.
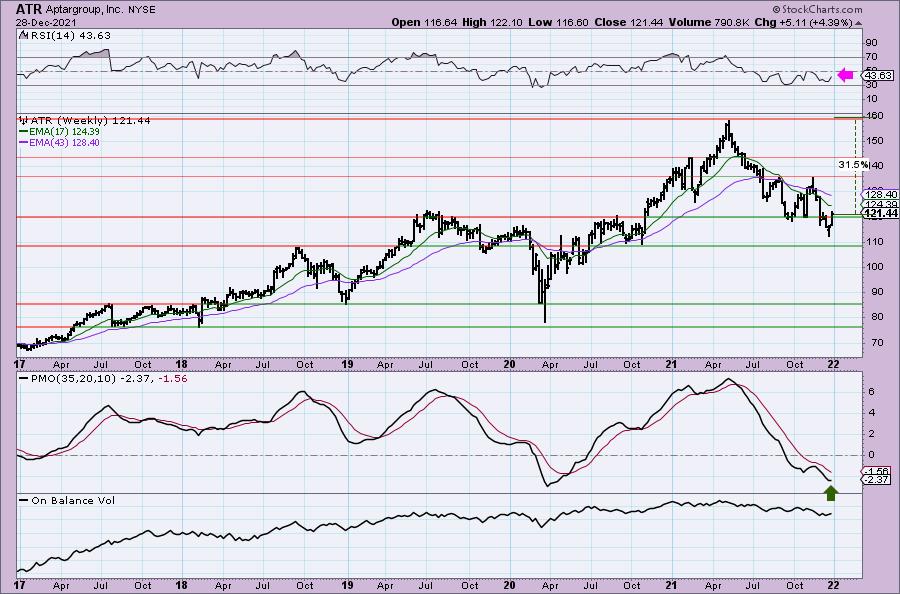
Price reversed before testing support just below $110 which is bullish. The RSI is negative but at least rising right now. The weekly PMO has turned up. Upside potential is excellent.
Avient Corporation (AVNT)
EARNINGS: 2/8/2022 (BMO)
Avient Corp. engages in the business of thermoplastic compounds. It specializes in polymer materials, services, and solutions with operations in specialty polymer formulations, color and additive systems, plastic sheet and packaging solutions and polymer distribution. The firm is also involved in the development and manufacturing of performance enhancing additives, liquid colorants, fluoropolymers and silicone colorants. It operates through the following segments: Color, Additives and Inks; Specialty Engineered Materials; and Distribution. The Color, Additives and Inks segment provides custom color and additive concentrates in solid and liquid form for thermoplastics, dispersions for thermosets, speciality inks, plasticols, and vinyl slush molding solutions. The Specialty Engineered Materials segment makes polymer formulations, services, and solutions for designers, assemblers, and processors of thermoplastic materials. The Distribution segment distributes engineering and commodity grade resins, including PolyOne-produced solutions, principally to the North American, Central American, and Asian markets. The firm's products include polymer distribution, screen printing inks, and thermoplastic elastomers. Its services include IQ design and color services. The company was founded on August 31, 2000 and is headquartered in Avon Lake, OH.
Predefined Scans Triggered: P&F Low Pole.
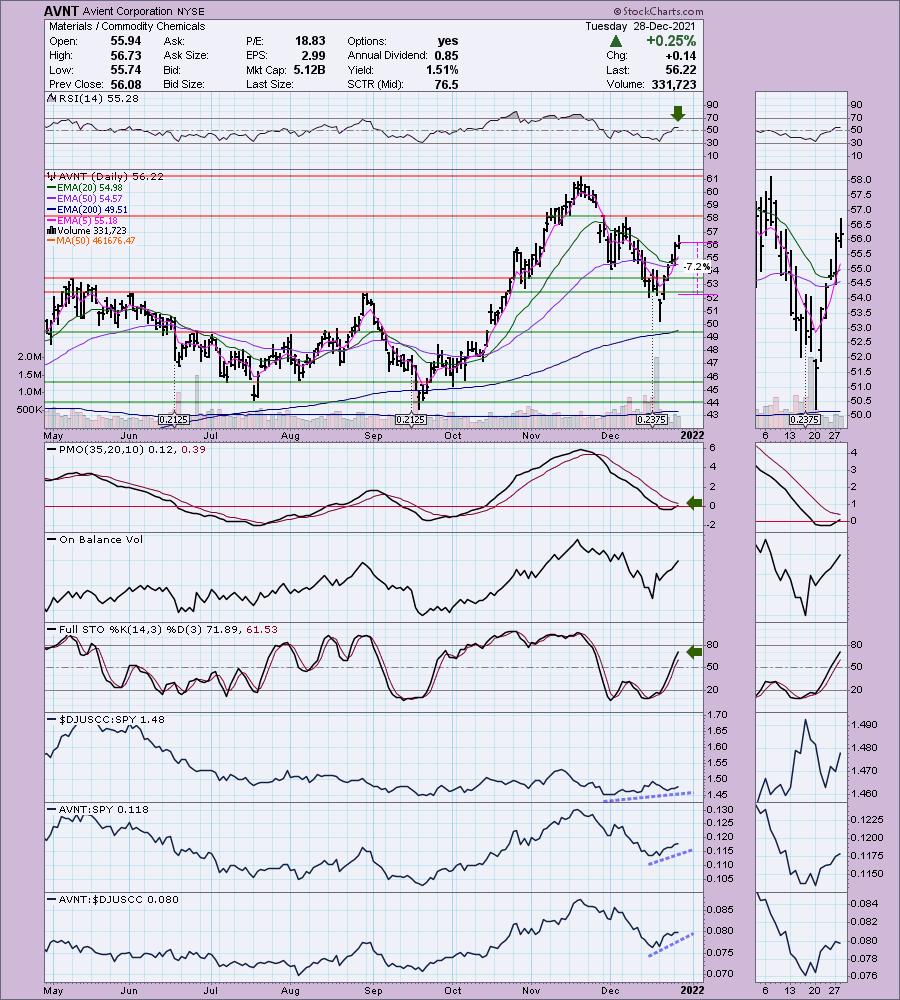
AVNT is unchanged in after hours trading. I covered AVNT on February 11th 2021. The position is still open and up +29.8% currently. We have a "V" bottom pattern that has retraced nearly half of the decline. The pattern is bullish and suggests a breakout above the November top. It triggered a ST Trend Model BUY signal as the 5-day EMA has crossed above the 20-day EMA. Price broke above the 5/20/50-day EMAs. The PMO is curling upward toward a crossover BUY signal. Stochastics are rising and positive. Relative strength studies are bullish. The stop is set below the August top.
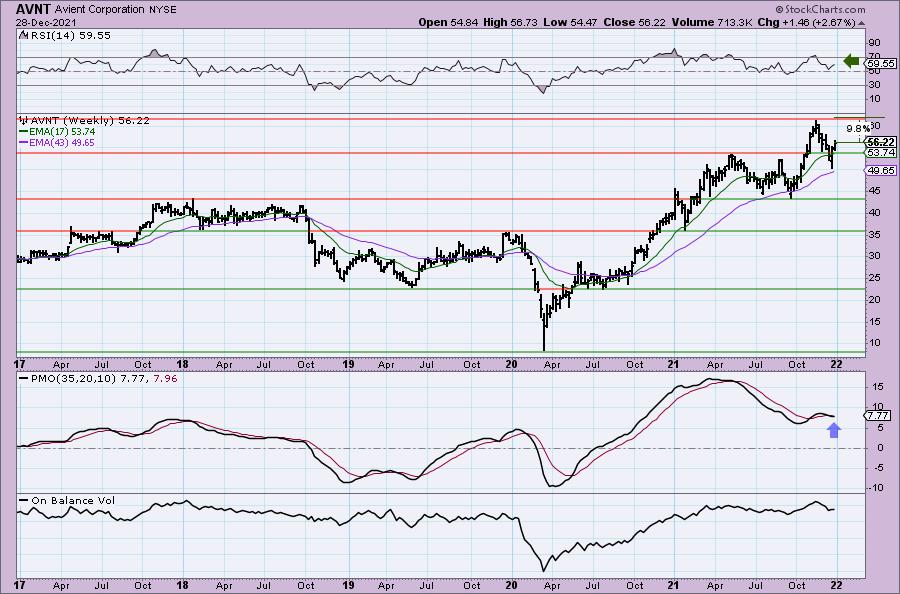
The weekly RSI is positive and rising. The weekly PMO is flat, but could trigger a BUY signal soon, especially if price rises as I believe it will. It's near all-time highs so I would suggest an upside target of 19% (double the distance to all-time highs) at $66.90.
Eagle Materials Inc. (EXP)
EARNINGS: 1/27/2022 (BMO)
Eagle Materials, Inc. engages in the provision of heavy construction materials and light building materials. It operates through the following segments: Cement, Concrete and Aggregates, Gypsum Wallboard, and Recycled Paperboard. The Cement segment deals with the manufacture, production, distribution, and sale of portland cement. The Concrete and Aggregates segment involves in mixing cement, sand, gravel, or crushed stone and water to form concrete, which is then sold and distributed to construction contractors. The Gypsum Wallboard segment mines and extracts natural gypsum rock, which is used in the manufacture of gypsum wallboard. The Recycled Paperboard segment processes paper fiber, water, and paper chemicals to form recycled paperboards, then sell them to gypsum wallboard manufacturers. The company was founded in 1963 and is headquartered in Dallas, TX.
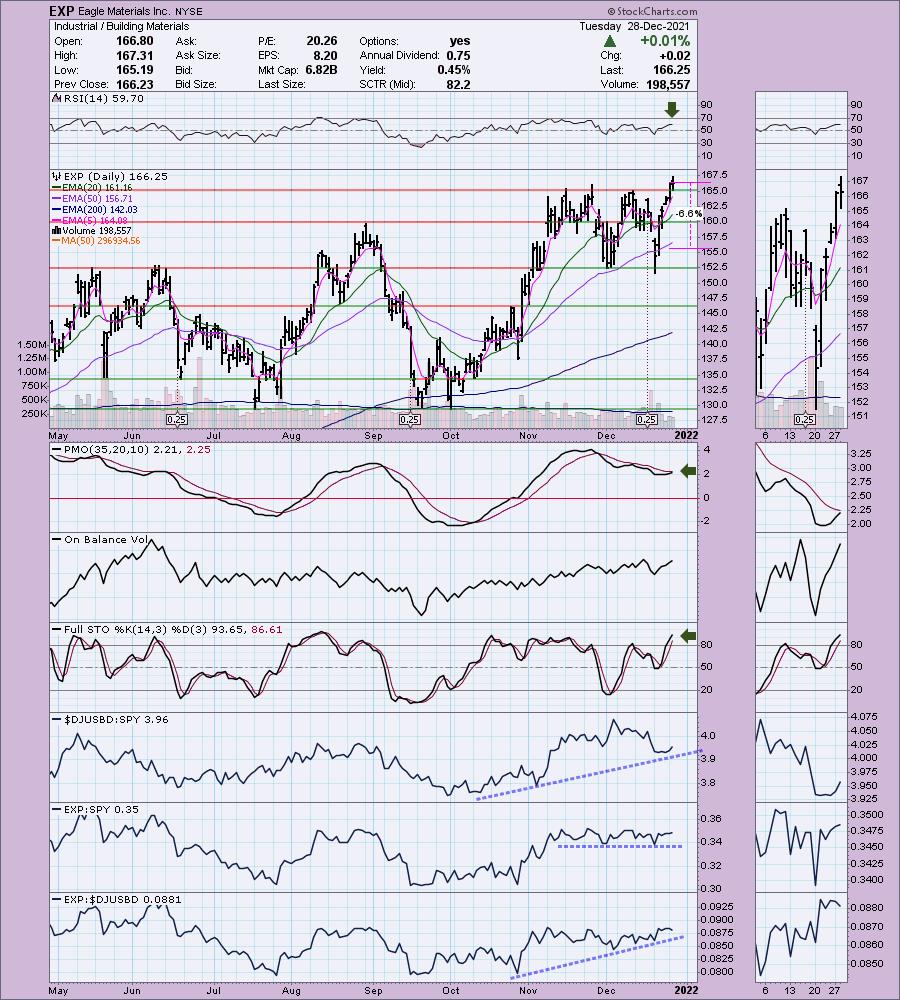
Predefined Scans Triggered: New 52-week Highs, Filled Black Candles and P&F Double Top Breakout.
EXP is unchanged in after hours trading. Price broke out yesterday above resistance at $165. Today we saw follow-through in that it traded above that prior resistance level all day. The PMO is nearing a crossover BUY signal and the RSI is positive. Stochastics are above 80 and still rising. Relative strength for EXP is on par with the SPY which is actually a bit of a detractor going into January (I'm bearish on the market). Still this was a powerful rally and breakout and the group itself is beginning to outperform and EXP often outperforms the group. The stop is set under the 50-day EMA.
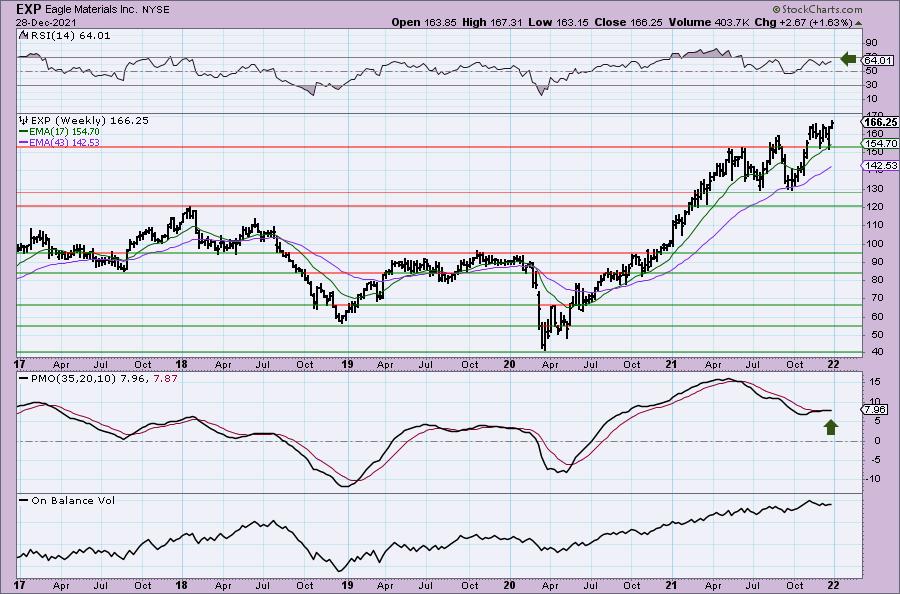
The weekly PMO is on a crossover BUY signal now. The weekly RSI is positive. Given price is at all-time highs, consider an upside target of 15% (a little more than double the stop percentage) at $191.19.
RumbleOn, Inc. (RMBL)
EARNINGS: 3/14/2022 (BMO)
RumbleOn, Inc. engages in the provision of motor vehicle dealer and e-commerce platform. It operates through the following segments: Powersports; Automotive; and Vehicle Logistics and Transportation. The Powersports segment distributes pre-owned motorcycles and powersports vehicles. The Automotive segment focuses on the distribution of pre-owned cars and trucks. The Vehicle Logistics and Transportation segment offers nationwide automotive transportation services between dealerships and auctions. The company was founded by Matthew A. Lane, Marshall Chesrown, and Steven Richard Berrard on October 24, 2013 and is headquartered in Irving, TX.
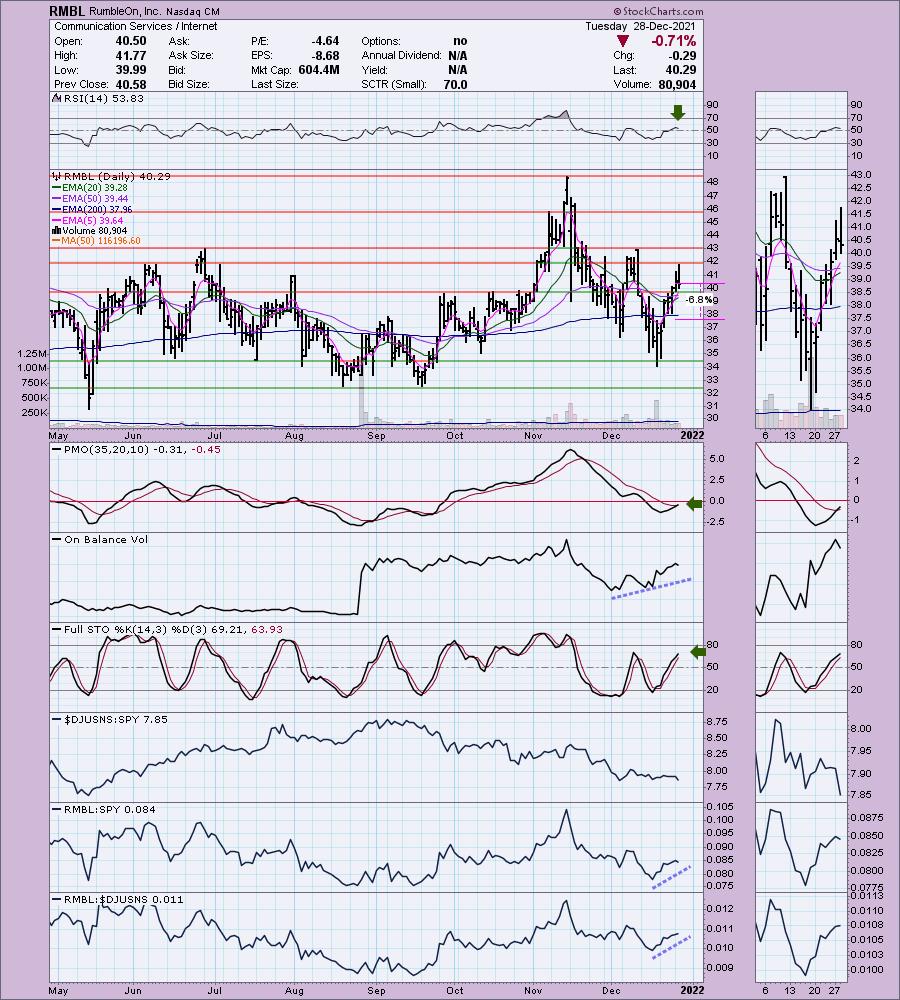
Predefined Scans Triggered: Moved Below Ichimoku Cloud.
RMBL is unchanged in after hours trading. What caught my eye on this one was the strong OBV positive divergence. The PMO triggered a crossover BUY signal today. Stochastics are rising strongly in positive territory above net neutral (50). It is showing great relative strength right now. The stop level is just below the 200-day EMA.
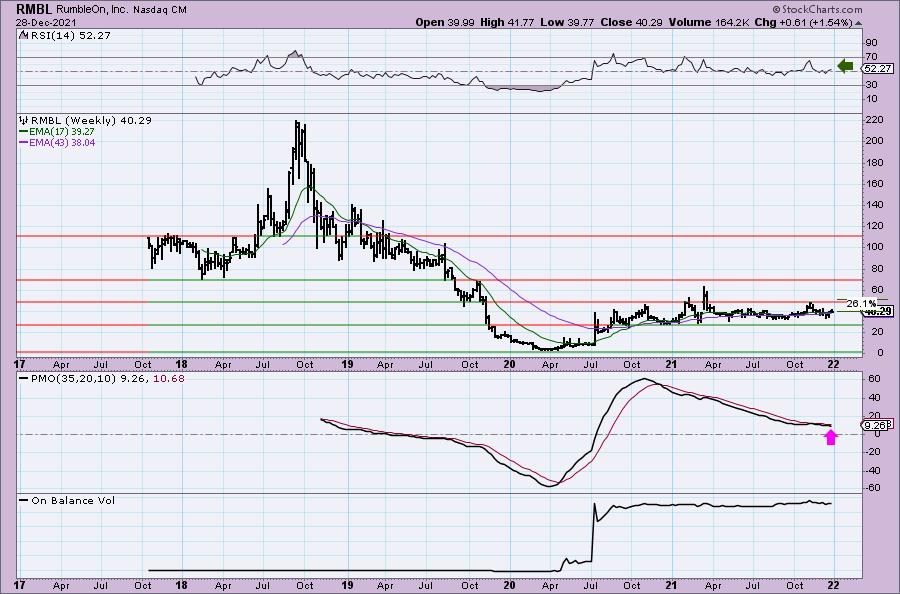
It has been trading in a price channel between $30 and $50. It is midway in the range so if it can just test the top of this range, that would be a more than 25% gain. I do not like the weekly PMO yes, but it is flat and not declining steeply.
SiteOne Landscape Supply, Inc. (SITE)
EARNINGS: 2/23/2022 (BMO)
SiteOne Landscape Supply, Inc. engages in the distribution of commercial and residential landscape supplies. Its products include outdoor lighting, nursery, landscape supplies, fertilizers, turf protection products, grass seed, turf care equipment, and golf course accessories for green industry professionals. The company was founded in 2001 and is headquartered in Roswell, GA.
Predefined Scans Triggered: Bullish MACD Crossovers and P&F Low Pole.
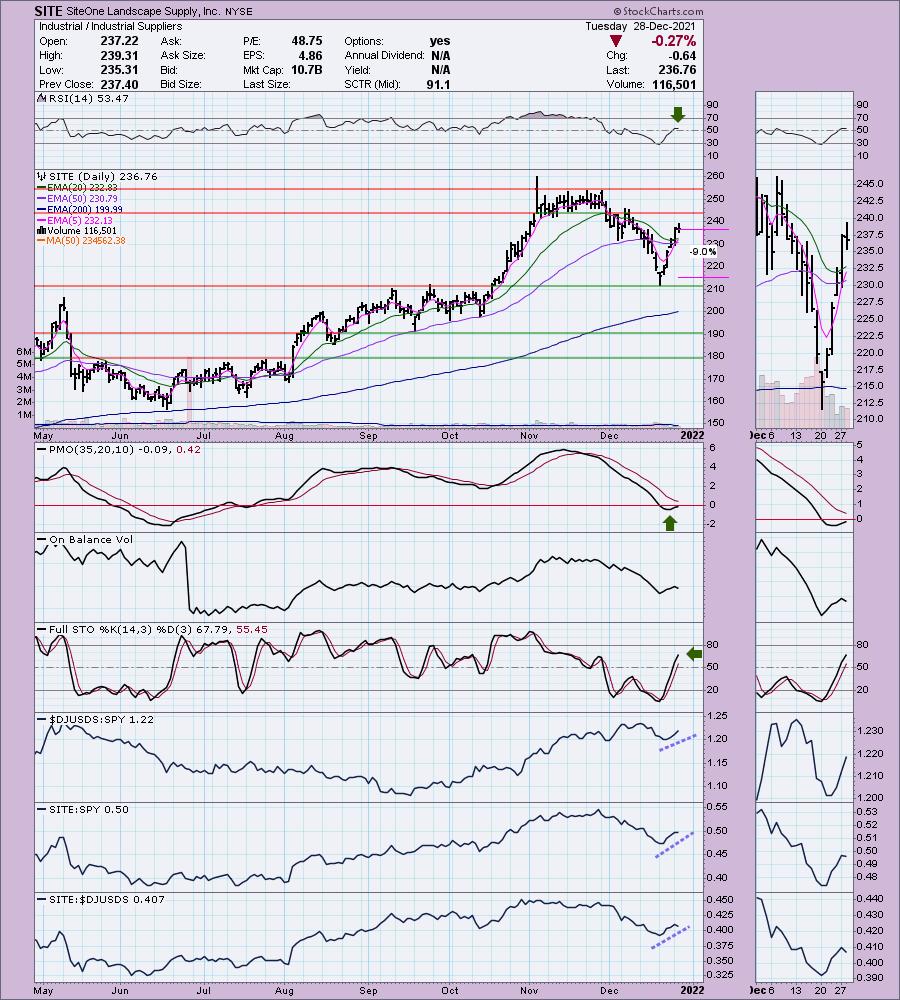
SITE is unchanged in after hours trading. I covered SITE on September 29th 2020. The stop was never hit so the position is currently up +95.0%. We have a bullish "V" bottom that is already confirmed and underway (price needs to retrace 1/3rd of prior decline to confirm the pattern). The RSI is positive. The PMO is rising and is nearing both positive territory and a crossover BUY signal. Stochastics are rising strongly in positive territory and relative strength studies are positive. The stop is deeper than I normally like, but it is set at the closing low from last Monday.
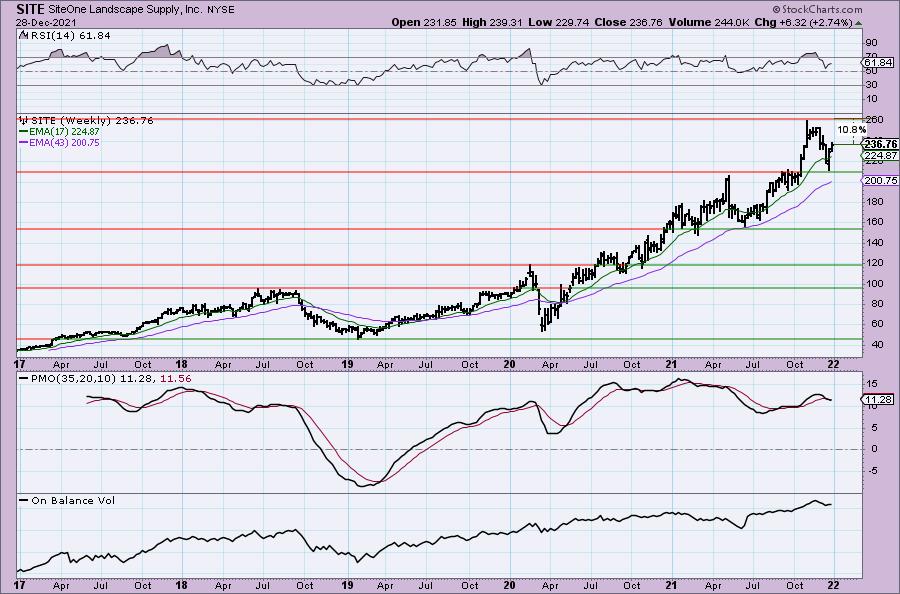
The weekly PMO is a problem, but it is flattening. The weekly RSI is positive. Since price is so close to all-time highs, I would consider setting an upside target of 18% (double the stop percentage) at $279.38.
Don't forget, on Thursdays I look at reader-requested symbols, click HERE to shoot me an email. I read every email I receive and try to answer them all!
Current Market Outlook:
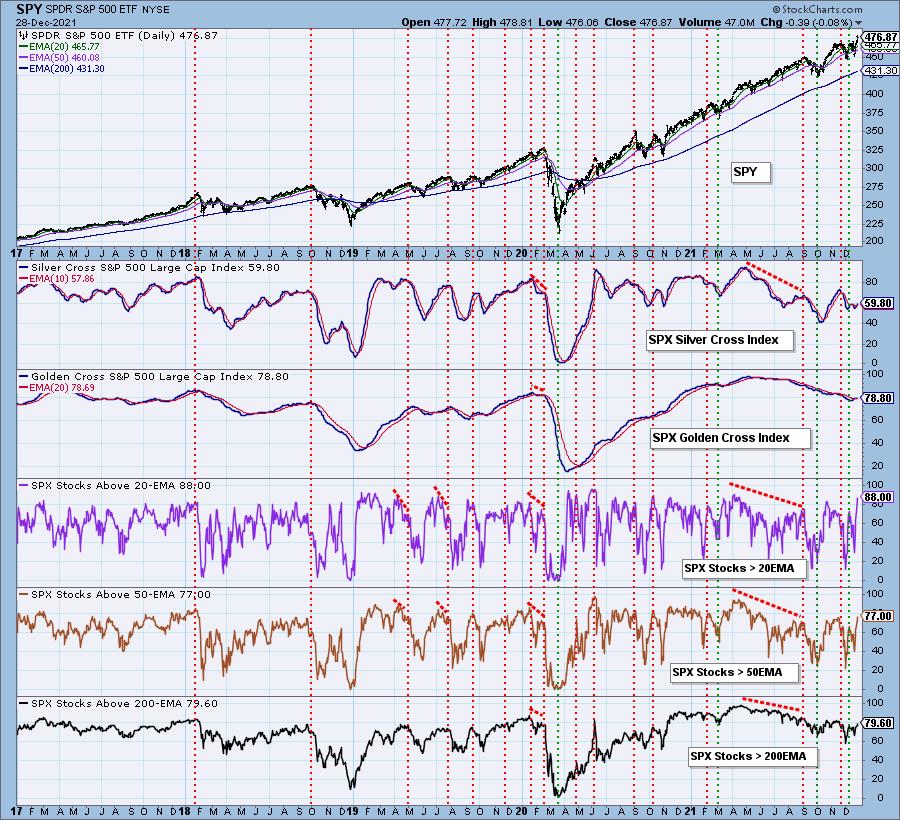
Market Environment: It is important to consider the odds for success by assessing the market tides. The following chart uses different methodologies for objectively showing the depth and trend of participation for intermediate- and long-term time frames.
- The Silver Cross Index (SCI) shows the percentage of SPX stocks on IT Trend Model BUY signals (20-EMA > 50-EMA)
- The Golden Cross Index (GCI) shows the percentage of SPX stocks on LT Trend Model BUY signals (50-EMA > 200-EMA)
Don't forget that as a "Diamonds" member, you have access to our GCI/SCI curated ChartList on DecisionPoint.com. You'll find it under "Members Only" links on the left side on the Blogs and Links Page.
Here is the current chart:
Full Disclosure: I'm 10% invested and 90% is in 'cash', meaning in money markets and readily available to trade with. I might buy ATR depending on the state of the market and its 5-minute candlestick chart tomorrow.
I'm required to disclose if I currently own a stock and/or may buy it within the next 72 hours.
Happy Charting!
- Erin
erin@decisionpoint.com
Technical Analysis is a windsock, not a crystal ball.
Watch the latest episode of DecisionPoint with Carl & Erin Swenlin on Mondays 7:00p EST or on the DecisionPoint playlist on the StockCharts TV YouTube channel here!
NOTE: The stocks reported herein are from mechanical trading model scans that are based upon moving average relationships, momentum and volume. DecisionPoint analysis is then applied to get five selections from the scans. The selections given should prompt readers to do a chart review using their own analysis process. This letter is not a call for a specific action to buy, sell or short any of the stocks provided. There are NO sure things or guaranteed returns on the daily selection of "Diamonds in the Rough."
Helpful DecisionPoint Links:
DecisionPoint Shared ChartList and DecisionPoint Chart Gallery
Price Momentum Oscillator (PMO)
Swenlin Trading Oscillators (STO-B and STO-V)
For more links, go to DecisionPoint.com