
Today I presented at the Westmark Trading and Trade Thirsty "Bull Bear Summit". I discussed Climax Analysis and Participation. I had a great time and I think you'll really enjoy it. You can get the recording if you download the "Naughty or Nice" eBook I've been advertising. Your support is always appreciated!
More Biotechs hit my scans and it was another day of hard decisions as to what to present. I opted to present two Biotechs, an Aerospace company and a Specialty Chemicals company. The charts are strong and so are those in the "Stocks to Review". I like to narrow down the list more, but I just couldn't wave goodbye to these stocks.
It was a long day yesterday due to recording a show during my normal writing hours and today will be a long one too since I presented at the conference during my writing hours as well. So, I may be a bit brief in my descriptions.
Today's "Diamonds in the Rough": CC, GBIO, RKLB and YMAB.
Stocks to Review: ESTE, WGO, SHAK, KELYA, AMPH, IDYA, CXW, REVG, SAGE and VINC.

RECORDING LINK Friday (10/29):
Topic: DecisionPoint Diamond Mine (10/29/2021) LIVE Trading Room
Start Time: Oct 29, 2021 09:00 AM
Meeting Recording LinkHERE.
Access Passcode: October@29
REGISTRATION FOR FRIDAY 11/5 Diamond Mine:
When: Nov 5, 2021 09:00 AM Pacific Time (US and Canada)
Topic: DecisionPoint Diamond Mine (11/5/2021) LIVE Trading Room
Register in advance for this webinar HERE.
Save the registration confirmation email with login instructions in case Zoom doesn't notify you in time.

Free DP Trading Room (10/25) RECORDING LINK:
Topic: DecisionPoint Trading Room
Start Time: Oct 25, 2021 09:00 AM
Meeting Recording LinkHERE.
Access Passcode: October#25
For best results, copy and paste the access code to avoid typos.
Welcome to DecisionPoint Daily Diamonds, wherein I highlight five "Diamonds in the Rough." These are selected from the results of my DecisionPoint scans, which search for stocks that could benefit from the trend and condition of the market. Remember, these are not recommendations to buy or sell, but are the most interesting of the stocks that surfaced in my scans. My objective is to save you the work of the initial, tedious culling process, but you need to apply your own analysis to see if these stocks pique your interest as well. There are no guaranteed winners here!
Chemours Co. (CC)
EARNINGS: 11/4/2021 (AMC)
The Chemours Co. is a holding company that engages in the provision of performance chemicals. The firm deliver solutions, which include a range of industrial and chemicals products for markets, including coatings, plastics, refrigeration and air conditioning, transportation, semiconductor and consumer electronics, general industrial, mining, and oil & gas. It operates through the following segments: Titanium Technologies, Thermal & Specialized Solutions, Advanced Performance Materials, and Chemical Solutions. The Titanium Technologies segment engages in manufacturing of titanium dioxide pigment. The Thermal & Specialized Solutions segment is a provider of refrigerants, propellants, blowing agents, and specialty solvents. The Advanced Performance Materials segment is a provider of polymers and advanced materials that deliver attributes, including chemical inertness, thermal stability, low friction, weather and corrosion resistance, extreme temperature stability, and di-electric properties. The Chemical Solutions segment with its Mining Solutions & Performance Chemicals and Intermediates engages in businesses that produce industrial chemicals used in applications by customers, which are primarily located in the America. The company was founded on February 18, 2014 and is headquartered in Wilmington, Delaware.
Predefined Scans Triggered: Three White Soldiers, Bullish MACD Crossovers, Parabolic SAR Buy Signals and Entered Ichimoku Cloud.
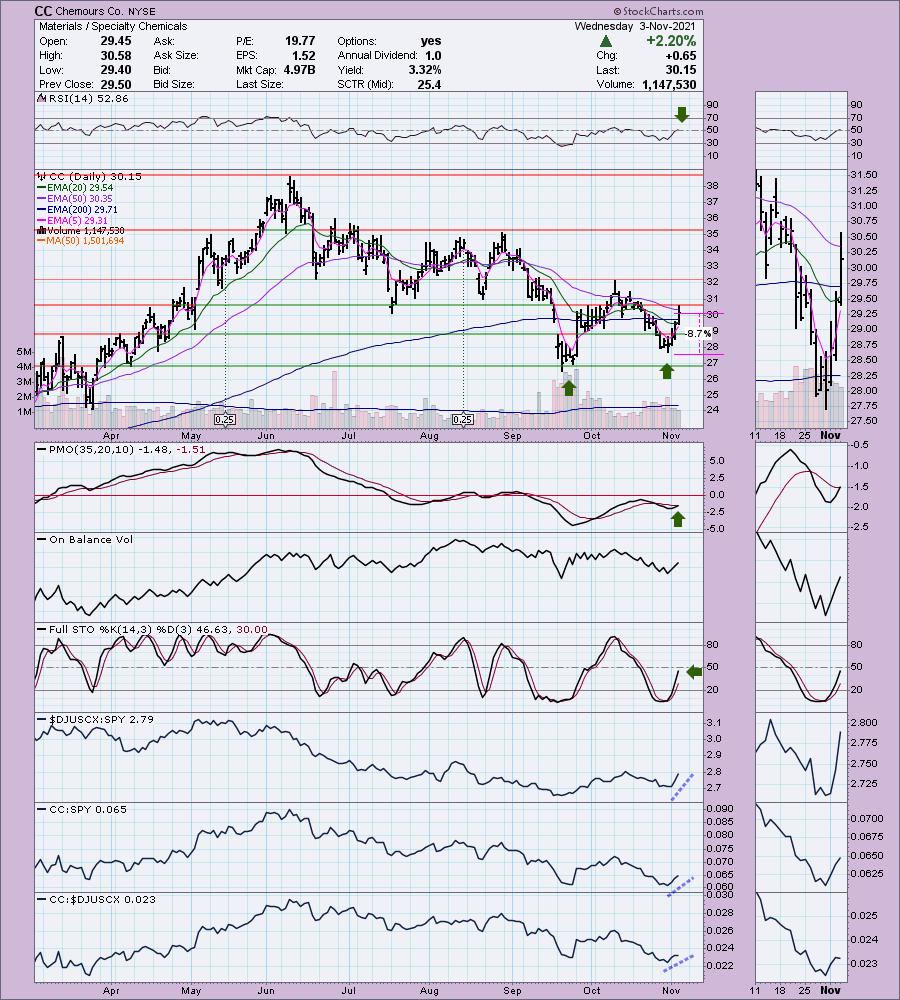
CC is up +0.17% in after hours trading. They report earnings tomorrow, so be careful. I debated whether I should include it for that reason, but the chart is very strong, so I'm chancing that I'll ruin Friday's spreadsheet if this one drops heavily on earnings. You have the benefit of watching what it does in the morning. We have a possible bullish double-bottom forming. RSI is positive and PMO just triggered a crossover BUY signal. Stochastics are rising strongly and have nearly hit positive territory above net neutral (50). Relative strength is rising for the group and CC against the group and SPY. The stop is set below the second bottom of the double-bottom formation.
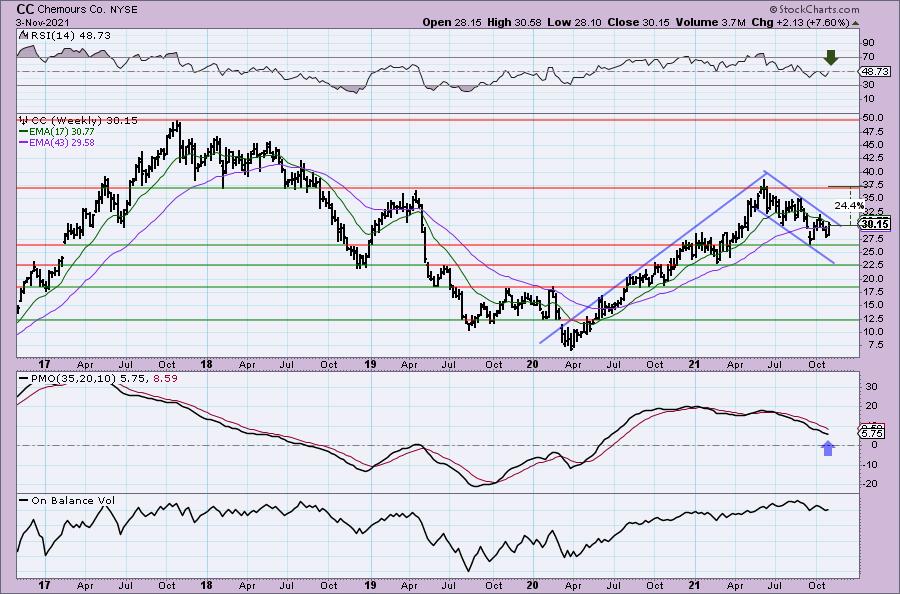
There's a textbook flag formation on the weekly chart that implies price will go much much higher than where it is. The weekly RSI is rising and should hit positive territory soon. The weekly PMO is still bearish but given the declining trend channel that forms the flag, that isn't surprising. It's still above the zero line so if it turns up it will be an excellent signal that this could be an intermediate-term hold.
Generation Bio Co (GBIO)
EARNINGS: 11/9/2021 (AMC)
Generation Bio Co. is a genetic medicines company focuses on creating a new class of gene therapy to provide durable and redosable treatment for patients suffering from both rare and prevalent diseases. Its non-viral platform incorporates a proprietary high-capacity DNA construct called closed-ended DNA, or ceDNA; a novel cell-targeted lipid nanoparticle delivery system, or ctLNP; and an established, scalable capsid-free manufacturing process. The company was founded by Mark D. Angelino, Jason P. Rhodes, and Robert M. Kotin in 2016 and is headquartered in Cambridge, MA.
Predefined Scans Triggered: P&F Double Bottom Breakout.
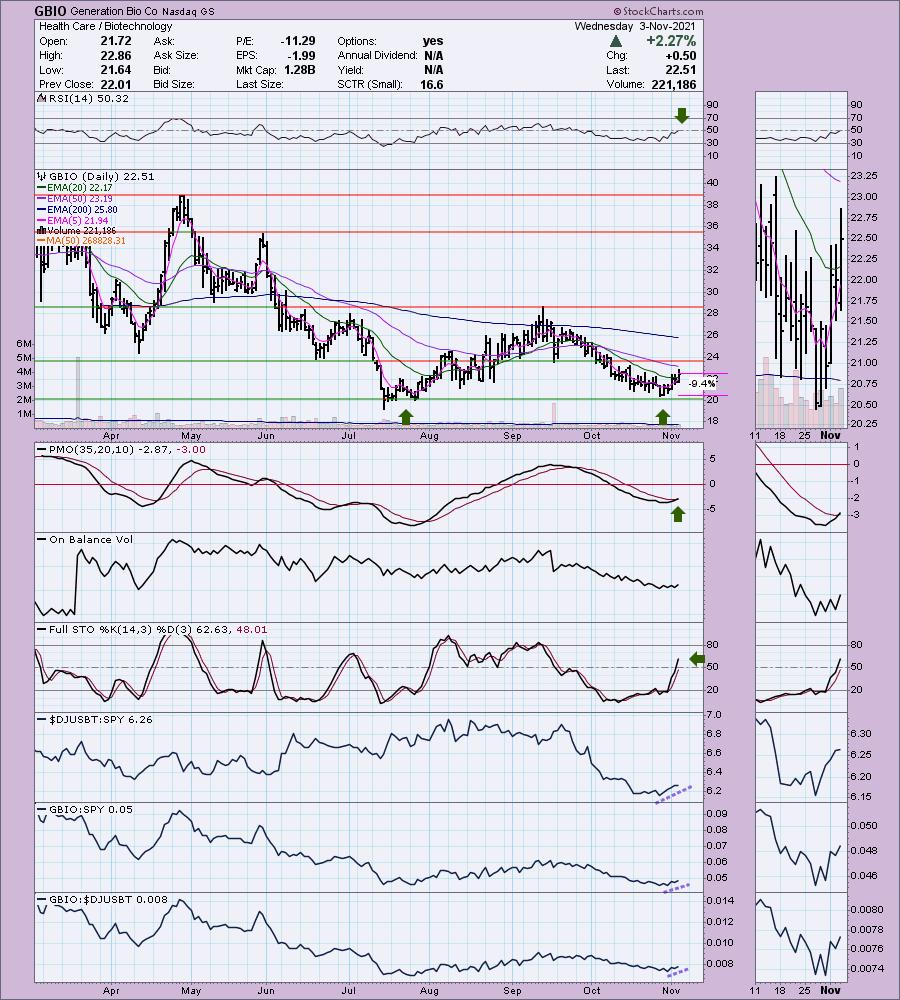
GBIO is unchanged in after hours trading. I covered GBIO on February 3rd 2021. The position was up over 36% by March 3rd but after a decline, it eventually triggered the 11% stop on the 30th of March on a strong decline. Right now it is forming a possible bullish double-bottom (very early to call it that). Price broke above the 20-EMA after a lengthy decline. It hit support and bounced. The RSI is positive and the PMO generated a crossover BUY signal today. Stochastics are rising strongly and are in positive territory. Relative strength for the group continues to rise and GIO is performing well against the group and the SPY. The stop is set at 9.4% which is near the close at the October low.
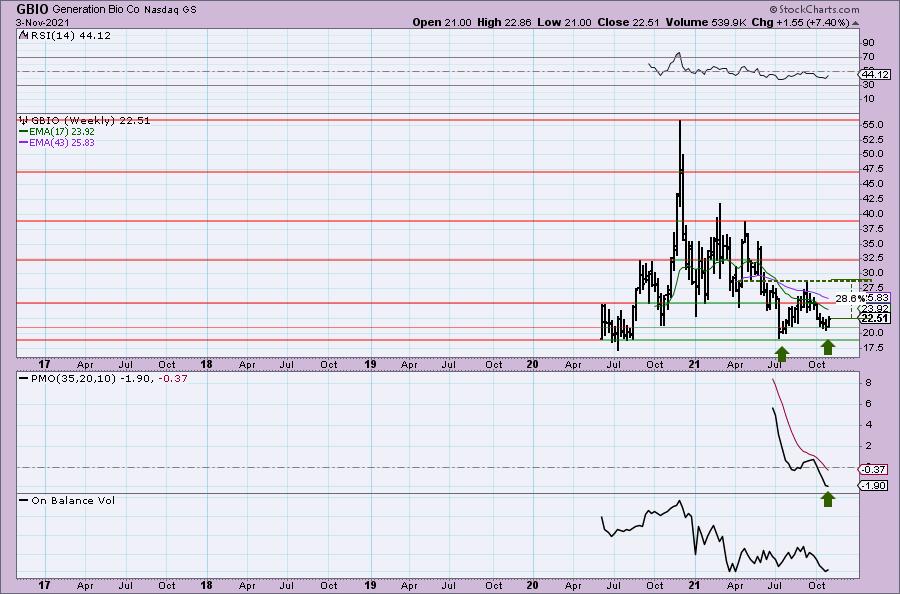
The weekly chart shows the double-bottom pattern possibilities. The weekly RSI is negative, but the weekly PMO is flattening already. Even if price just reaches the confirmation line of the double-bottom, that would still be an over 28% gain.
Rocket Lab USA, Inc. (RKLB)
EARNINGS: 11/15/2021 (AMC)
Rocket Lab USA, Inc. is an aerospace company, which focuses on developing rocket launch and control systems for the space and defense industries. It operates through the Launch Services and Space Systems segments. The Launch Services segment provides launch services to customer on a dedicated mission or ride share basis. The Space Systems segment comprises of space engineering, program management, satellite components, spacecraft manufacturing, and mission operations. The company was founded by Peter Beck in 2006 and is headquartered in Long Beach, CA.
Predefined Scans Triggered: None.
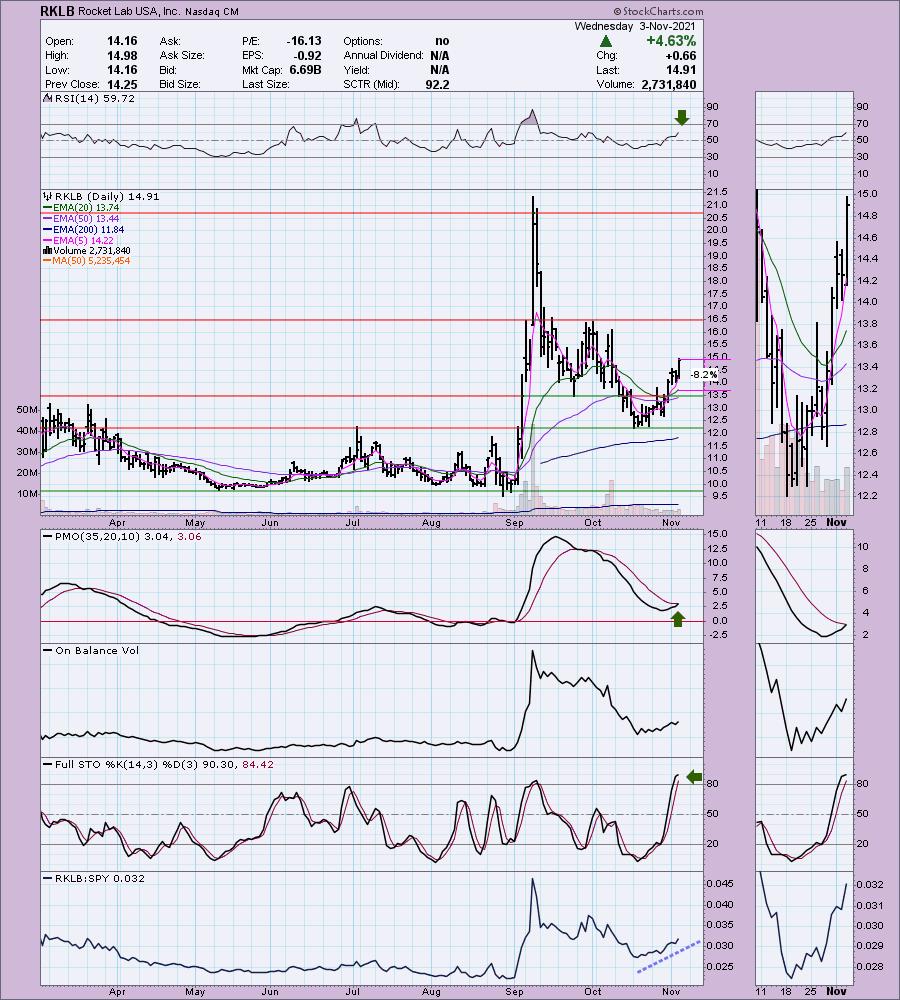
RKLB is up +0.47% in after hours trading. Volatility could be difficult if you don't have an iron stomach, but I know there are subscribers out there who love this sort of thing. I'm considering it, but I would take a small position. The RSI is positive and the PMO is nearing a crossover BUY signal. Stochastics are now above 80 which implies internal strength. The OBV is rising with price. It is showing strong relative strength against the SPY. The stop is set around 8.2% at the 20-EMA.
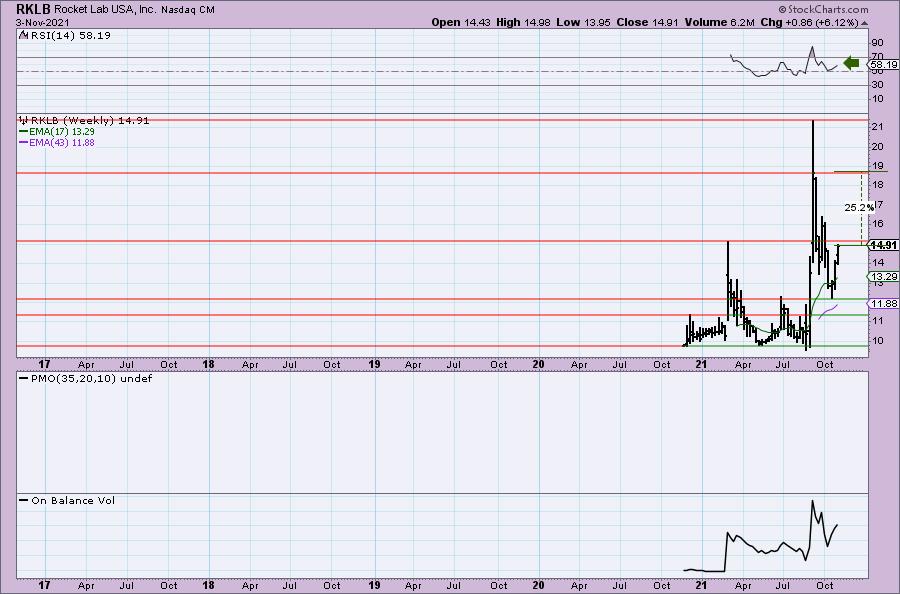
Not much on the weekly chart, but we know the weekly RSI is in positive territory and based on the OBV volume is coming in on this new rally. If it can reach its highest close, that would be a 25% gain.

In light of the holiday season, I'd like to present you a special gift...
It contains my chapter on the Golden and Silver Cross Indexes. I believe these are the best breadth indicators out there so read all about it! It's all contained in this new eBook:
Are You a Naughty Trader?
Discover: 16 Proven Strategies to Capture Holiday Market Moves
You can get it here at no cost.
Best,
Erin
Y-mAbs Therapeutics, Inc. (YMAB)
EARNINGS: 11/4/2021 (AMC)
Y-mAbs Therapeutics, Inc. is a clinical-stage biopharmaceutical company, which focuses on the development and commercialization of antibody based therapeutic products for the treatment of cancer. Its services include discovery, protein engineering, clinical and regulatory. Y-mAbs Therapeutics was founded by Thomas Gad in April 2015 and is headquartered in New York, NY.
Predefined Scans Triggered: None.
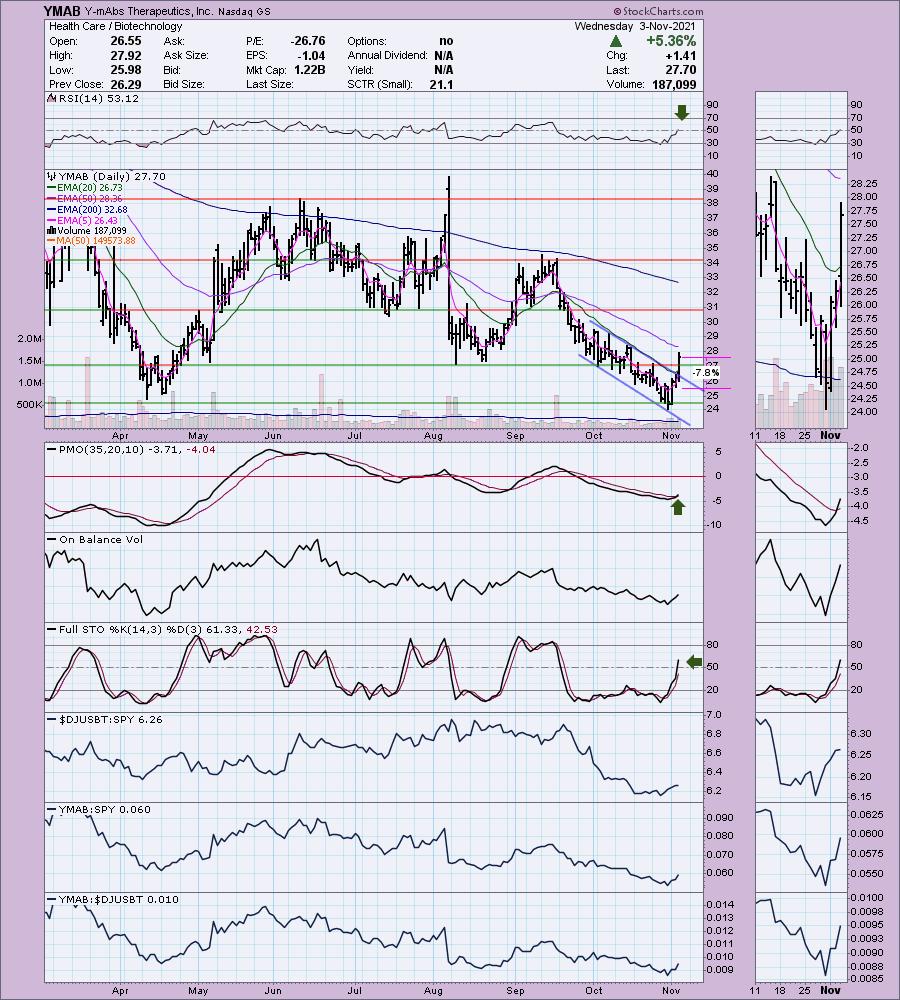
YMAB is unchanged in after hours trading and does report earnings tomorrow so I'm opening myself up yet again for a surprise move. However, this chart needed to be shown. The RSI just turned positive. Price broke out of a declining trend channel and above the 20-EMA. The PMO had a crossover BUY signal today and volume is already coming in ahead of earnings. Relative strength is improving against the group and the SPY. The stop is set at the closing low in April at 7.8%.
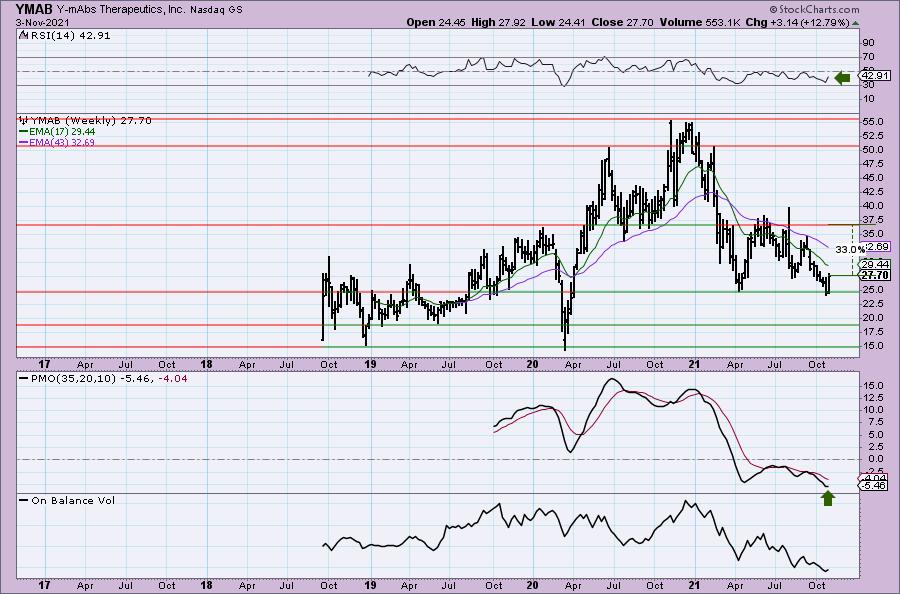
Price is bouncing off strong support. The weekly RSI is negative, but rising. The weekly PMO is already flattening in anticipation of a nice move to the upside. If price can reach the April closing high, that would be a 33% gain.
Don't forget, on Thursdays I look at reader-requested symbols, click HERE to shoot me an email. I read every email I receive and try to answer them all!
Current Market Outlook:
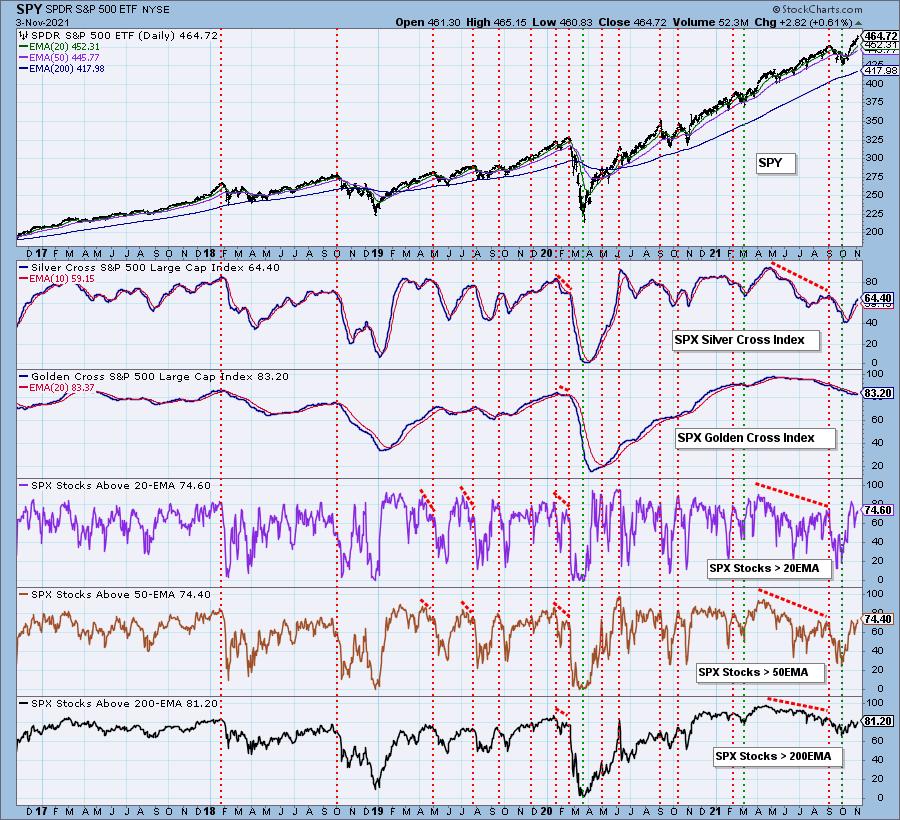
Market Environment: It is important to consider the odds for success by assessing the market tides. The following chart uses different methodologies for objectively showing the depth and trend of participation for intermediate- and long-term time frames.
- The Silver Cross Index (SCI) shows the percentage of SPX stocks on IT Trend Model BUY signals (20-EMA > 50-EMA)
- The Golden Cross Index (GCI) shows the percentage of SPX stocks on LT Trend Model BUY signals (50-EMA > 200-EMA)
- The Bullish Percent Index (BPI) shows the percentage of SPX stocks on Point & Figure BUY signals.
Don't forget that as a "Diamonds" member, you have access to our GCI/SCI curated ChartList on DecisionPoint.com. You'll find it under "Members Only" links on the left side on the Blogs and Links Page.
Here is the current chart:
Full Disclosure: I'm 85% invested and 15% is in 'cash', meaning in money markets and readily available to trade with.
I'm required to disclose if I currently own a stock and/or may buy it within the next 72 hours.
Technical Analysis is a windsock, not a crystal ball.
Happy Charting!
- Erin
erin@decisionpoint.com
Watch the latest episode of DecisionPoint with Carl & Erin Swenlin on Mondays 7:00p EST or on the DecisionPoint playlist on the StockCharts TV YouTube channel here!
NOTE: The stocks reported herein are from mechanical trading model scans that are based upon moving average relationships, momentum and volume. DecisionPoint analysis is then applied to get five selections from the scans. The selections given should prompt readers to do a chart review using their own analysis process. This letter is not a call for a specific action to buy, sell or short any of the stocks provided. There are NO sure things or guaranteed returns on the daily selection of "Diamonds in the Rough."
Helpful DecisionPoint Links:
DecisionPoint Shared ChartList and DecisionPoint Chart Gallery
Price Momentum Oscillator (PMO)
Swenlin Trading Oscillators (STO-B and STO-V)
For more links, go to DecisionPoint.com