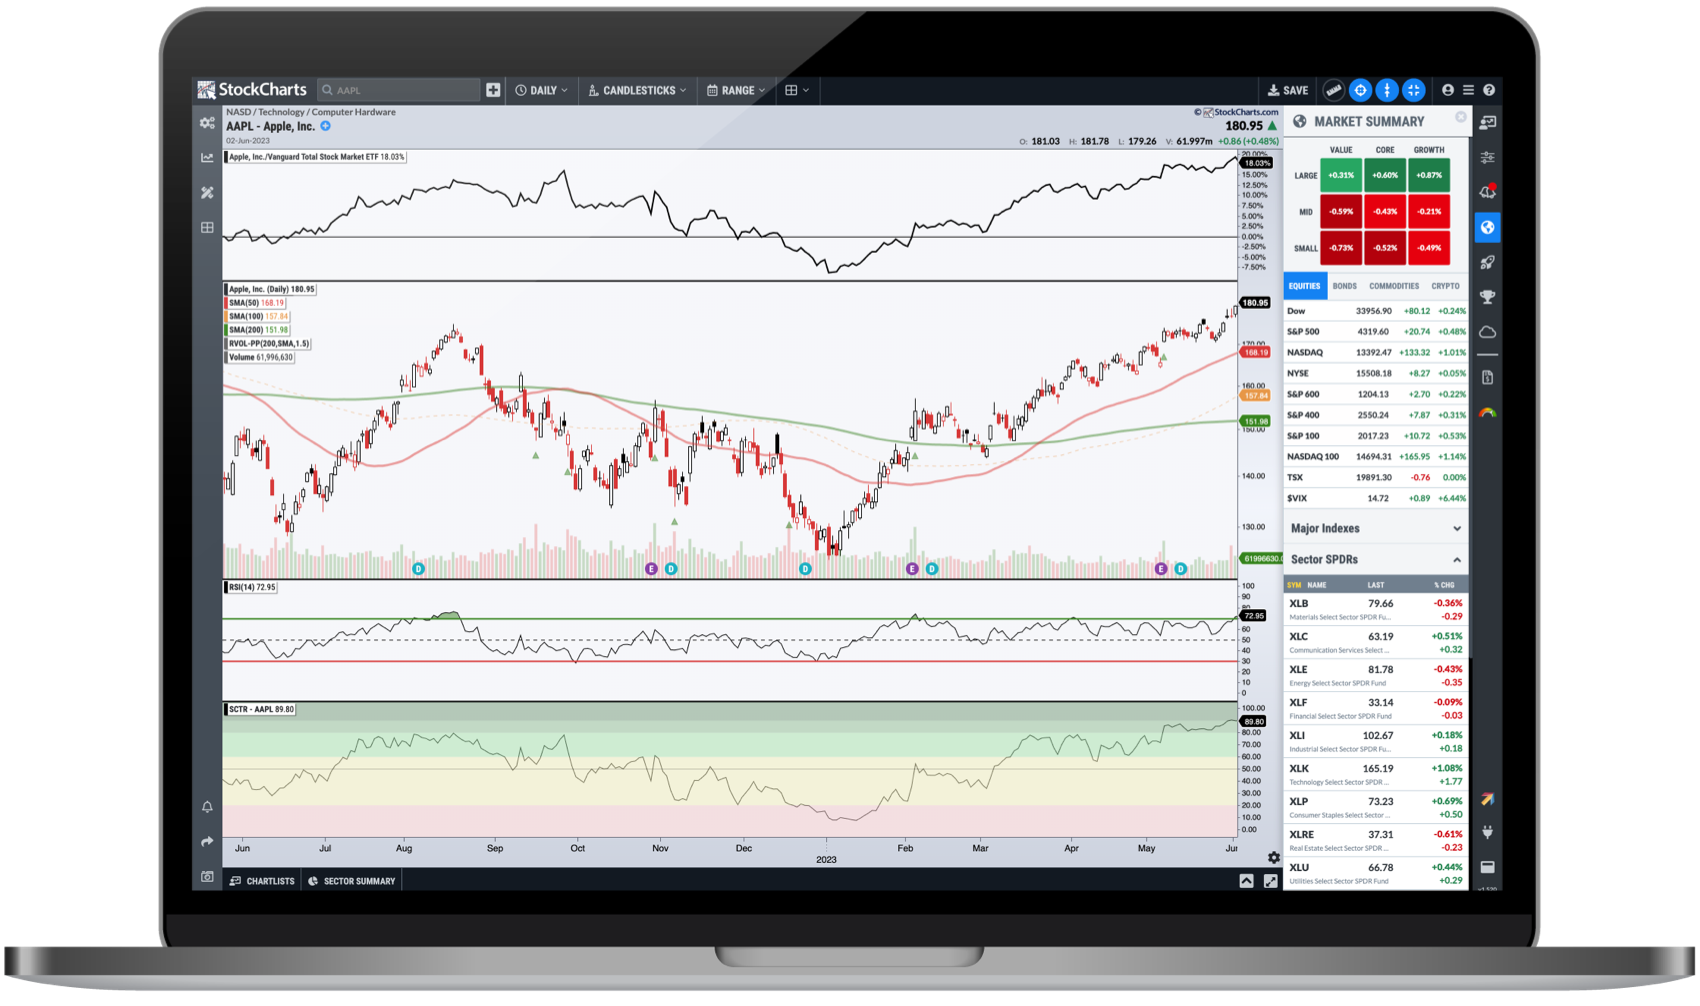
Generally, "Diamonds in the Rough" are poised to do well in the short term. Today, I found stocks that have strong or improving weekly charts that make these candidates possible intermediate-term holds.
I honestly felt like a kid in a candy store today. There were plenty of selections within our "sector to watch", Healthcare (XLV). Biotechs are increasing in relative strength and many have been beat down or basing. Now the breakouts and conditions appear ripe for investment.
An interesting theme that presented itself today was seeing three stocks from the Consumer Discretionary/Business Training Agencies industry group. I've included some in the Stocks to Review list, but will be reviewing one as a "Diamond in the Rough".
Tomorrow I will be presenting at the Westmark Trading and Trade Thirsty "Bull Bear Summit". I'm scheduled at 5:00p ET, but you can get the recording if you download the "Naughty or Nice" eBook I've been advertising. Your support is always appreciated! So whether you can attend or not, download the book and get the recording of the Bull Bear Summit! Here is the link.
Today's "Diamonds in the Rough": ARQT, ASGN, OPNT and SGMO.
Stocks to Review: RDY, CKPT, CPRX, RKLB, CCRN, TNET, GTLS, ETNB, SEM, SLS, ARNC, AVTR and NCNO.
RECORDING LINK Friday (10/29):
Topic: DecisionPoint Diamond Mine (10/29/2021) LIVE Trading Room
Start Time: Oct 29, 2021 09:00 AM
Meeting Recording Link HERE.
Access Passcode: October@29
REGISTRATION FOR FRIDAY 11/5 Diamond Mine:
When: Nov 5, 2021 09:00 AM Pacific Time (US and Canada)
Topic: DecisionPoint Diamond Mine (11/5/2021) LIVE Trading Room
Register in advance for this webinar HERE.
Save the registration confirmation email with login instructions in case Zoom doesn't notify you in time.
Free DP Trading Room (10/25) RECORDING LINK:
Topic: DecisionPoint Trading Room
Start Time: Oct 25, 2021 09:00 AM
Meeting Recording Link HERE.
Access Passcode: October#25
For best results, copy and paste the access code to avoid typos.
Welcome to DecisionPoint Daily Diamonds, wherein I highlight five "Diamonds in the Rough." These are selected from the results of my DecisionPoint scans, which search for stocks that could benefit from the trend and condition of the market. Remember, these are not recommendations to buy or sell, but are the most interesting of the stocks that surfaced in my scans. My objective is to save you the work of the initial, tedious culling process, but you need to apply your own analysis to see if these stocks pique your interest as well. There are no guaranteed winners here!
Arcutis Biotherapeutics Inc. (ARQT)
EARNINGS: 11/4/2021 (AMC)
Arcutis Biotherapeutics, Inc. engages in the development and commercialization of treatments for dermatological diseases. Its pipeline consists of topical treatments for plaque psoriasis, atopic dermatitis, hand eczema, vitiligo, scalp psoriasis, alopecia areata, and seborrheic dermatitis. The company was founded by Bhaskar Chaudhuri and David W. Osborne in June 2016 and is headquartered in Westlake Village, CA.
Predefined Scans Triggered: None.
ARQT is unchanged in after hours trading. I covered ARQT (unsuccessfully) on July 13th 2021. The 8% stop was hit before month's end. I like the set up today so let's see if we get a better result. We have a large double-bottom pattern developing. Price broke out above the 50-EMA yesterday and today traded and closed above it again. The RSI is positive and not overbought. The PMO is nearing a crossover BUY signal and should get above the zero line soon. Stochastics are rising in positive territory above net neutral (50). Notice that relative strength for Biotechs is trending up. We covered Biotechs last week with great success and the relative strength line was moving only sideways at the time. ARQT is showing new relative strength. The stop unfortunately is deep at 9.1% but that lines up with a good support level.
The weekly PMO is starting to rise again and the double-bottom pattern is more clear. Should price break above the confirmation line of the pattern at $26, the minimum upside target would give us a gain of over 47%.
ASGN Inc. (ASGN)
EARNINGS: 2/9/2022 (AMC)
ASGN, Inc. engages in the provision of information technology and professional services in the technology, digital, creative, engineering, and life sciences fields in the commercial and government sectors. It operates through the following segments: Apex, Oxford, and ECS. The Apex segment offers technical, scientific, digital, and creative services and solutions to Fortune 1000 and mid-market clients. The Oxford segment offers hard-to-find technical, digital, engineering, and life sciences services and solutions in select skill and geographic markets. The ECS segment delivers advanced solutions in cloud, cybersecurity, artificial intelligence, machine learning, software development, IT modernization, and science and engineering primarily focused on Federal Government activities. The company was founded on December 30, 1985 and is headquartered in Glen Allen, VA.
Predefined Scans Triggered: None.
ASGN was unchanged in after hours trading. I covered ASGN on August 11th 2020. The stop was triggered as ASGN was a casualty of the September 2020 sell-off. Currently it is in a strong rising trend channel and is likely headed up to test the top. The RSI is positive and the PMO is rising toward a BUY signal. Volume is coming in suggesting investor interest. I was surprised to see that the group isn't really outperforming considering I had 3 stocks in my scan results. ASGN is currently outperforming the SPY so that's okay. The stop is thinner at 6.7% given support lines up just under $115.
The weekly PMO is on a crossover BUY signal and the weekly RSI is positive. There is a risk that price will decide to tap the bottom of the trend channel before it heads back up. It's at all-time highs, so consider an upside target around $139.45 or 14% away.
Opiant Pharmaceuticals, Inc. (OPNT)
EARNINGS: 11/11/2021 (AMC)
Opiant Pharmaceuticals, Inc. is a pharmaceutical company, which engages in the development of pharmaceutical solutions for common addictions and related disorders. The firm focuses on developing treatment to reverse opioid overdoses, treatment for overweight and obese patients with binge eating disorder and treatment for patients with Bulimia Nervosa. Its principal product Naloxone is a medicine which is available through injection can reverse the overdose of prescription and illicit opioids. The company was founded on June 21, 2005 and is headquartered in Santa Monica, CA.
Predefined Scans Triggered: Elder Bar Turned Green.
OPNT was down -3.58% in after hours trading. I was very unhappy to see that as that takes back all of today's gain. Still the chart looks good and it has a SCTR value of 97.8. It's a top performer. This is would be an early entry given the PMO is only now turning up, but I really liked the positive OBV divergence (easier to see in the thumbnail) and the breakout from the bullish falling wedge. The RSI is positive. The Pharma industry group is starting to outperform and relative strength against the group and SPY is positive. The stop is set at 9%, but if after hours trading is any indication, you'll be able to thin that.
The weekly chart is favorable with a rising weekly PMO on a BUY signal and a positive RSI that isn't overbought. Upside potential is excellent if it is able to reach its 2018 high.
In light of the holiday season, I'd like to present you a special gift...
It contains my chapter on the Golden and Silver Cross Indexes. I believe these are the best breadth indicators out there so read all about it! It's all contained in this new eBook:
Are You a Naughty Trader?
Discover: 16 Proven Strategies to Capture Holiday Market Moves
You can get it here at no cost.
Best,
Erin
P.S. I almost forgot to mention...when you grab this eBook you will receive complimentary access to a 2-day virtual live event happening on November 3rd and 4th where I will be presenting my strategy, live! I will dive into the power of trading during a "climax day" and help you identify both upside and downside climax days and whether
you should trade, or let it be... You can watch live on November 3rd at 5:00p ET. Click here to get a copy today!
Sangamo Therapeutics, Inc. (SGMO)
EARNINGS: 11/4/2021 (BMO)
Sangamo Therapeutics, Inc. is a clinical stage biotechnology company, which engages in the research and development of zinc finger proteins. It focuses on three therapeutic areas: inherited metabolic diseases, central nervous system, and diseases and immunology, which comprises inflammatory and autoimmune diseases. It also offers complementary technology platforms such as gene therapy, ex vivo cell therapy, in vivo genome editing, and in vivo genome regulation. The company was founded by Edward O. Lanphier II in 1995 and is headquartered in Brisbane, CA.
Predefined Scans Triggered: P&F Descending Triple Bottom Breakdown, P&F Double Bottom Breakout, Strong Volume Gainers and P&F Bearish Catapult.
SGMO was up +1.48% in after hours trading. It has broken out of the short-term declining trend and is poised to breakout of an intermediate-term declining trend that also aligns with the 50-EMA. It is up against overhead resistance at the August/September lows, but given the positive RSI and new PMO BUY signal. I would look for a breakout. Volume really came in on the breakout from the short-term declining trend. Stochastics are now in positive territory and are rising strongly. Relative strength has been mediocre, but it is now trending higher. The stop is deep at 9.1%, but given the weekly chart, I think this one could be a longer-term hold and I tend to use deeper stops on those positions and there is a high likelihood I'll be purchasing this one.
We see a bullish falling wedge on the weekly chart. The weekly PMO is turning back up and the RSI is rising out of negative territory. The biggest risk I see is a drop down to the 2020 low so we do need to be true to that 9% stop. Still, I'm looking for it to rally to overhead resistance at the 2019/2020 tops for an over 50% gain. We'll see.
Don't forget, on Thursdays I look at reader-requested symbols, click HERE to shoot me an email. I read every email I receive and try to answer them all!
Current Market Outlook:
Market Environment: It is important to consider the odds for success by assessing the market tides. The following chart uses different methodologies for objectively showing the depth and trend of participation for intermediate- and long-term time frames.
- The Silver Cross Index (SCI) shows the percentage of SPX stocks on IT Trend Model BUY signals (20-EMA > 50-EMA)
- The Golden Cross Index (GCI) shows the percentage of SPX stocks on LT Trend Model BUY signals (50-EMA > 200-EMA)
- The Bullish Percent Index (BPI) shows the percentage of SPX stocks on Point & Figure BUY signals.
Don't forget that as a "Diamonds" member, you have access to our GCI/SCI curated ChartList on DecisionPoint.com. You'll find it under "Members Only" links on the left side on the Blogs and Links Page.
Here is the current chart:
Full Disclosure: I'm back to 80% invested and 20% is in 'cash', meaning in money markets and readily available to trade with. I am likely going to purchase SGMO depending on the 5-minute chart over the next day or two.
I'm required to disclose if I currently own a stock and/or may buy it within the next 72 hours.
Technical Analysis is a windsock, not a crystal ball.
Happy Charting!
- Erin
erin@decisionpoint.com
Watch the latest episode of DecisionPoint with Carl & Erin Swenlin on Mondays 7:00p EST or on the DecisionPoint playlist on the StockCharts TV YouTube channel here!
NOTE: The stocks reported herein are from mechanical trading model scans that are based upon moving average relationships, momentum and volume. DecisionPoint analysis is then applied to get five selections from the scans. The selections given should prompt readers to do a chart review using their own analysis process. This letter is not a call for a specific action to buy, sell or short any of the stocks provided. There are NO sure things or guaranteed returns on the daily selection of "Diamonds in the Rough."
Helpful DecisionPoint Links:
DecisionPoint Shared ChartList and DecisionPoint Chart Gallery
Price Momentum Oscillator (PMO)
Swenlin Trading Oscillators (STO-B and STO-V)
For more links, go to DecisionPoint.com