
Reader Requests looked pretty good this week. There were some Semiconductors in there that enjoyed a great rally as that industry group was a top performer today. Biotechs and Pharmaceuticals also saw the spotlight. The ones I picked look strong with only a few minor issues.
Time to toot my horn! SEM which was the "Diamond of the Week" on the DecisionPoint Show and Your Daily Five on Monday has executed its double-bottom pattern and is up about 4.5% since. Tuesday's pick, SGMO was up over 19% today, hope some of you picked that one up. It was a pleasant surprise in my portfolio today.
On the flip side we had two hit their stops this week, OPNT and YMAB. I had a feeling both were sitting precariously given they were getting ready to report earnings. I was somewhat surprised at the voracity of their declines, but that's earnings for you.
Tomorrow's Diamond Mine trading room promises to be very interesting with all of these volatile Biotechs. I'm looking forward to seeing what symbols you have to present. Here is the link to sign up.
Today's "Diamonds in the Rough": CE, CLS, ENDP, LABU and VICR.
Yesterday I presented at the Westmark Trading and Trade Thirsty "Bull Bear Summit". I discussed Climax Analysis and Participation. I had a great time and I think you'll really enjoy it. You can get the recording if you download the "Naughty or Nice" eBook I've been advertising. Your support is always appreciated!

RECORDING LINK Friday (10/29):
Topic: DecisionPoint Diamond Mine (10/29/2021) LIVE Trading Room
Start Time: Oct 29, 2021 09:00 AM
Meeting Recording Link HERE.
Access Passcode: October@29
REGISTRATION FOR FRIDAY 11/5 Diamond Mine:
When: Nov 5, 2021 09:00 AM Pacific Time (US and Canada)
Topic: DecisionPoint Diamond Mine (11/5/2021) LIVE Trading Room
Register in advance for this webinar HERE.
Save the registration confirmation email with login instructions in case Zoom doesn't notify you in time.

Free DP Trading Room (10/25) RECORDING LINK:
Topic: DecisionPoint Trading Room
Start Time: Oct 25, 2021 09:00 AM
Meeting Recording Link HERE.
Access Passcode: October#25
For best results, copy and paste the access code to avoid typos.
Welcome to DecisionPoint Daily Diamonds, wherein I highlight five "Diamonds in the Rough." These are selected from the results of my DecisionPoint scans, which search for stocks that could benefit from the trend and condition of the market. Remember, these are not recommendations to buy or sell, but are the most interesting of the stocks that surfaced in my scans. My objective is to save you the work of the initial, tedious culling process, but you need to apply your own analysis to see if these stocks pique your interest as well. There are no guaranteed winners here!
Celanese Corp. (CE)
EARNINGS: 1/27/2022 (AMC)
Celanese Corp. engages in the provision of technology and specialty materials businesses. It operates through the following segments: Engineered Materials, Acetate Tow, Acetyl Chain and Other Activities .The Engineered Materials segment includes the engineered materials business, food ingredients business and certain strategic affiliates. The Acetate Tow segment serves consumer-driven applications and is a global producer and supplier of acetate tow and acetate flake used in filter products applications. The Acetyl Chain segment includes the integrated chain of intermediate chemistry, emulsion polymers and ethylene vinyl acetate (EVA) polymers businesses, based on similar products, production processes, classes of customers and selling and distribution practices as well as economic similarities over a normal business cycle. The Other Activities segment consists of corporate center costs, including administrative activities such as finance, information technology and human resource functions, interest income and expense associated with financing activities. The company was founded by Camille Dreyfus and Henri Dreyfus in 1918 and is headquartered in Irving, TX.
Predefined Scans Triggered: None.
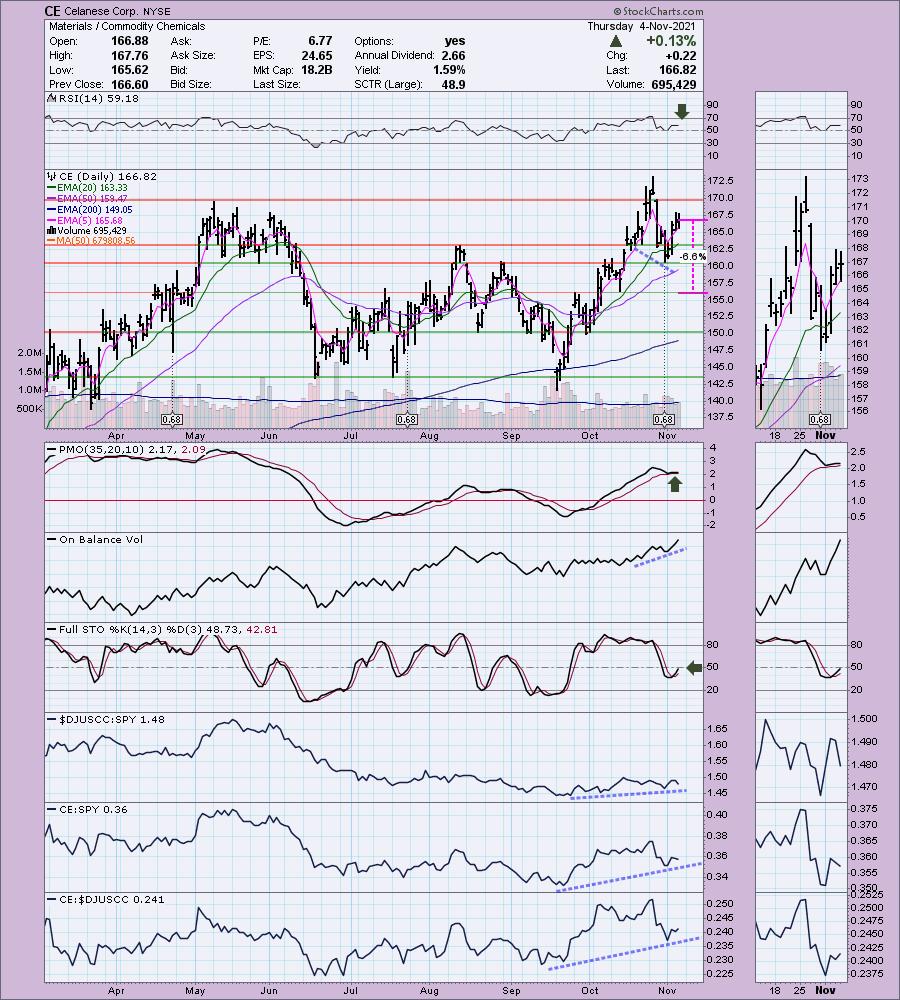
CE is unchanged in after hours trading. I covered CE in the October 7th 2020 Diamonds Report. The stop was never hit so the position is currently up +43.24%. I like the set up. Price dipped below the 20-EMA but bounced before testing the 50-EMA. The RSI is positive and the PMO is bottoming above the signal line. There is a positive OBV divergence that led into the current rally suggesting it will have staying power. Love Stochastics turning up. Overall relative performance in the longer term has been positive. The stop is set at the late September top.
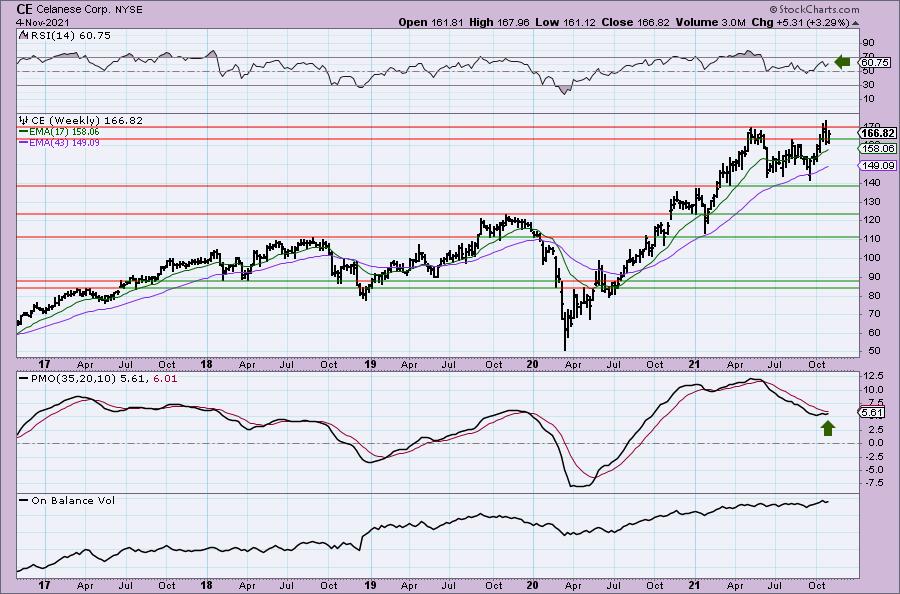
The weekly chart is favorable with a positive RSI and rising weekly PMO. It is near all-time highs so I would consider an upside target around $191.85 for a 15% gain.
Celestica, Inc. (CLS)
EARNINGS: 1/25/2022 (AMC)
Celestica, Inc. engages in the provision of supply chain solutions globally to original equipment manufacturers and service providers. It operates through the Advanced Technology Solutions (ATS) and Connectivity and Cloud Solutions (CCS) business segments. The ATS segment comprises of aerospace and defense, industrial, smart energy, health tech, and capital equipment businesses. The CCS segment consists of enterprise communications, telecommunications, servers, and storage businesses. Celestica was founded in 1994 and is headquartered in Toronto, Canada.
Predefined Scans Triggered: None.
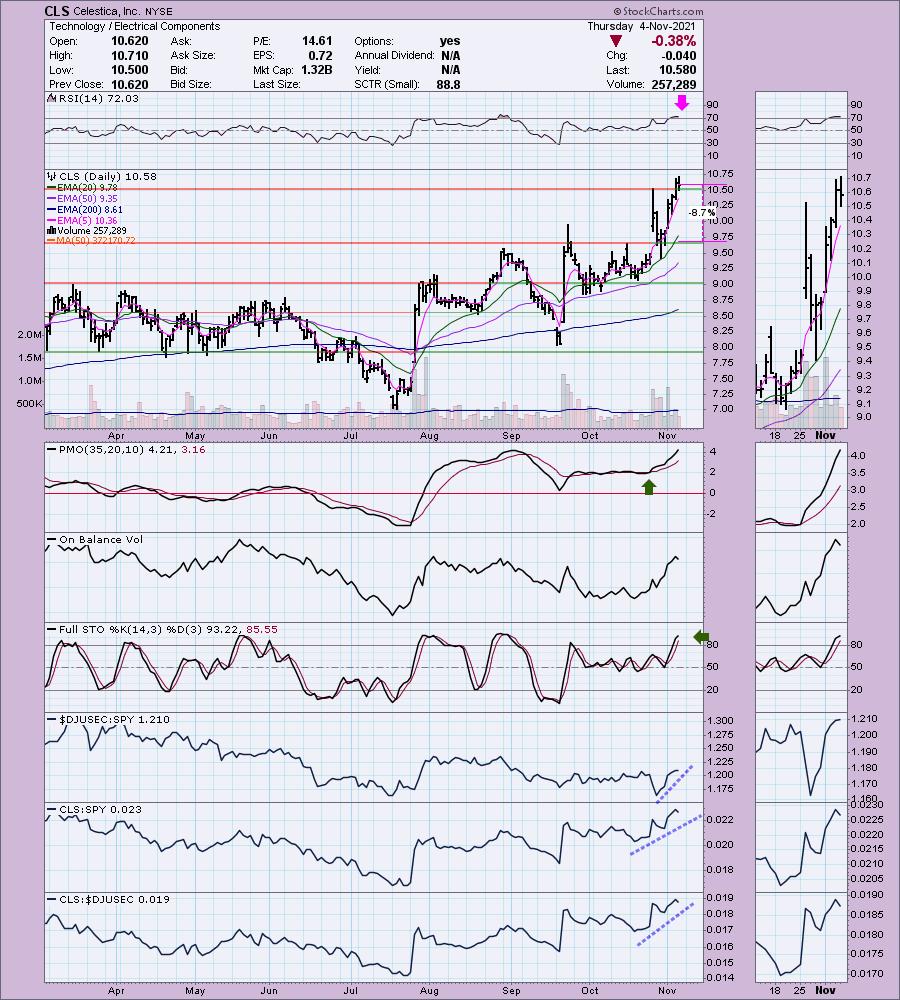
CLS is up +1.61% in after hours trading. Price broke out yesterday and while it was down today, support was not breached. The RSI is overbought which should generate caution flags. The PMO is rising strongly and volume is coming in. Stochastics are strong and above 80, but could also warn of a pullback like the RSI. Relative strength is excellent. The stop is set at the mid-October high.
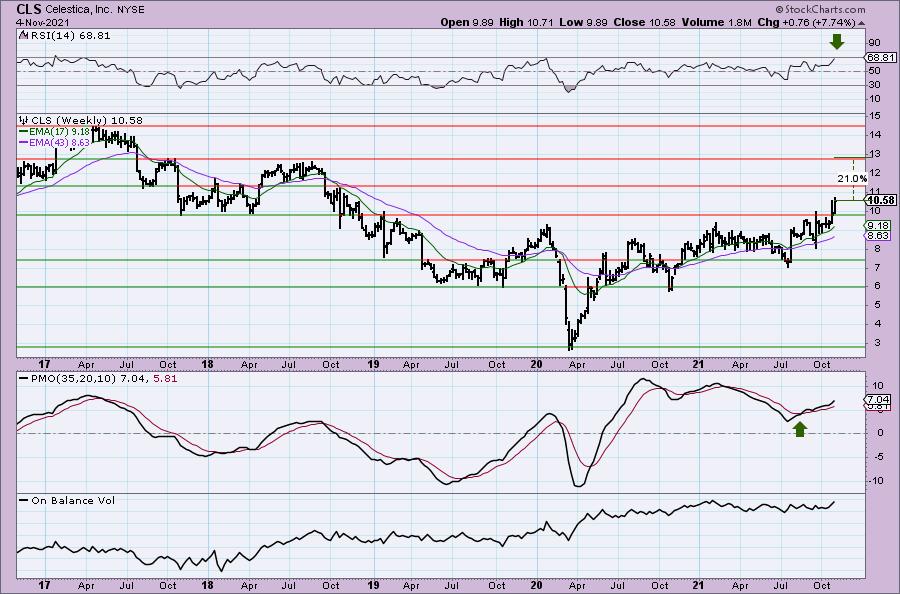
We see the importance of this current breakout as it takes price above strong resistance going back to 2017/2018. The weekly RSI is positive and the PMO is on a BUY signal, rising and not overbought.
Endo Pharmaceuticals Holdings, Inc. (ENDP)
EARNINGS: 11/4/2021 (AMC) ** Reported After Hours Today **
Endo International Plc operates as a pharmaceutical company. It focuses on developing, manufacturing, and distributing of branded and generic pharmaceutical products. The firm operates through the following segments: Branded Pharmaceuticals, Sterile Injectables, Generic Pharmaceuticals and International Pharmaceuticals. The Branded Pharmaceuticals segment conducts certain operations in the U.S. through leased and owned manufacturing properties in Pennsylvania, New York and New Jersey, as well as certain administrative and R&D functions through leased properties in Pennsylvania. The Sterile Injectables segment conducts certain manufacturing, quality assurance, R&D and administration functions. The Generic Pharmaceuticals segment conducts certain manufacturing, distribution, quality assurance and administration functions, as well as certain R&D functions. The International Pharmaceuticals segment's operations are currently conducted through Paladin's leased headquarters in Montreal, Canada. The company was founded in 1997 and is headquartered Dublin, Ireland.
Predefined Scans Triggered: Elder Bar Turned Blue and P&F Low Pole.
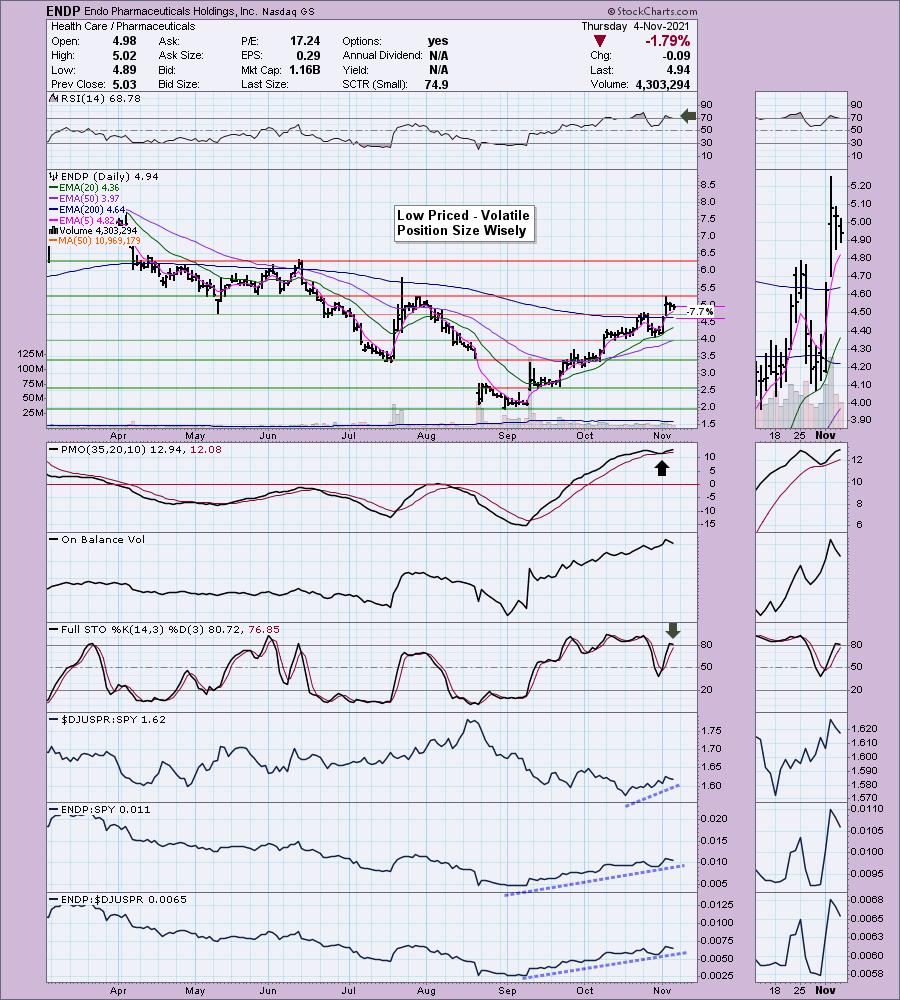
ENDP is up +5.06% after reporting earnings tonight. That's an excellent sign of good things to come. The RSI is overbought, but Stochastics are not. The OBV is confirming this perfect rising trend. Relative performance for ENDP has been exceptional over time and the group has begun to outperform as you know. The stop is set below the 200-EMA. Be aware this is a very low-priced stock which translates to volatility. Position size wisely!
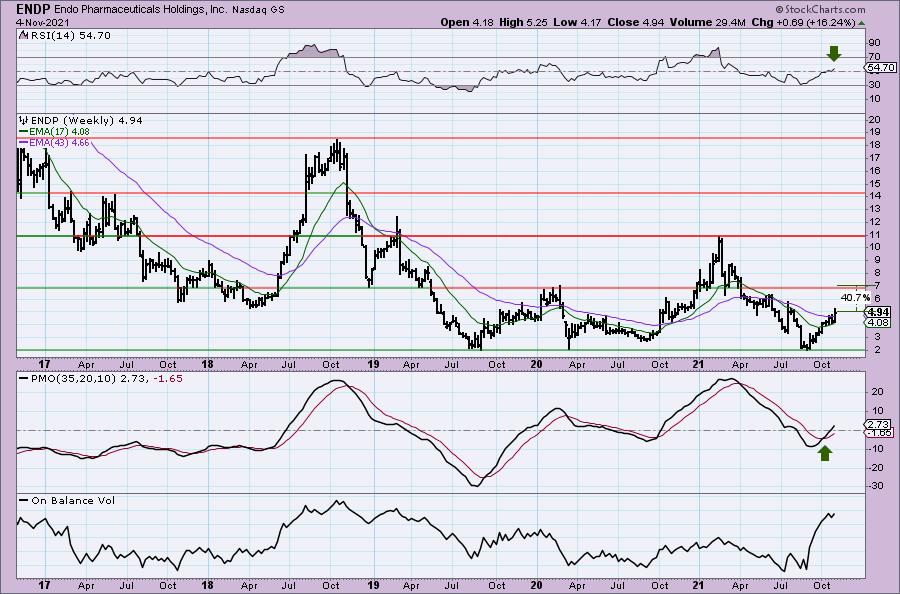
The weekly chart is very nice. The weekly RSI and PMO just turned positive and are rising. Upside potential is over 40%, but could move much higher if price breaks out here.
Direxion Daily S&P Biotech Bull 3x Shares (LABU)
EARNINGS: N/A
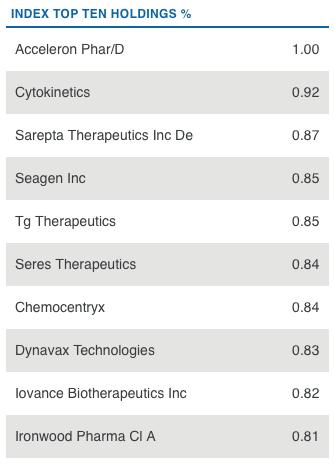
LABU provides daily 3 times exposure to the S&P Biotechnology Select Industry Index.
Predefined Scans Triggered: None.
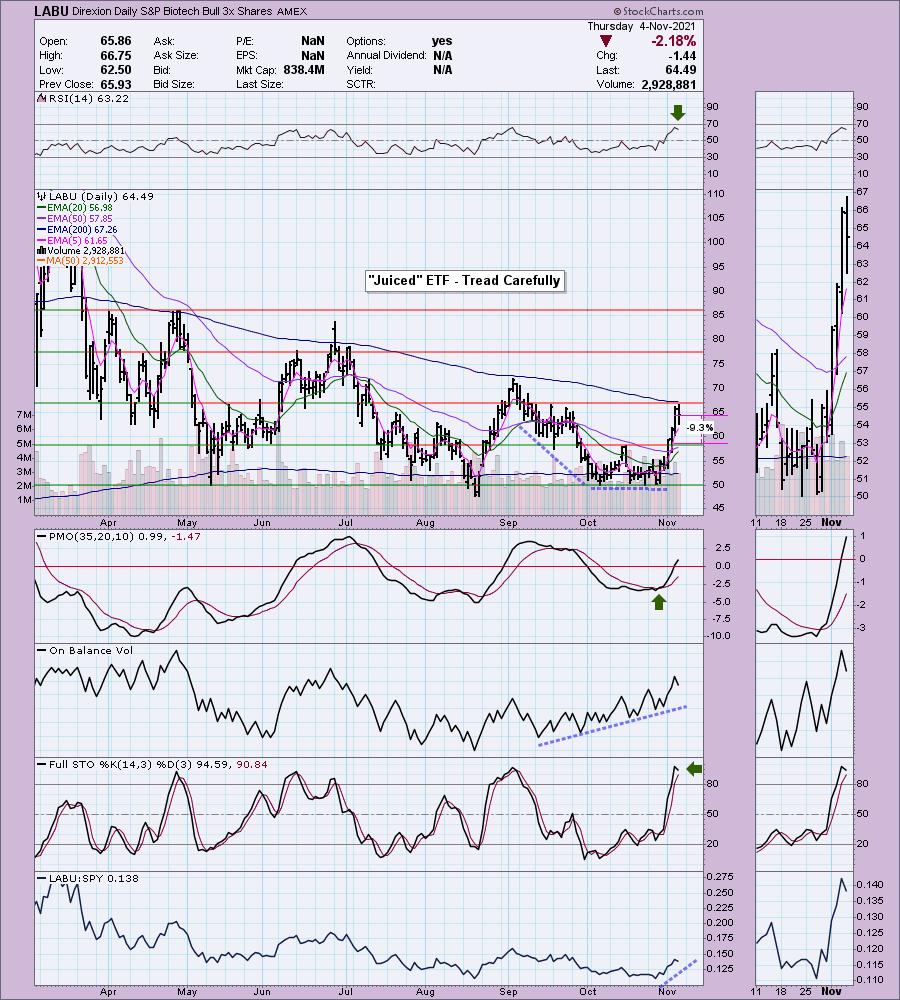
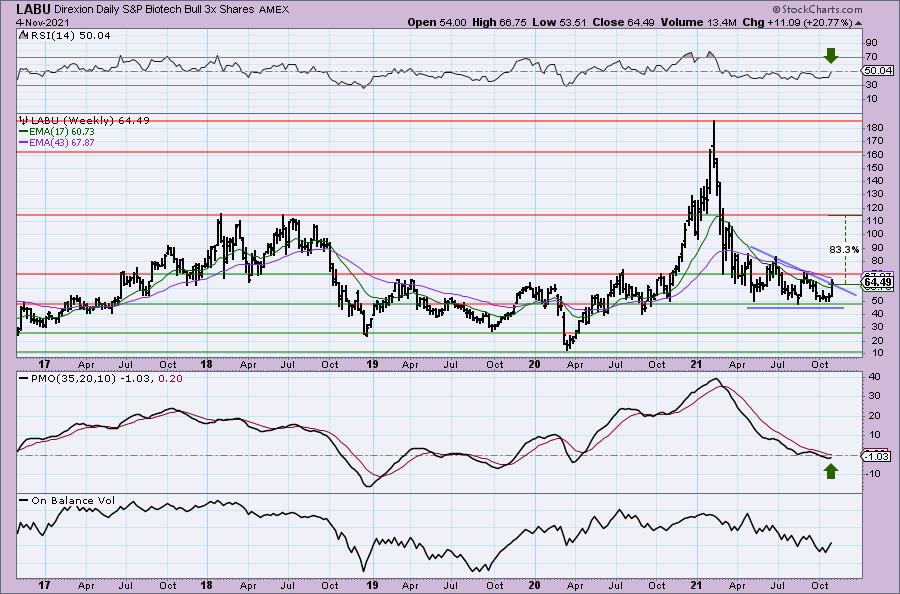
LABU is down -0.64% in after hours trading. I'm a fan of the Biotechs, but I'm not a fan of 3x ETFs as it carries high risk and volatility so position size carefully. Price has just now hit overhead resistance at the 200-EMA. The RSI has turned down but is positive. The PMO looks great as it rises smoothly higher and above the zero line. We have an OBV positive divergence that goes back to September so I would expect a breakout here. Stochastics ticked lower on today's decline, but the PMO didn't flinch. Relative strength is improving which makes sense as it should follow the industry group. The stop is a bit deep. It would have price challenging support at the October top.
I don't like the bearish descending triangle pattern, but it appears we are about to get a bullish conclusion to a bearish pattern which is especially bullish. The weekly PMO is rising and the weekly RSI has hit positive territory.
Vicor Corp. (VICR)
EARNINGS: 2/24/2022 (AMC)
Vicor Corp. engages in the design, development, manufacture, and marketing of modular power components. The firm provides complete power systems based upon a portfolio of patented technologies. Its products include AC-DC converters, power systems, and accessories. The company was founded by Patrizio Vinciarelli in 1981 and is headquartered in Andover, MA.
Predefined Scans Triggered: New 52-week Highs, P&F Ascending Triple Top Breakout and P&F Double Top Breakout.
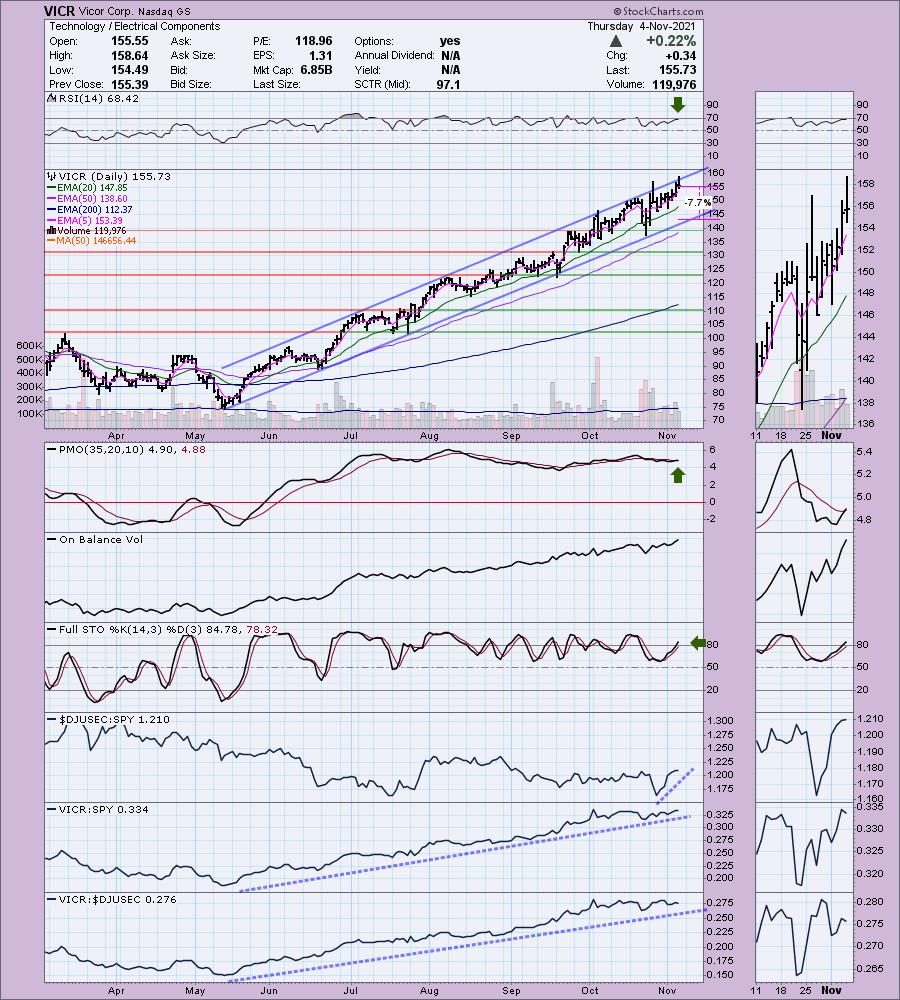
VICR is up +0.17% in after hours trading. It has been traveling in a beautiful rising trend channel. The RSI is positive and not overbought and the PMO just generated a crossover BUY signal. Stochastics have reached above 80 and continue to rise. My one concern would be the need for a trip down to test the bottom of the rising trend channel, but other than that the chart looks very strong. Notice relative strength for VICR has been exceptional all the way back to May of this year. The stop is set based on a drop below the rising trend.
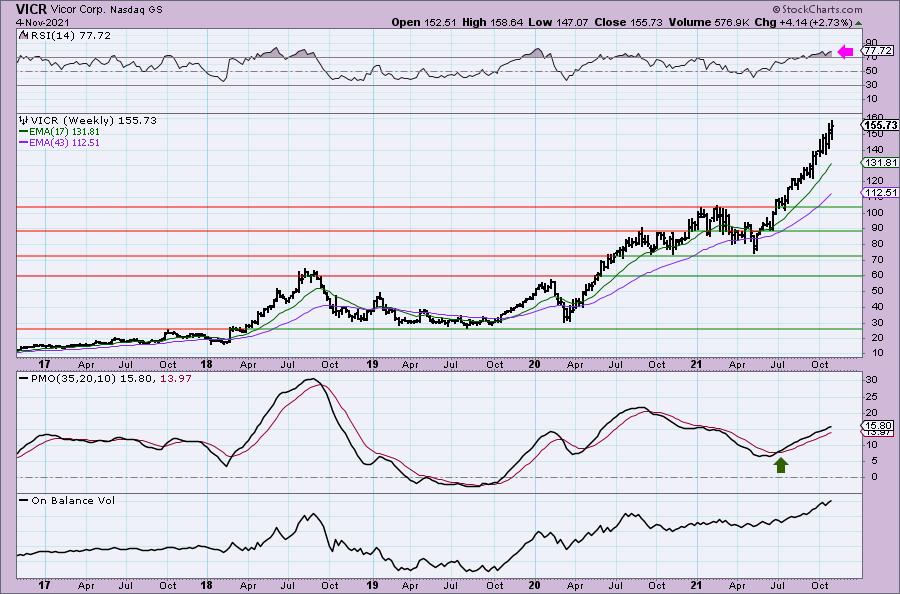
The weekly chart looks great except for the overbought RSI; however, we know those conditions can last for weeks and even months. The weekly PMO is on a BUY signal and rising. Given it is at all time highs, I would consider an upside target of about 15% or $179.09.
Don't forget, on Thursdays I look at reader-requested symbols, click HERE to shoot me an email. I read every email I receive and try to answer them all!
Current Market Outlook:
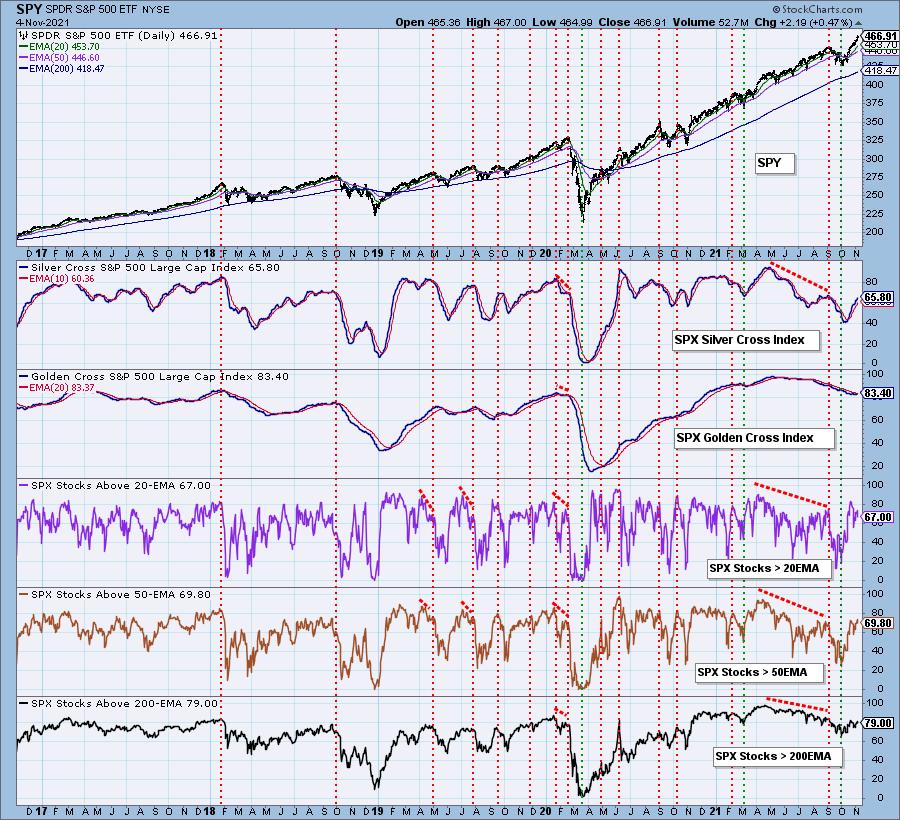
Market Environment: It is important to consider the odds for success by assessing the market tides. The following chart uses different methodologies for objectively showing the depth and trend of participation for intermediate- and long-term time frames.
- The Silver Cross Index (SCI) shows the percentage of SPX stocks on IT Trend Model BUY signals (20-EMA > 50-EMA)
- The Golden Cross Index (GCI) shows the percentage of SPX stocks on LT Trend Model BUY signals (50-EMA > 200-EMA)
- The Bullish Percent Index (BPI) shows the percentage of SPX stocks on Point & Figure BUY signals.
Don't forget that as a "Diamonds" member, you have access to our GCI/SCI curated ChartList on DecisionPoint.com. You'll find it under "Members Only" links on the left side on the Blogs and Links Page.
Here is the current chart:
Full Disclosure: I'm 85% invested and 15% is in 'cash', meaning in money markets and readily available to trade with.
I'm required to disclose if I currently own a stock and/or may buy it within the next 72 hours.
Technical Analysis is a windsock, not a crystal ball.
Happy Charting!
- Erin
erin@decisionpoint.com
Watch the latest episode of DecisionPoint with Carl & Erin Swenlin on Mondays 7:00p EST or on the DecisionPoint playlist on the StockCharts TV YouTube channel here!
NOTE: The stocks reported herein are from mechanical trading model scans that are based upon moving average relationships, momentum and volume. DecisionPoint analysis is then applied to get five selections from the scans. The selections given should prompt readers to do a chart review using their own analysis process. This letter is not a call for a specific action to buy, sell or short any of the stocks provided. There are NO sure things or guaranteed returns on the daily selection of "Diamonds in the Rough."
Helpful DecisionPoint Links:
DecisionPoint Shared ChartList and DecisionPoint Chart Gallery
Price Momentum Oscillator (PMO)
Swenlin Trading Oscillators (STO-B and STO-V)
For more links, go to DecisionPoint.com