
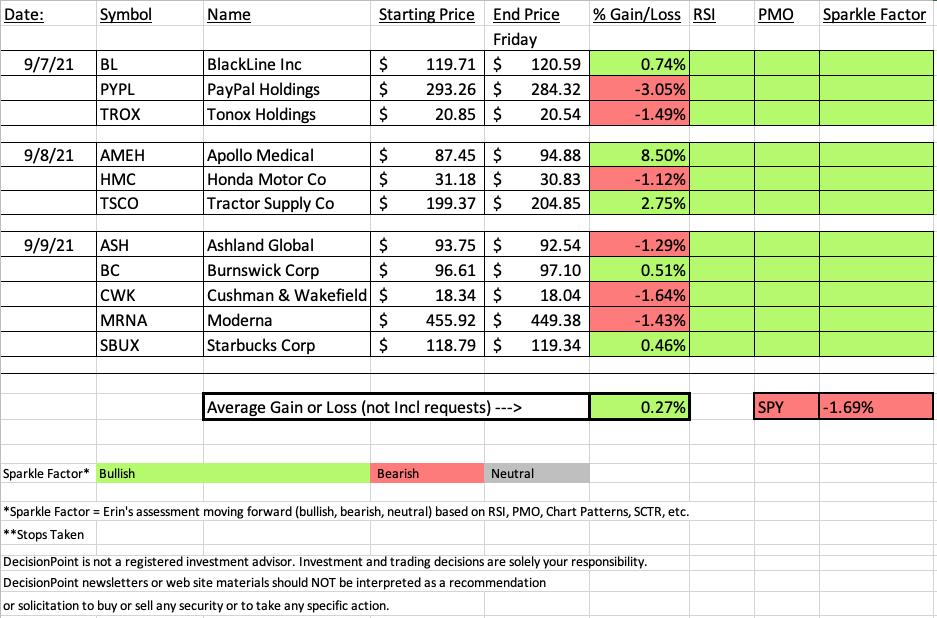
"Diamonds in the Rough" this week averaged nearly 2% higher than the SPY. Last week, our positive week came on the back of rare earth metals and mining. This week winners came from various sectors. This week's best performer was up 8.5% while our Diamond "Dud" was down a little over 3%.
Thank you for your patience with the Recap going out late this week. I was indeed bitten by a venomous spider, but I never saw the guilty arachnid so we do not know exactly what it was. It looks like brown recluse bite, but the antibiotic is already beginning to make it look less "angry" so we should be able to avoid the ER and I won't lose a chunk of my leg!
Register now for next Friday's Diamond Mine trading room below or right HERE.

RECORDING LINK Friday (9/10):
Topic: DecisionPoint Diamond Mine (9/10/2021) LIVE Trading Room
Start Time : Sep 10, 2021 09:02 AM
Meeting Recording Link HERE.
Access Passcode: Sept$10th
REGISTRATION FOR FRIDAY 9/17 Diamond Mine:
When: Sep 17, 2021 09:00 AM Pacific Time (US and Canada)
Topic: DecisionPoint Diamond Mine (9/17/2021) LIVE Trading Room
Register in advance for this webinar HERE.
Save the registration confirmation email with login instructions in case Zoom doesn't notify you in time.

Free DP Trading Room (9/7) RECORDING LINK:
Topic: DecisionPoint Trading Room
Start Time : Sep 7, 2021 08:45 AM
Meeting Recording Link HERE.
Access Passcode: Sept@7th
For best results, copy and paste the access code to avoid typos.
FREE eBook! "Smart Choices for Treacherous Markets"

Listen To These 11 Women!

These 11 women have more than 221 years combined experience in trading...
Which is why you should pay close attention to what they have to say.
If you ever wondered how to build wealth and generate income with less risk...
Or if there were simple tools that traders use to find profitable "big move trades" without risking all their capital...
My video chapter on Using Momentum and Relative Strength to Find the Best Trades shares how this smart woman is beating the markets.
To download your FREE copy, click HERE.
A few items about the spreadsheet: I've put on the spreadsheet whether the RSI is positive (green) or negative (red). The PMO column tells you if it is rising (green) or falling (red). Finally I've added my own "Sparkle Factor" that gives you my assessment going forward, bullish (green), bearish (red) or neutral (gray). The Sparkle Factor is basically my thoughts on whether I expect it to rise or fall. A neutral means it could really go either way so it could be added to a watch list. If you're in a stock I consider "neutral" going forward, the ball is in your court.
Darling:
Apollo Medical Holdings, Inc (AMEH)
EARNINGS: 11/3/2021 (AMC)
Apollo Medical Holdings, Inc. is a physician-centric, technology-powered, risk-bearing healthcare management company. It focuses on providing population health management and healthcare delivery platform. The company operates as an integrated, value-based healthcare model, which aims to empower the providers in its network to deliver the highest quality of care to its patients in a cost-effective manner. Apollo Medical Holdings was founded on November 1, 1985 and is headquartered in Alhambra, CA.
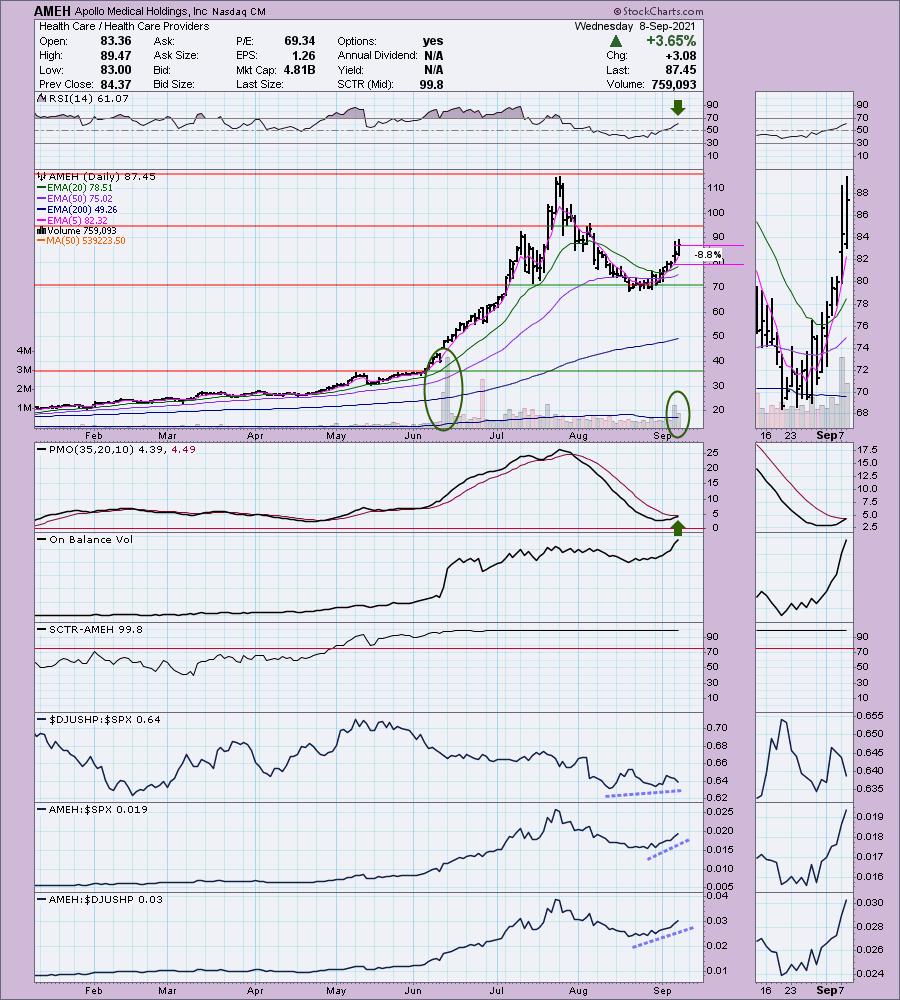
Below are the commentary and chart from Wednesday 9/8:
"AMEH is up a big +2.86% in after hours trading so we may have found a good one here. Hopefully it will offer a good opportunity for a pick up tomorrow. This chart suggests price will be moving higher. The PMO is "scooping" up toward an oversold BUY signal. The RSI is positive and not overbought. Price sailed and then corrected. After reaching important support at the 50-EMA it began to make its run back toward all-time highs. Notice the high volume on the original breakout back in June. While we don't have volume coming in to that degree, we are seeing strong volume patterns right now. The SCTR can't get much better and relative strength is positive. I've set the stop near the 20-EMA."
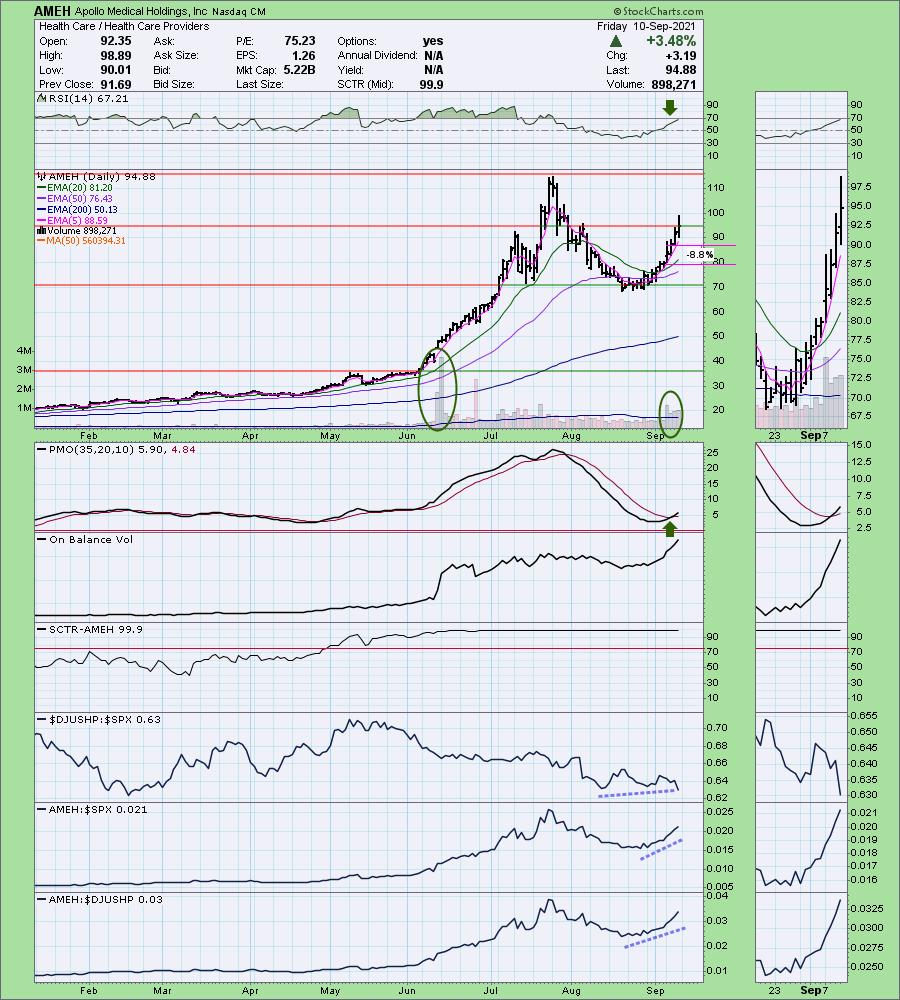
Here is today's chart:
The breakout happened, but price did close on resistance. It looks good for continuing higher. The risk is a pullback to form a "handle" on this cup-shaped price pattern. Still, the RSI isn't overbought yet and the PMO looks spectacular.
Don't forget, on Thursdays I look at reader-requested symbols, so shoot me an email at erin@decisionpoint.com. I read every email I receive and try to answer them all!
Dud:
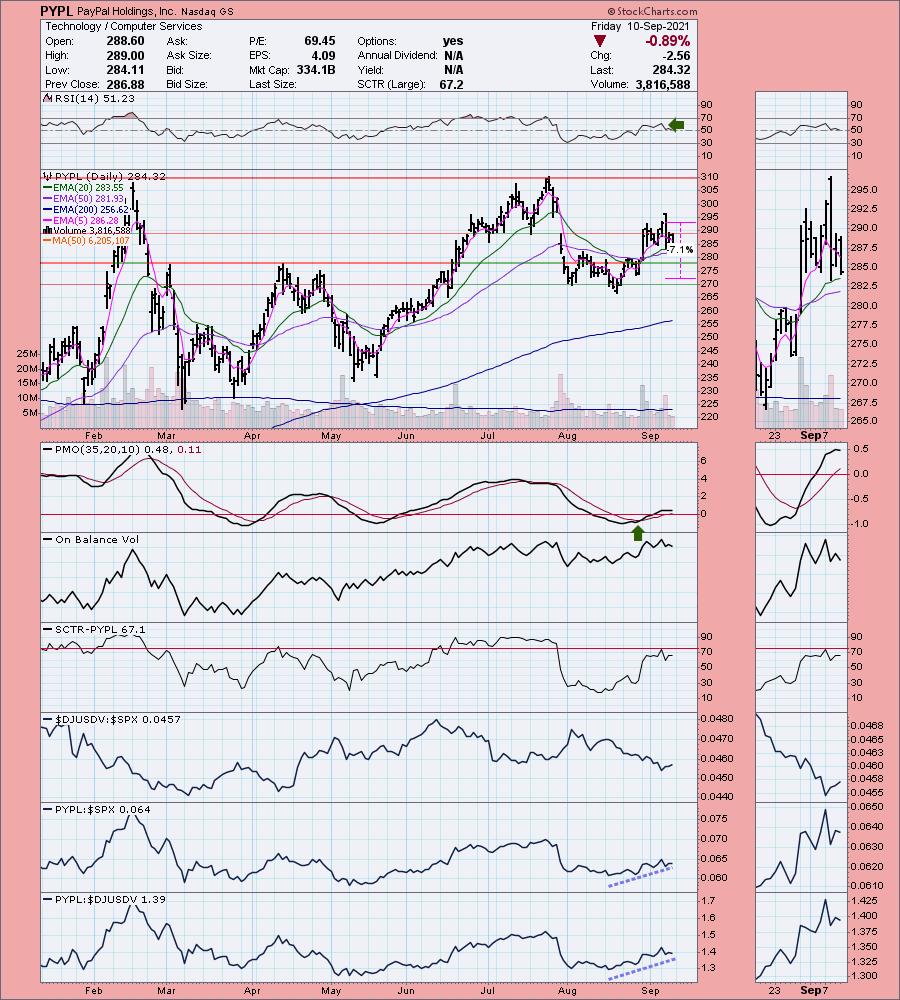
PayPal Holdings, Inc. (PYPL)
EARNINGS: 11/1/2021 (AMC)
PayPal Holdings, Inc. engages in the development of technology platform for digital payments. Its solutions include PayPal, PayPal Credit, Braintree, Venmo, Xoom, and Paydiant products. The firm manages a two-sided proprietary global technology platform that links customers, which consist of both merchants and consumers, to facilitate the processing of payment transactions. It allows its customers to use their account for both purchase and paying for goods, as well as to transfer and withdraw funds. The firm also enables consumers to exchange funds with merchants using funding sources, which include bank account, PayPal account balance, PayPal Credit account, credit and debit card or other stored value products. It offers consumers person-to-person payment solutions through its PayPal Website and mobile application, Venmo and Xoom. The company was founded in December 1998 and is headquartered in San Jose, CA.
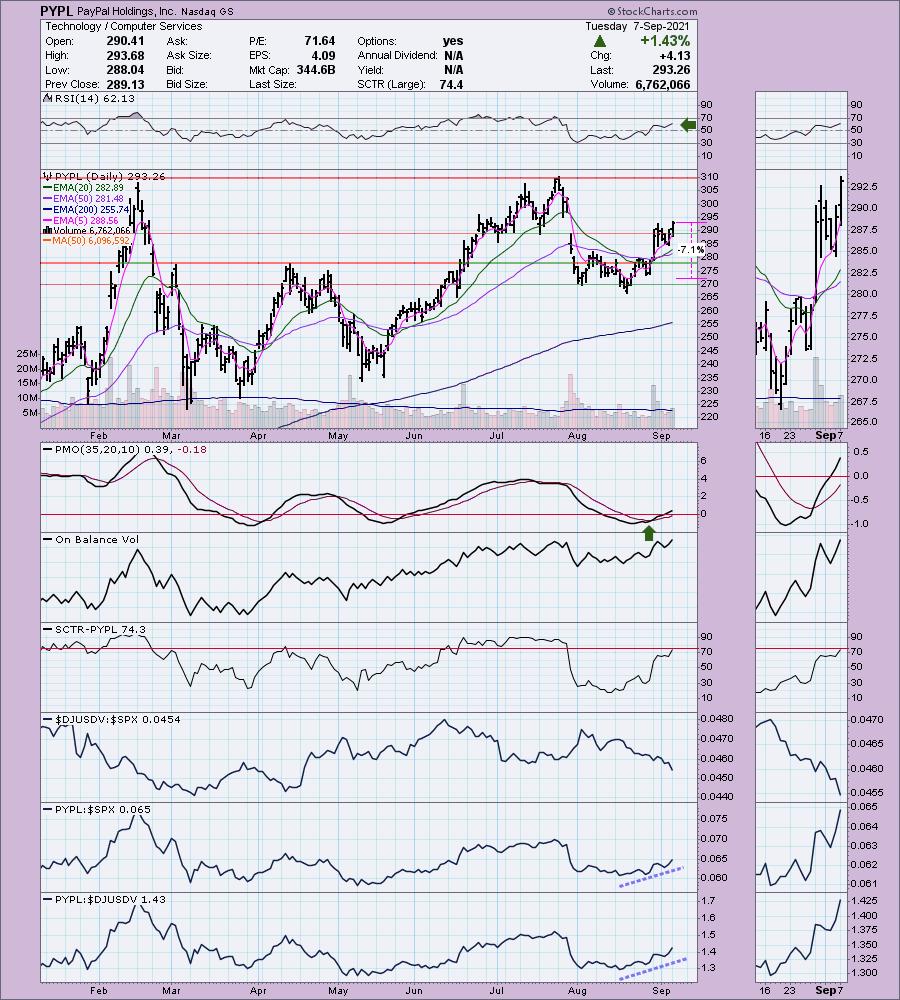
Below are the commentary and chart from Tuesday 9/7:
"PYPL is down -0.09% in after hours trading. I've covered PYPL several times. The most recent was on April 27th 2021. Timing was poor so the 7.7% stop was hit in May. The second time I covered it was on January 14th 2021. The position was never stopped out so it is currently up +18.5%. I covered it on September 29th 2021. The stop wasn't hit so that position is up 47.5% as of today.
PYPL is down -0.09% in after hours trading. I like today's breakout from a short-term flag formation. Price is making its way upward to cover the July gap down. The RSI is positive and the PMO is on an oversold crossover BUY signal from late August. The industry group is languishing, but PYPL is still outperforming the SPX. The stop can be adjusted, but I set it below those late August lows."
Below is today's chart:
The chart went south quickly, however, price is still staying above the 20/50-EMAs and it hasn't come close to our stop yet. Damage to relative strength was rather tame. My concern are the topping PMO and now negative RSI. Keep this one in your watch list, if it holds the 20/50-EMAs and the indicators improve, I like PYPL moving forward.
THIS WEEK's Sector Performance: 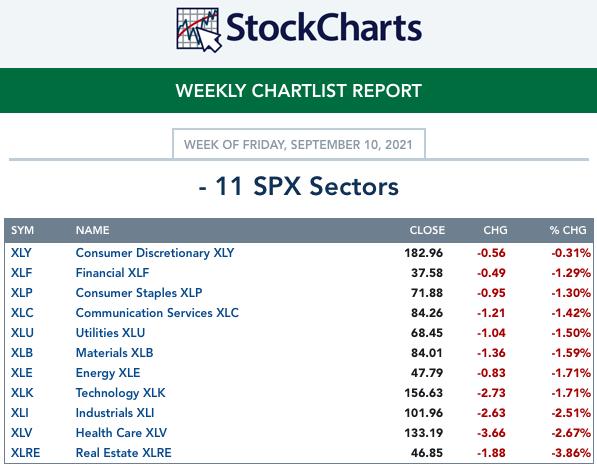
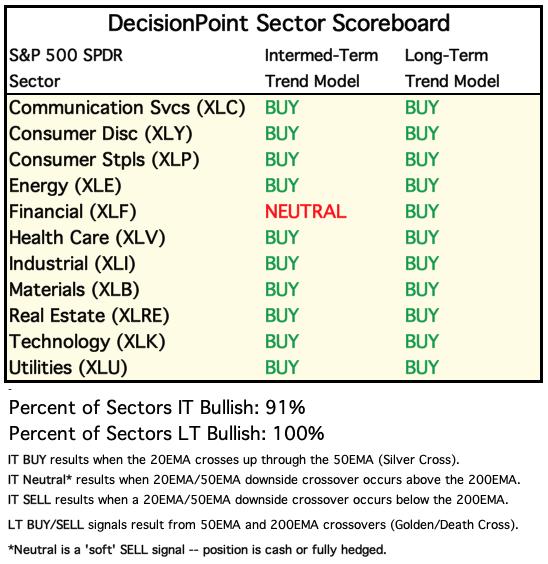
DecisionPoint Sector Scoreboard (Mechanical Trend Model Signals):
Click Here to view Carl's annotated Sector ChartList!
Short-term RRG: As far as the short-term RRG, XLK is losing strength. XLY just entered "Leading" and looks healthy on the chart. XLRE and XLC are in Leading, but they are beginning to rotate back toward Weakening.

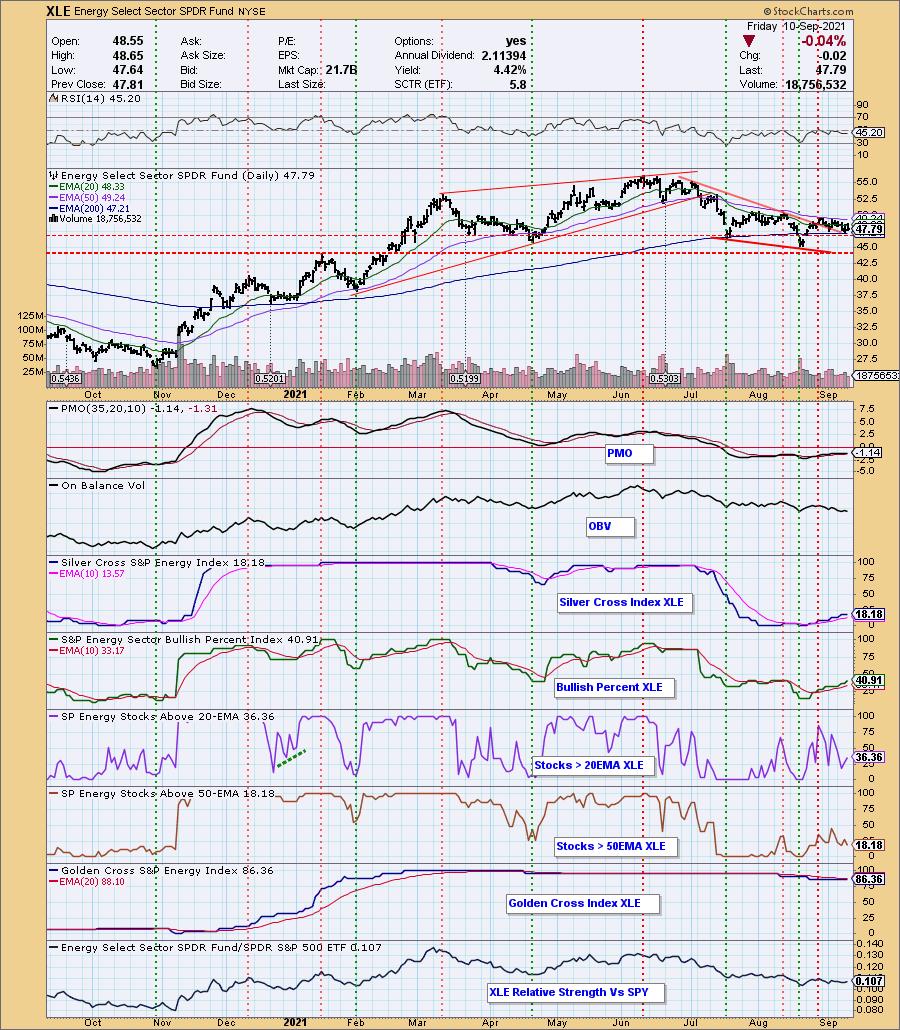
Sector to Watch: Energy (XLE)
There were only two sectors that met my criteria for "sector to watch", but both have negative momentum. I trust the Silver Cross Index (SCI) the most and I really like the shape of the SCI line right now. The BPI also looks fairly healthy. I'm bullish on Oil going into next week, so this sector could offer some opportunity, particularly because participation is still oversold.
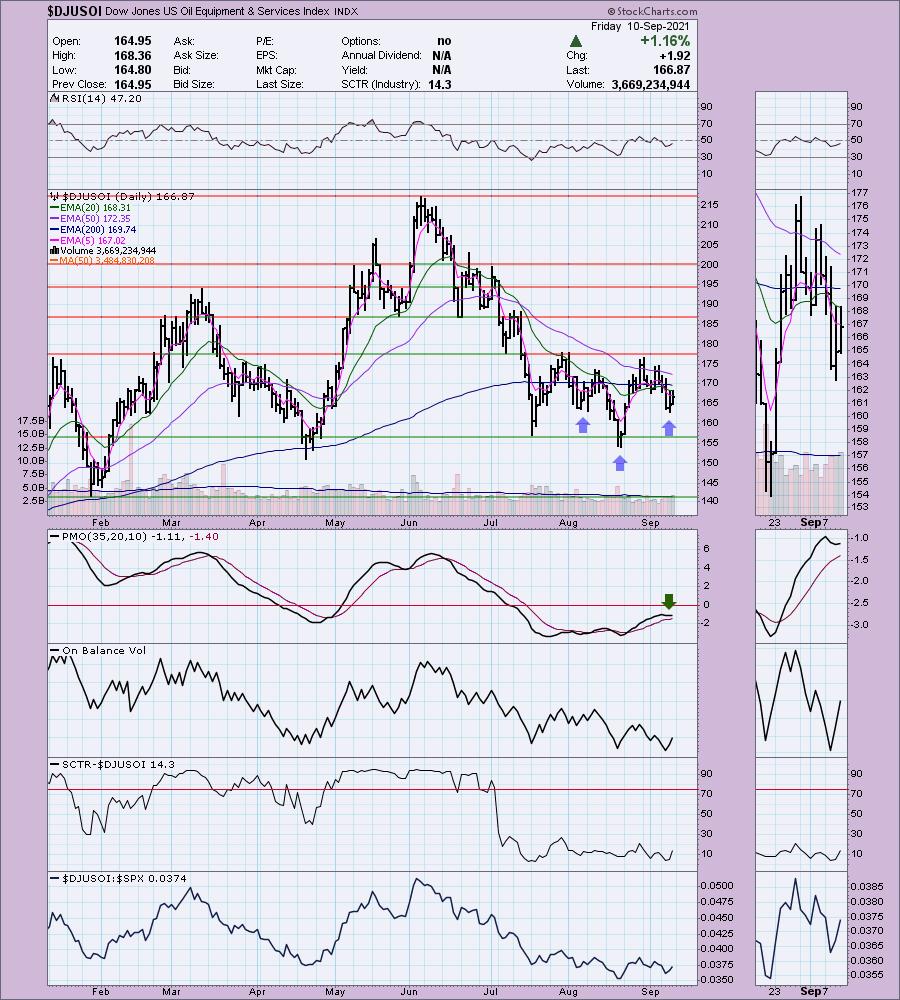
Industry Group to Watch: Oil Equipment & Services ($DJUSOI)
I wanted to seek out an industry group within XLE that might offer us some opportunity. Coal is rising parabolically, so I opted not to present it but there could be even more upside on Coal, it's just too overbought. I like Oil Equipment and Services. While the chart isn't 'ripe', there are bullish characteristics. We could be seeing the formation of a bullish reverse head and shoulders. Relative strength isn't optimal, but it does seem to be improving.
Go to our Sector ChartList on DecisionPoint.com to get an in depth view of all the sectors.
Technical Analysis is a windsock, not a crystal ball.
Have a great weekend & Happy Charting! Next Diamonds Report is Tuesday 9/14.
- Erin
erin@decisionpoint.com
Full Disclosure: I'm about 70% invested right now and 30% is in 'cash', meaning in money markets and readily available to trade with.
Watch the latest episode of DecisionPoint with Carl & Erin Swenlin on Mondays 7:00p EST or on the DecisionPoint playlist on the StockCharts TV YouTube channel here!
NOTE: The stocks reported herein are from mechanical trading model scans that are based upon moving average relationships, momentum and volume. DecisionPoint analysis is then applied to get five selections from the scans. The selections given should prompt readers to do a chart review using their own analysis process. This letter is not a call for a specific action to buy, sell or short any of the stocks provided. There are NO sure things or guaranteed returns on the daily selection of "diamonds in the rough."
Helpful DecisionPoint Links:
DecisionPoint Shared ChartList and DecisionPoint Chart Gallery
Price Momentum Oscillator (PMO)
Swenlin Trading Oscillators (STO-B and STO-V)
(c) Copyright 2021 DecisionPoint.com