
First, thank you to the readers who sent in symbol requests. I always enjoy seeing the kind of charts that interest you given you all have different analysis processes. However, there are clearly some similarities as some of the stocks that were on the list had been on my radar. For example, CWK was a "Stock to Review" yesterday. MRNA and SBUX have also been on my radar.
All of today's selections have merit, but there are some with slightly better setups. A few of today's requests had BIG days so I'm not expecting to see 'green' on them in tomorrow's spreadsheet. However, as I always say, this is an educational blog, not a recommendation or model portfolio service. If that is something you are interested in, I can point you in the right direction. Just send me an email.
Don't forget to sign up for tomorrow's Diamond Mine trading room! Look forward to seeing you all there. For those who haven't attended live, I hope you do one of these days. The chat room is very active among participants in the room. Here is the link to sign up. It is also below with the recording links as always.
Today's "Diamonds in the Rough" are: AMEH, HMC and TSCO.

RECORDING LINK Friday (9/3):
Topic: DecisionPoint Diamond Mine (09/03/2021) LIVE Trading Room
Start Time : Sep 3, 2021 09:00 AM
Meeting Recording Link.
Access Passcode: Sept-3rd
REGISTRATION FOR FRIDAY 9/10 Diamond Mine:
When: Sep 10, 2021 09:00 AM Pacific Time (US and Canada)
Topic: DecisionPoint Diamond Mine (9/10/2021) LIVE Trading Room
Register in advance for this webinar HERE.
Save the registration confirmation email with login instructions in case Zoom doesn't notify you in time.


Julius de Kempenaer joined Erin in the free DP Trading Room this week! The recording link is below:
Free DP Trading Room (9/7) RECORDING LINK:
Topic: DecisionPoint Trading Room
Start Time : Sep 7, 2021 09:00 AM PT
Meeting Recording Link HERE.
Access Passcode: Sept@7th
For best results, copy and paste the access code to avoid typos.
Welcome to DecisionPoint Daily Diamonds, wherein I highlight five "Diamonds in the Rough." These are selected from the results of my DecisionPoint scans, which search for stocks that could benefit from the trend and condition of the market. Remember, these are not recommendations to buy or sell, but are the most interesting of the stocks that surfaced in my scans. My objective is to save you the work of the initial, tedious culling process, but you need to apply your own analysis to see if these stocks pique your interest as well. There are no guaranteed winners here!
Ashland Global Holdings Inc. (ASH)
EARNINGS: 11/9/2021 (AMC)
Ashland Global Holdings, Inc. is a global specialty chemicals company. The company engages in the manufacture and distribution of adhesives, architectural coatings, automotive, construction, energy, food and beverage, personal care, and pharmaceutical. It operates through the following segments: Consumer Specialties; Industrial Specialties; and Other. The Consumer Specialties segment comprises of life sciences, personal care & household. The Industrial Specialties segment comprises of specialty additives and performance adhesives. The Other segment include intermediates and solvents. The company was founded in 1924 and is headquartered in Wilmington. DE.
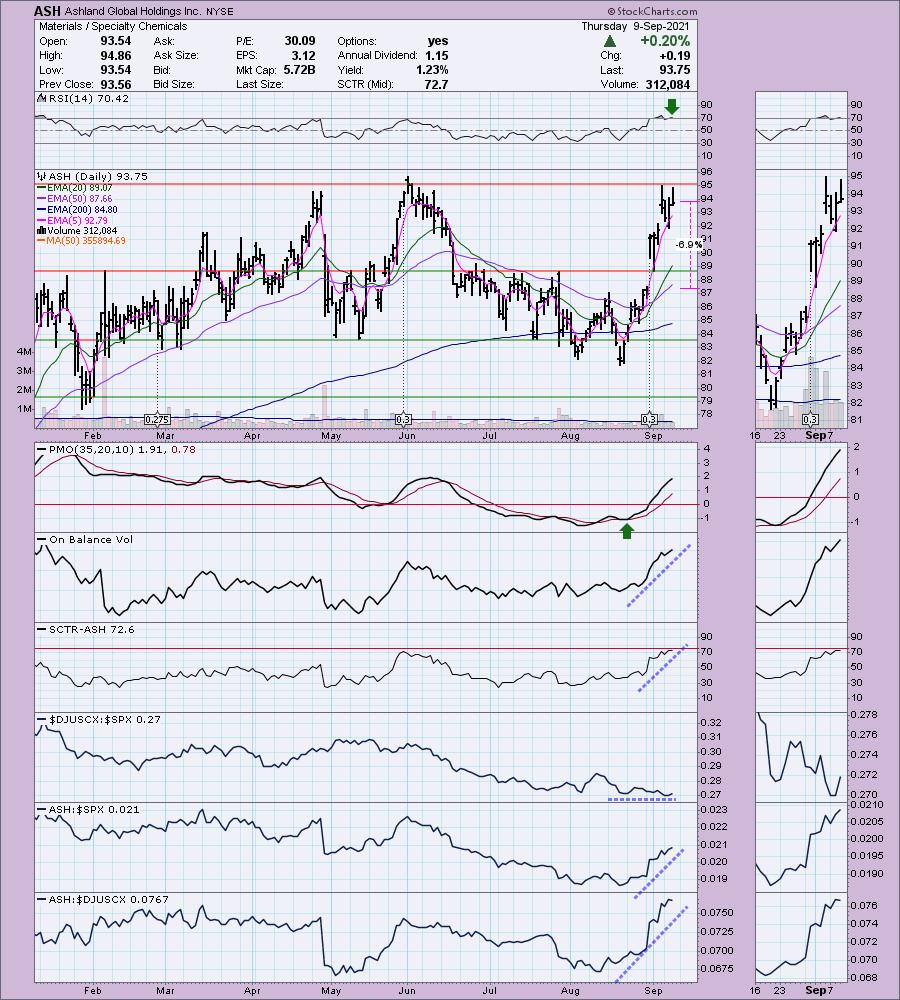
ASH is unchanged in after hours trading. This one was in my scan results yesterday, but I opted not to show it because the RSI was getting overbought. Today it has actually entered overbought territory and we have a long tail on today's OHLC bar. This one looks good, but it is likely ready for a bit of a pullback before a breakout. The industry group hasn't done that well but ASH is definitely holding its own. Volume has been heavy to the upside which does suggest a breakout in the future. The PMO is on an oversold BUY signal which is good. I also like that I can set a tight stop if I wish. This is about as deep as I would go. It is 7% and settles just under gap support from last week.
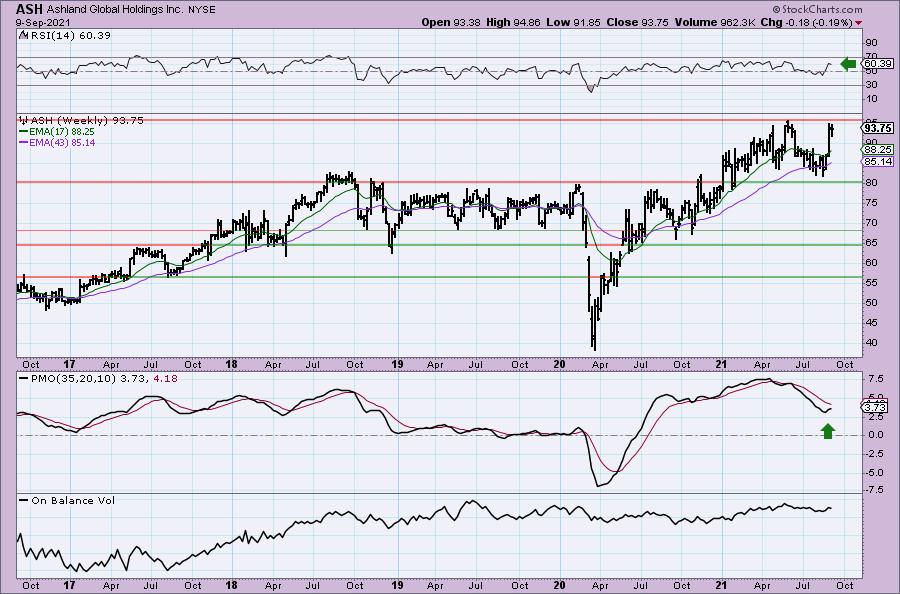
The weekly chart shows us that it is attempting to breakout to new all-time highs. The weekly RSI is positive and I really like that the weekly PMO has turned up. As I said, the main concern would be whether it needs a pullback before a breakout. This week's trading could be the digestion it needs before the breakout.
Brunswick Corp. (BC)
EARNINGS: 10/28/2021 (BMO)
Brunswick Corp. engages in the design, manufacture, and marketing of recreational marine products including marine engines, boats, and parts and accessories for those products. It operates through the following segments: Propulsion, Parts & Accessories and Boat. The Propulsion segment manufactures and markets a full range of outboard, sterndrive, and inboard engines, as well as propulsion-related controls, propellers, and rigging parts and accessories. The Parts & Accessories segment manufactures markets, and supplies parts and accessories for both marine and non-marine markets. The Boat segment designs, manufactures and markets boat brands and products such as Sea Ray sport boats and cruisers; Bayliner sport cruisers, runabouts, and Heyday wake boats; Boston Whaler fiberglass offshore boats; Lund fiberglass fishing boats; Crestliner, Cypress Cay, Harris, Lowe, Lund, and Princecraft aluminum fishing, utility, pontoon boats, and deck boats; and Thunder Jet heavy-gauge aluminum boats. The company was founded by John Brunswick in 1845 and is headquartered in Mettawa, IL.
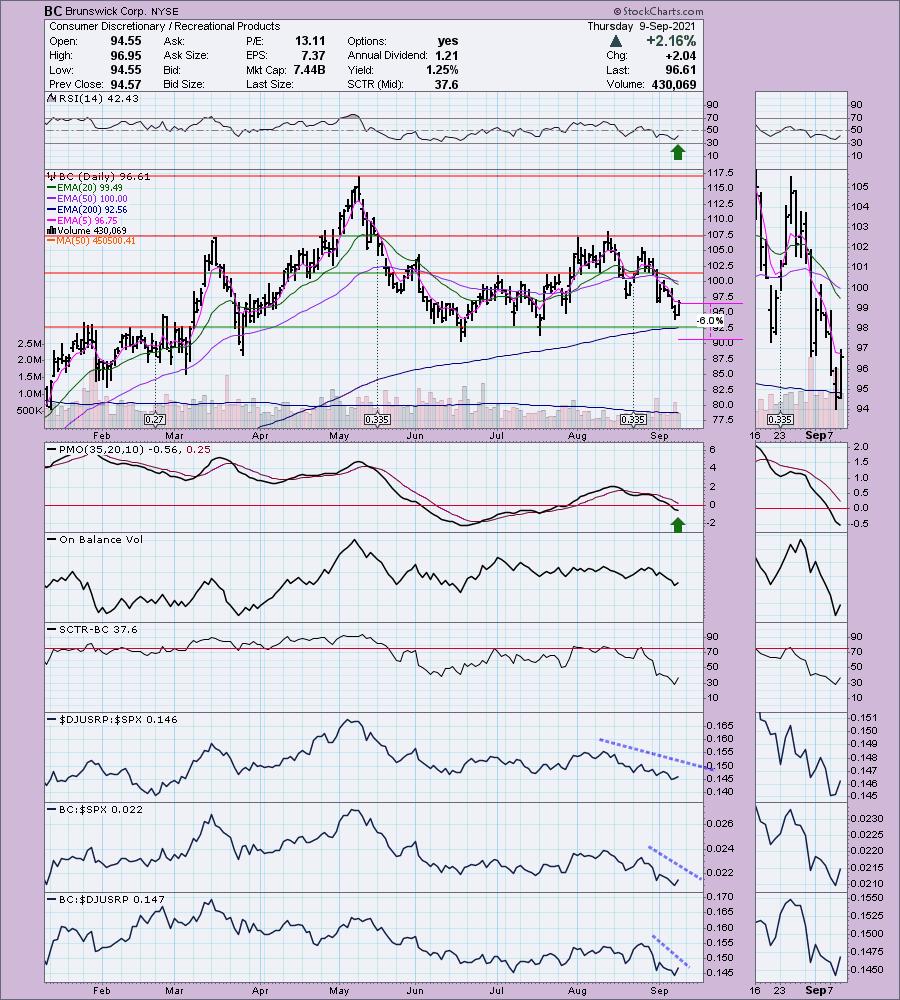
BC is unchanged in after hour trading. This is likely the weakest chart of the bunch, but it does have merit. For those of you who like to catch bottoms early as price bounces off key moving averages, then this one's for you. There was a bearish double-top and while the minimum downside target hasn't been hit (the target lies at the late March low), it has bounced off the 200-EMA. The RSI is negative but is rising out of oversold territory. The PMO is negative and falling, but we do see some deceleration. Relative strength isn't there yet. I would definitely set a hard stop. You could set it at 6% to take into account the June/July lows. Personally, I'm not sure I'd want it if it lost support at the 200-EMA.
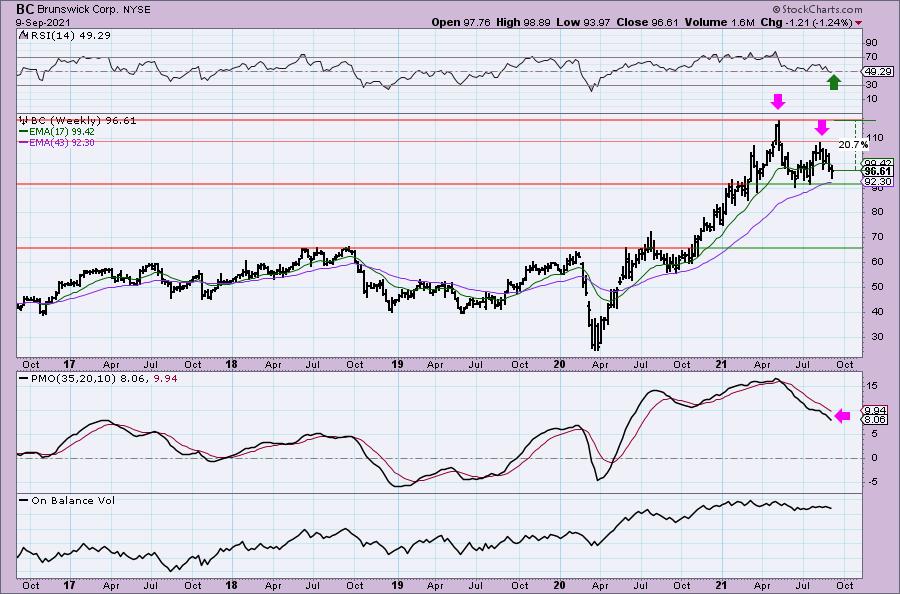
The weekly chart is a problem. I spot a large double-top and the weekly PMO is falling. The weekly RSI is mostly neutral but technically in negative territory. This would be a short-term play.
Cushman & Wakefield plc (CWK)
EARNINGS: 11/4/2021 (AMC)
Cushman & Wakefield Plc engages in the provision of commercial real estate services It operates through the following geographical segments: Americas; Europe, the Middle East and Africa (EMEA); and Asia Pacific (APAC). The Americas segment consists of operations located in the United States, Canada and key markets in Latin America. The EMEA segment includes operations in the UK, France, Netherlands and other markets in Europe and the Middle East. The APAC segment comprises of operations in Australia, Singapore, China and other markets in the Asia Pacific region. The company was founded in 1917 is headquartered in London, the United Kingdom.
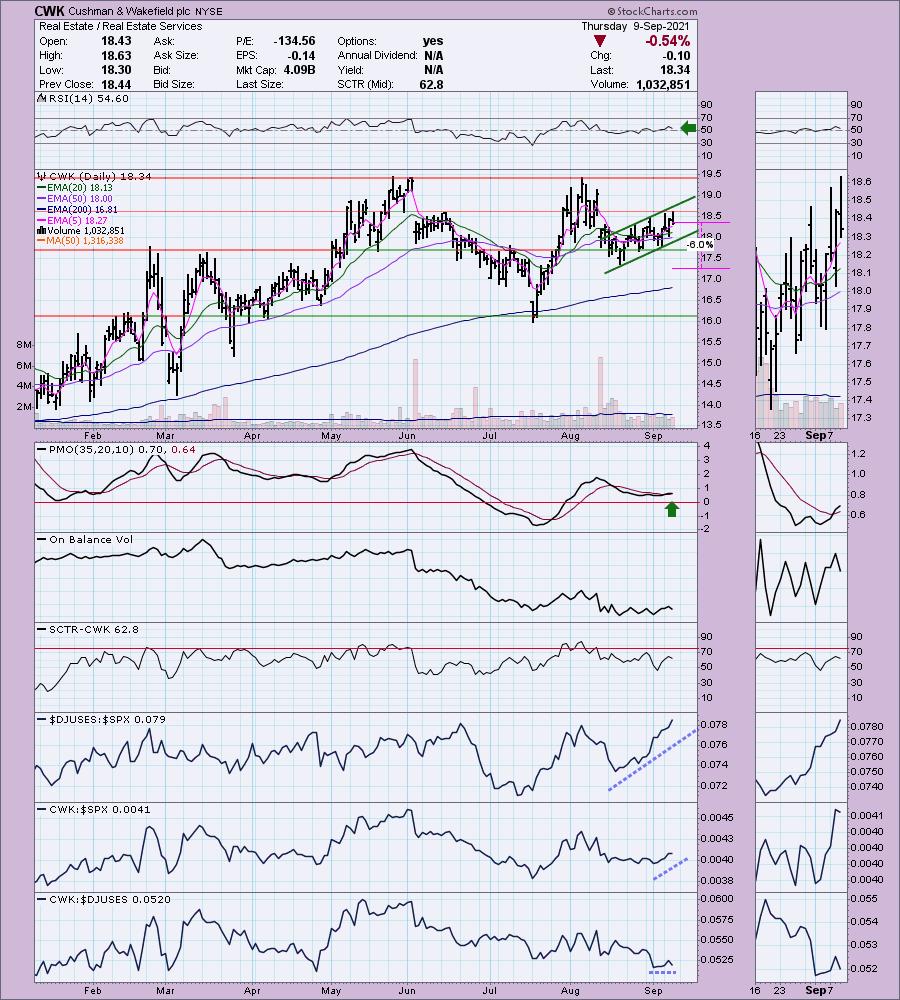
CWK is unchanged in after hours trading. I covered CWK on August 5th 2021. While it traded below the stop, it was never actually triggered on the close. However, the position is down -4.9% currently. Now we may have a much better entry. The RSI is positive and the PMO just executed a crossover BUY signal. Volume definitely could be better when you look at the OBV. The SCTR is respectable. The industry group has been on fire and CWK is performing in line with the group. It is also starting to outperform the SPX. It was picked too late in the game last month. The stop can be set at a reasonable 6%.
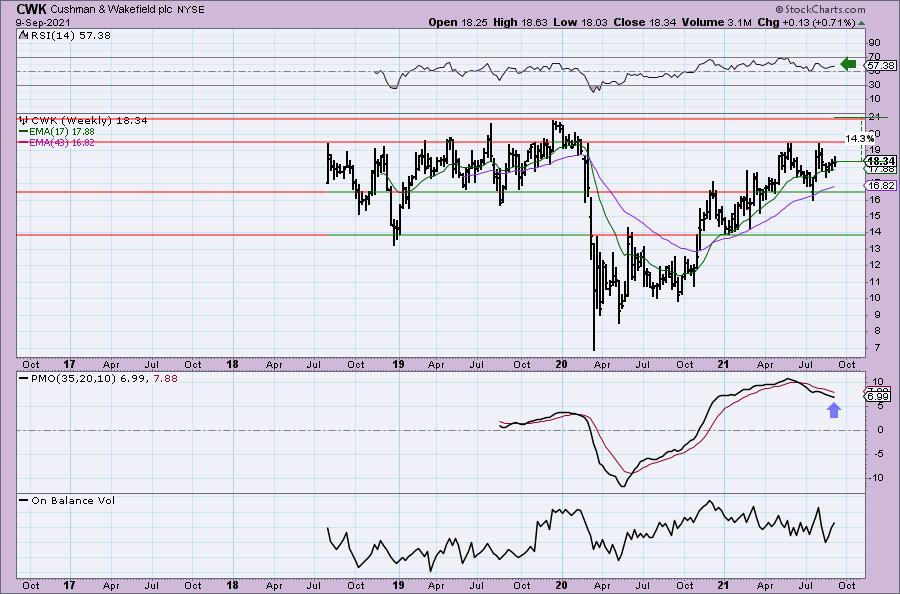
The RSI is positive, but the weekly PMO is unfavorable for an intermediate-term investment.
Moderna Inc. (MRNA)
EARNINGS: 10/28/2021 (BMO)
Moderna, Inc. engages in the development of transformative medicines based on messenger ribonucleic acid (mRNA). Its product pipeline includes the following modalities: prophylactic vaccines, cancer vaccines, intratumoral immuno-oncology, localized regenerative therapeutics, systemic secreted therapeutics, and systemic intracellular therapeutics. The company was founded by Noubar B. Afeyan, Robert S. Langer, Jr., Derrick J. Rose and Kenneth R. Chien in 2010 and is headquartered in Cambridge, MA.
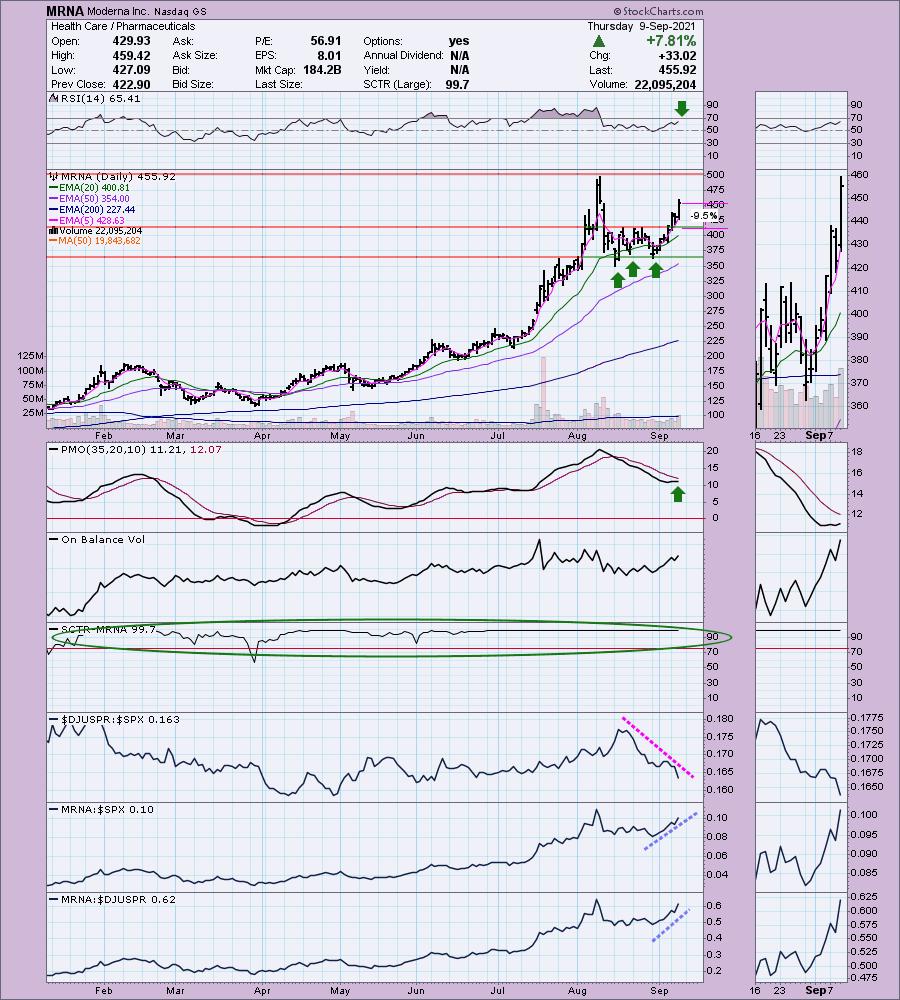
MRNA is down -0.09% in after hours trading. I was shocked to find out that I have never presented MNRA as a "Diamond in the Rough" before. I really wish I'd seen the chart when it broke out after a much needed pullback. It was up over 7% today so I would look for some digestion tomorrow. The RSI is positive and no longer overbought. The PMO hasn't actually triggered a crossover BUY signal, but it is "scooping" upward. We have a bullish triple-bottom formation that price broke out of. We should see MRNA reach its all-time highs. The SCTR is top-notch and has been through most of the past 8 months. While the industry group is floundering, MRNA has outperformed the SPX. With today's big gain, we have to set a deep stop of 9.5% at a minimum.
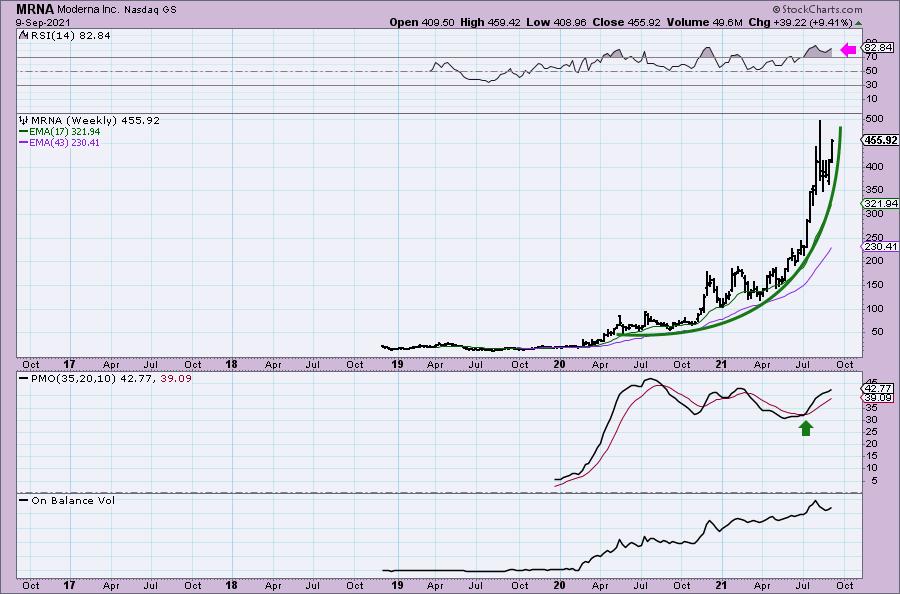
The weekly chart shows a nearly textbook parabola. These never end well. The weekly RSI is highly overbought. On the bright side the PMO is bullish.
Starbucks Corp. (SBUX)
EARNINGS: 11/4/2021 (AMC)
Starbucks Corp. engages in the production, marketing, and retailing of specialty coffee. It operates through the following segments: Americas; China/Asia Pacific (CAP); Europe, Middle East, and Africa (EMEA); and Channel Development. The Americas, CAP, EMEA segments sells coffee and other beverages, complementary food, packaged coffees, single-serve coffee products, and a focused selection of merchandise through company-oriented stores, and licensed stores. The Channel Development segment include sales of packaged coffee, tea, and ready-to-drink beverages to customers outside of its company-operated and licensed stores. The company brands include Evolution Fresh, Teavana, Tazo Tea and Seattle's Best. Starbucks was founded by Jerry Baldwin and Howard D. Schultz on November 4, 1985 and is headquartered in Seattle, WA.
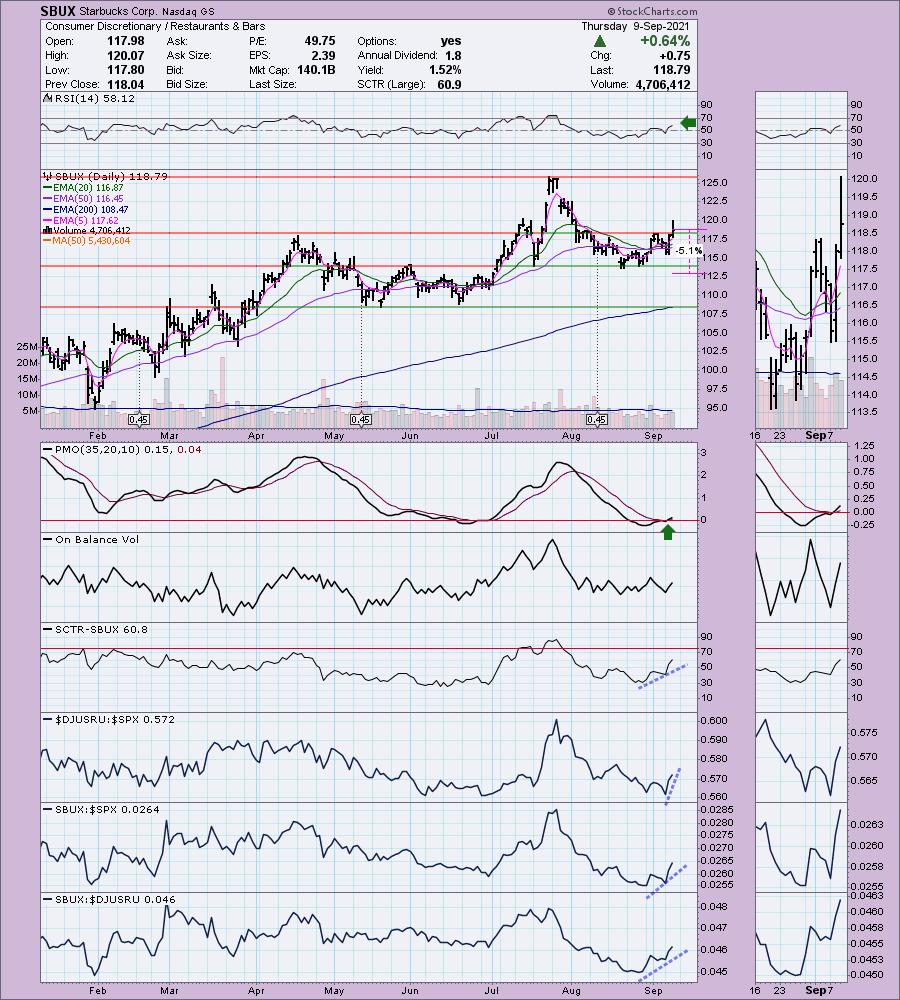
SBUX is down -0.04% in after hours trading. I've covered SBUX numerous times with the latest being on July 8th 2021. The stop was never hit so it is up a modest +2.4%. The two other times-- May 27th 2020: The stop was never hit so the position is up +51.1%. March 2nd 2021: The stop was never hit so it is up +10.8%.
I love today's breakout. I didn't annotate it but I believe we have a small reverse head and shoulders pattern that executed with this breakout. The minimum upside target would be below the all-time high, but remember it is considered a "minimum" upside target. The RSI is positive and the PMO just had a crossover BUY signal trigger. Relative strength looks great. I also like that I can set a modest stop at 5.1%.
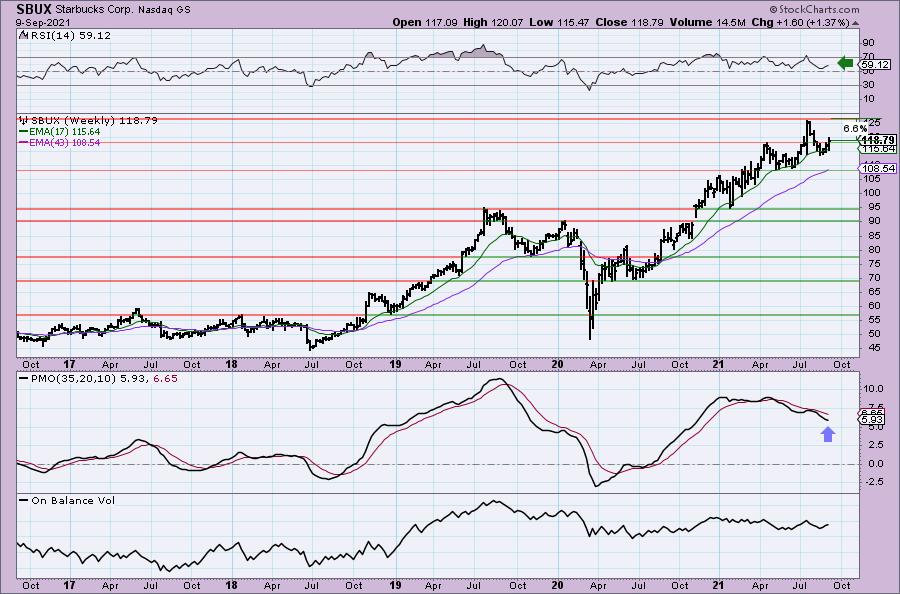
The weekly chart looks great except for the weekly PMO which hasn't turned up yet.
Don't forget, on Thursdays I look at reader-requested symbols, so shoot me an email at erin@decisionpoint.com. I read every email I receive and try to answer them all!
Current Market Outlook:
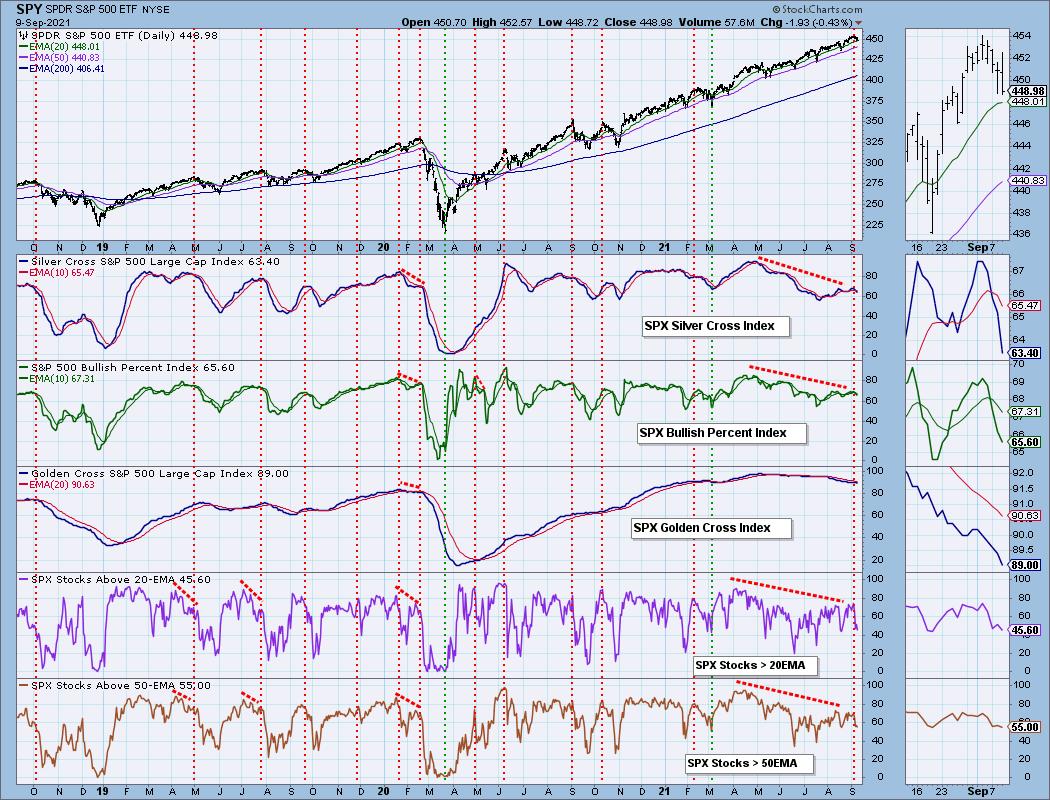
Market Environment: It is important to consider the odds for success by assessing the market tides. The following chart uses different methodologies for objectively showing the depth and trend of participation for intermediate- and long-term time frames.
- The Silver Cross Index (SCI) shows the percentage of SPX stocks on IT Trend Model BUY signals (20-EMA > 50-EMA)
- The Golden Cross Index (GCI) shows the percentage of SPX stocks on LT Trend Model BUY signals (50-EMA > 200-EMA)
- The Bullish Percent Index (BPI) shows the percentage of SPX stocks on Point & Figure BUY signals.
Don't forget that as a "Diamonds" member, you have access to our GCI/SCI curated ChartList on DecisionPoint.com. You'll find it under "Members Only" links on the left side on the Blogs and Links Page.
Here is the current chart:
Full Disclosure: I'm about 70% invested and 30% is in 'cash', meaning in money markets and readily available to trade with.
Technical Analysis is a windsock, not a crystal ball.
Happy Charting!
- Erin
erin@decisionpoint.com
Watch the latest episode of DecisionPoint with Carl & Erin Swenlin on Mondays 7:00p EST or on the DecisionPoint playlist on the StockCharts TV YouTube channel here!
NOTE: The stocks reported herein are from mechanical trading model scans that are based upon moving average relationships, momentum and volume. DecisionPoint analysis is then applied to get five selections from the scans. The selections given should prompt readers to do a chart review using their own analysis process. This letter is not a call for a specific action to buy, sell or short any of the stocks provided. There are NO sure things or guaranteed returns on the daily selection of "Diamonds in the Rough."
Helpful DecisionPoint Links:
DecisionPoint Shared ChartList and DecisionPoint Chart Gallery
Price Momentum Oscillator (PMO)
Swenlin Trading Oscillators (STO-B and STO-V)
For more links, go to DecisionPoint.com