
The Diamond Scans turned up mostly empty. I did find a few from the results, but I ended up doing research within a few strong industry groups and found two more for you to look at. I don't have a lengthy "short list" today. I just didn't find that many candidates. That is usually a sign of a market correction ahead or a possible short-term bottom on the horizon.
The market dropped below the short-term rising bottoms trendline and is now getting ready to test the 50-EMA and the intermediate-term rising bottoms trendline. I'll be covering this in today's DP Alert blog.
Interestingly I haven't had any stops hit in my account... yet. However, I'm tightening up some stops to protect against a possible correction should the intermediate-term rising trend be compromised. Stay cautious!
Today's "Diamonds in the Rough" are: OII, TXN, VRSN and VAC.
"Short List" (no order): FMX, NAD, ARCC, NGS and CNQ.

RECORDING LINK Friday (9/10):
Topic: DecisionPoint Diamond Mine (9/10/2021) LIVE Trading Room
Start Time : Sep 10, 2021 09:02 AM
Meeting Recording Link HERE.
Access Passcode: Sept@10th
REGISTRATION FOR FRIDAY 9/17 Diamond Mine:
When: Sep 17, 2021 09:00 AM Pacific Time (US and Canada)
Topic: DecisionPoint Diamond Mine (9/17/2021) LIVE Trading Room
Register in advance for this webinar HERE.
Save the registration confirmation email with login instructions in case Zoom doesn't notify you in time.

Free DP Trading Room (9/13) RECORDING LINK:
Topic: DecisionPoint Trading Room
Start Time : Sep 13, 2021 09:01 AM
Meeting Recording LINK.
Access Passcode: Sept/13th
For best results, copy and paste the access code to avoid typos.
Welcome to DecisionPoint Daily Diamonds, wherein I highlight five "Diamonds in the Rough." These are selected from the results of my DecisionPoint scans, which search for stocks that could benefit from the trend and condition of the market. Remember, these are not recommendations to buy or sell, but are the most interesting of the stocks that surfaced in my scans. My objective is to save you the work of the initial, tedious culling process, but you need to apply your own analysis to see if these stocks pique your interest as well. There are no guaranteed winners here!
Oceaneering Intl, Inc. (OII)
EARNINGS: 10/27/2021 (AMC)
Oceaneering International, Inc. engages in the provision of engineered services and products. It operates through the following business segments: Subsea Robotics, Manufactured Products, Offshore Projects Group (OPG), Integrity Management & Digital Solutions (IMDS), and Aerospace and Defense Technologies (ADTech). The Subsea Robotics segment consists of remotely operated vehicle for drilling support and vessel-based services, including subsea hardware installation, construction, pipeline inspection, survey and facilities inspection, maintenance, and repair. The Manufactured Products segment comprises of manufactured products business unit as well as commercial theme park entertainment systems and automated guided vehicle technology. The OPG segment focuses on subsea installation and intervention, including riserless light well intervention services, inspection, maintenance, and repair services. The IMDS segment covers asset integrity management services, software and analytical solutions for the bulk cargo maritime industry, and digital and connectivity solutions for the energy industry. The company was founded in 1969 and is headquartered in Houston, TX.
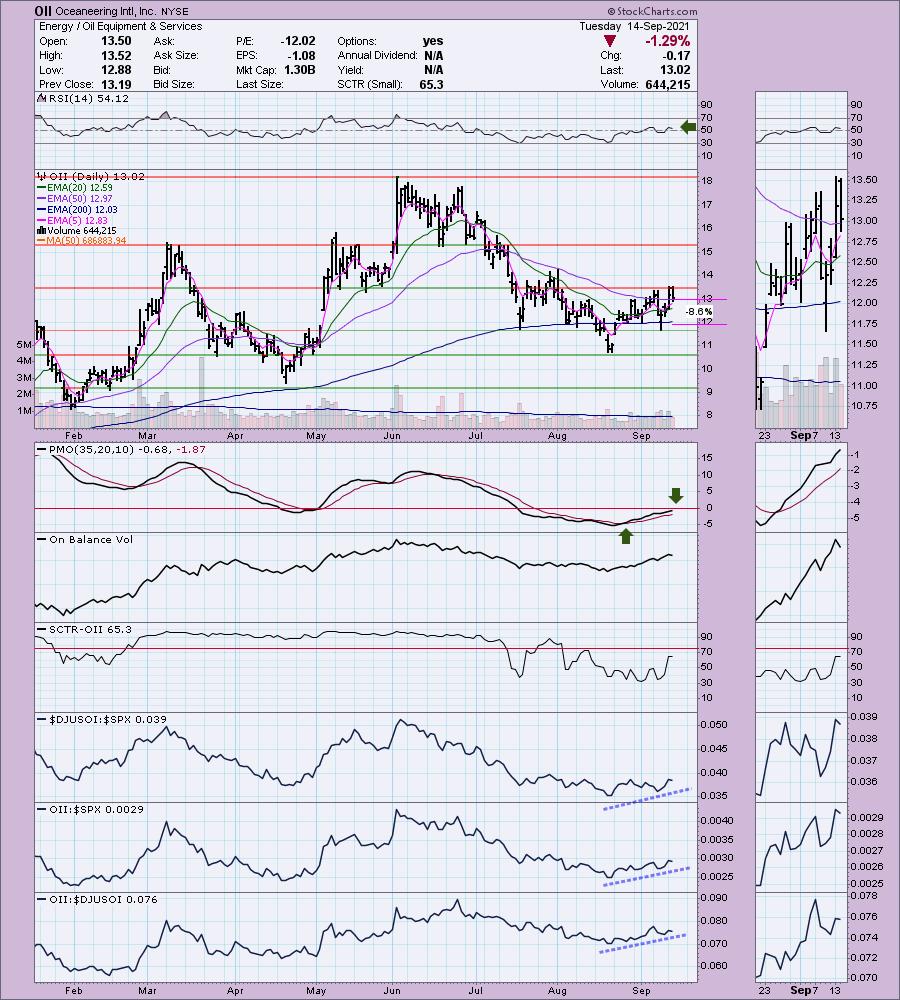
OII is unchanged in after hours trading. I covered OII in the February 25th 2021 Diamonds Report. The position was up over 30% at the March high. Eventually, on the correction, the 11% stop was hit.
I actually brought this one to the table on my Monday taping of "Your Daily Five" for StockChartsTV. Here is a link to the episode (about 10 minutes long). Of course it pulled back heavily today, but the chart is no less interesting. In fact we now have an interesting opportunity for entry. Currently the RSI is positive and relative strength is strong. Despite an over 1.25% decline today the PMO saw almost no damage. I see a reverse head and shoulders pattern that is ready to execute to the upside as expected. The stop is set below the 200-EMA.
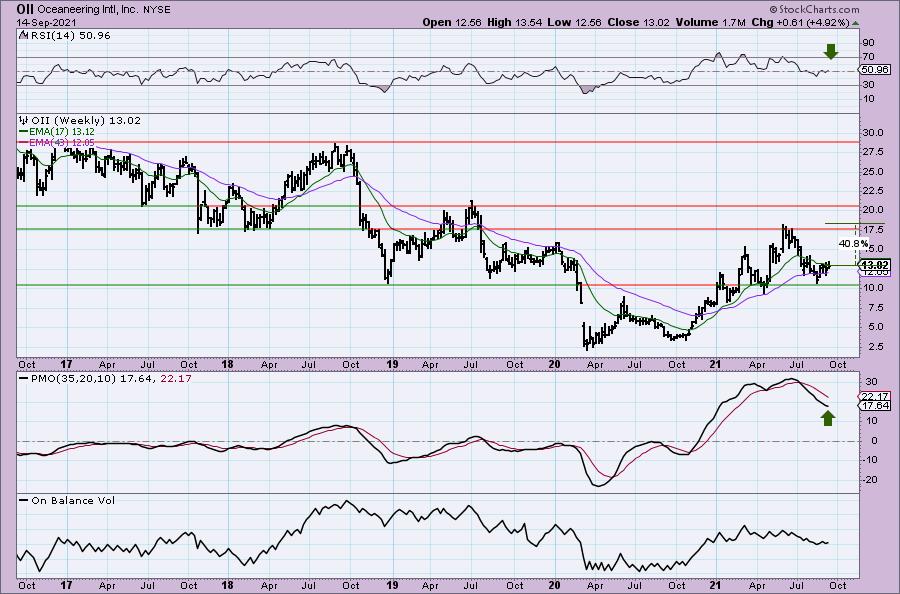
OII is bouncing off strong support. The weekly RSI is back in positive territory and the PMO appears to be decelerating its decline. Upside potential is excellent if it gets back to the 2021 high.
Texas Instruments, Inc. (TXN)
EARNINGS: 10/19/2021 (AMC)
Texas Instruments Incorporated engages in the design, manufacture, test, and sell analog and embedded semiconductors, which include industrial, automotive, personal electronics, communications equipment, and enterprise systems. It operates through the following segments: Analog and Embedded Processing. The Analog segment semiconductors change real-world signals, such as sound, temperature, pressure or images, by conditioning them, amplifying them and often converting them to a stream of digital data that can be processed by other semiconductors, such as embedded processors. The Embedded Processing segment designed to handle specific tasks and can be optimized for various combinations of performance, power and cost, depending on the application. The company was founded by Cecil H. Green, Patrick Eugene Haggerty, John Erik Jonsson, and Eugene McDermott in 1930 and is headquartered in Dallas, TX.
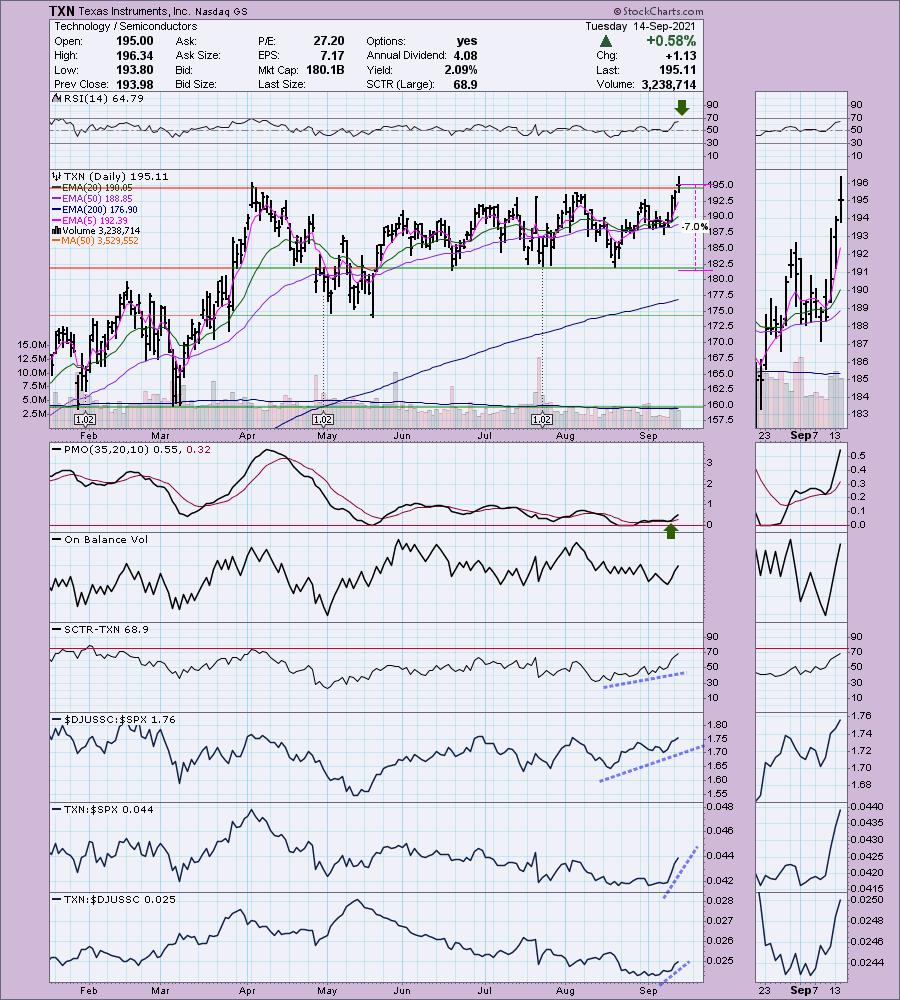
TXN is down -0.14% in after hours trading. This base breakout looks great. The RSI is positive and not overbought. The PMO bottomed above its signal line and took off out of oversold territory. Relative strength continues to improve. My one complaint is the OBV. We should've seen a breakout to new highs like price. However, I'll forgive that given the rally has seen heavy volume. The stop is set below support at 7%.
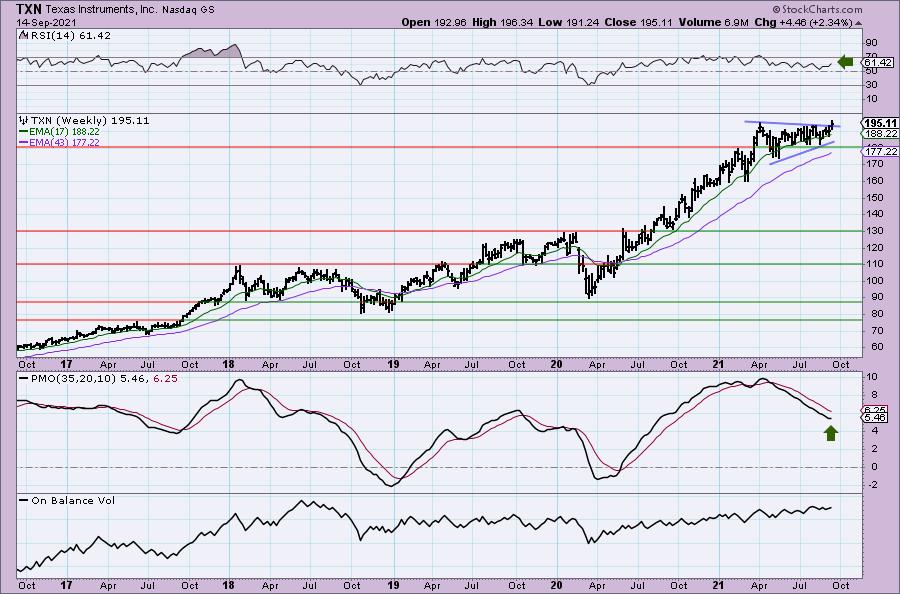
We see a breakout from a symmetrical triangle. These are continuation patterns so the expectation is an upside breakout. However, I also spy a long flagpole attached to this pennant. This suggests a minimum upside target that is well-above current all-time highs. The weekly RSI is positive and the weekly PMO is decelerating.
Marriott Vacations Worldwide Corp. (VAC)
EARNINGS: 11/8/2021 (AMC)
Marriott Vacations Worldwide Corp. is a global vacation company, which engages in vacation ownership, exchange, rental and resort and property management, along with related businesses, products and services. It operates through Vacation Ownership and Exchange & Third-Party Management. The Vacation Ownership segment includes develops, markets, sells, and manages vacation ownership and related products under the Marriott Vacation Club, Grand Residences by Marriott, Sheraton Vacation Club, Westin Vacation Club, and Hyatt Residence Club brands. The Exchange and Third-Party Management segment comprises exchange networks and membership programs, as well as management of resorts and lodging properties. The company was founded in 1984 and is headquartered in Orlando, FL.
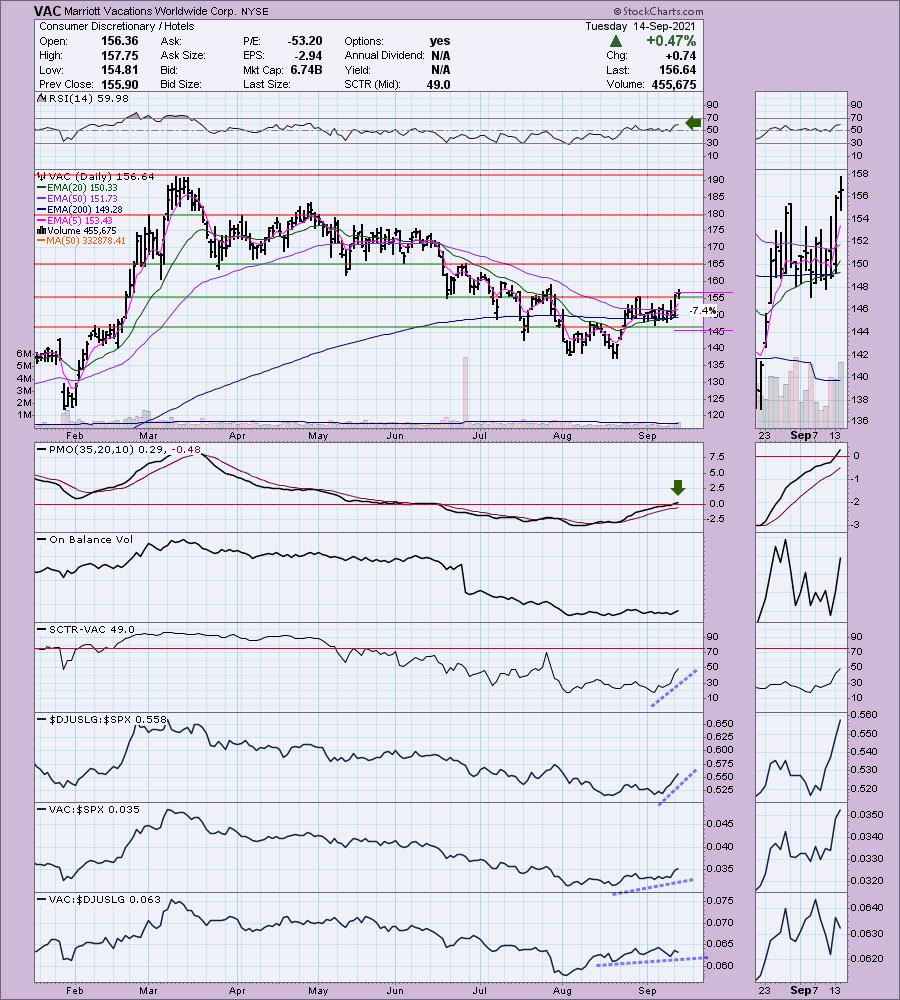
VAC is down -0.65% in after hours trading. VAC broke out today from a trading range. It now appears that it will remain safely above its 50-EMA. The RSI is positive and the PMO just hit positive territory after an oversold crossover BUY signal. The Hotels industry group broke out today. I liked this chart best, but there are plenty of other nice looking charts in this group to consider. The stop is set below support at 7.4%.
One concern is that price is still trading within a declining trend channel on the weekly chart. However, the RSI is hitting positive territory again and the PMO is beginning to bottom. Upside potential is about +23%.

VeriSign, Inc. (VRSN)
EARNINGS: 10/21/2021 (AMC)
VeriSign, Inc. provides domain name registry services and Internet infrastructure, which enables Internet navigation for many of the world's most recognized domain names. It enables the security, stability, and resiliency of key Internet infrastructure and services, including providing root zone maintainer services. The company was founded by D. James Bidzos on April 12, 1995 and is headquartered in Reston, VA.
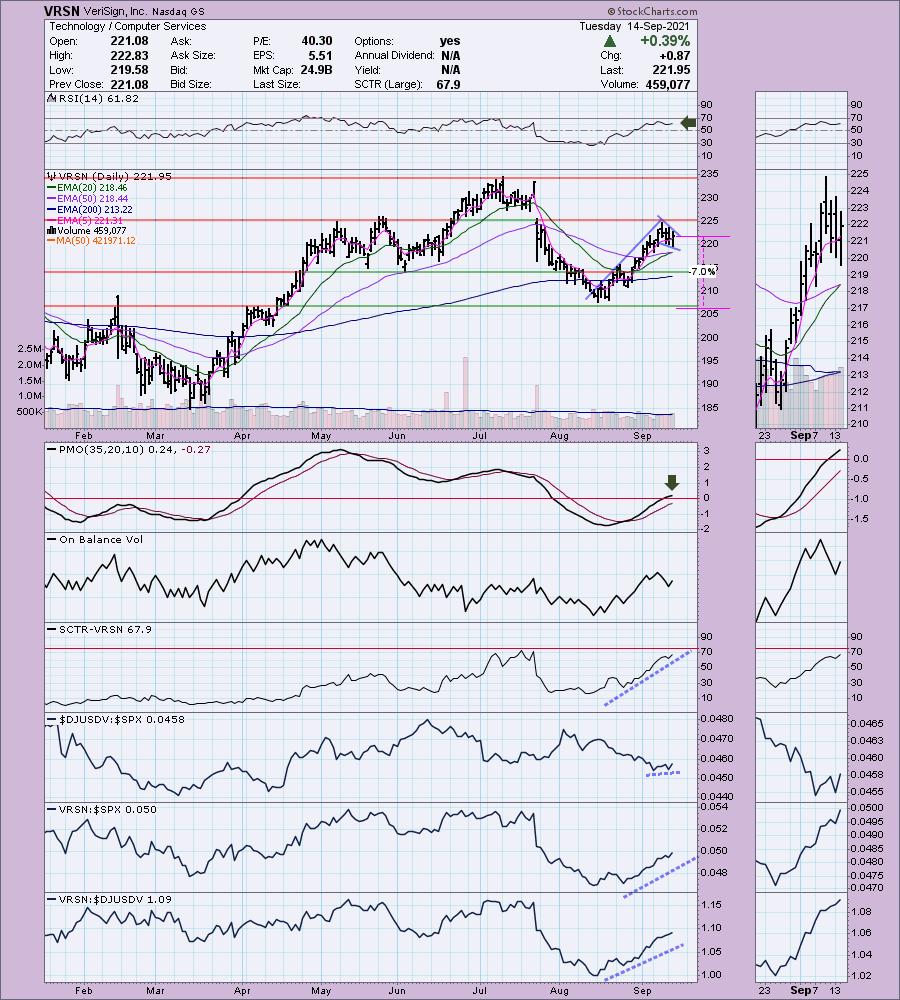
VRSN is unchanged in after hours trading. Full disclosure: I own this stock. I decided to present it on this nice pullback to the 50-EMA that formed a flag on a flagpole. A new IT Trend Model "Silver Cross" BUY signal was triggered today. The PMO has reached positive territory and the RSI is also positive. You can set a reasonable stop at 7% below the August low. Now that relative performance is picking back up for the group, I think this one will continue to move higher as it is a clear outperformer.
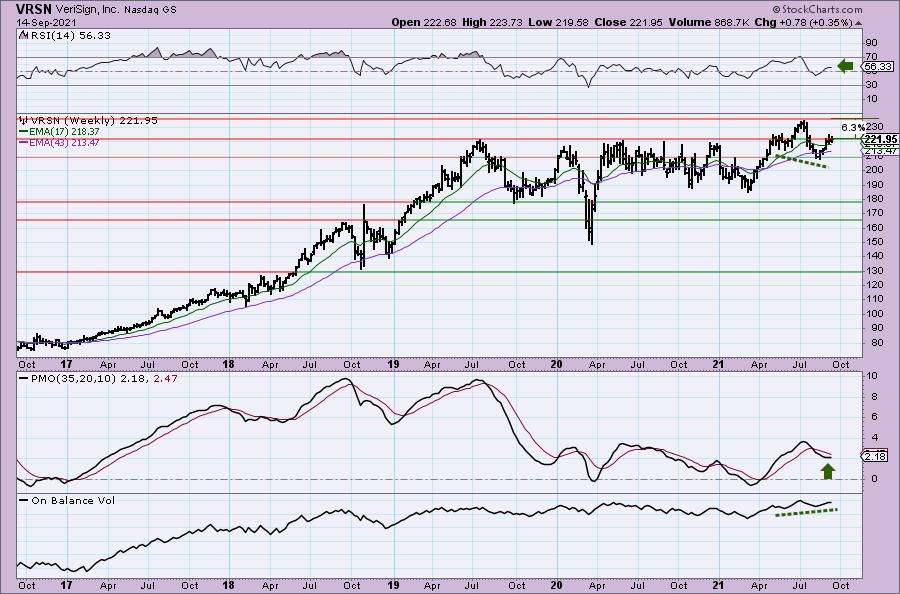
Price is struggling somewhat against overhead resistance on the weekly chart, but the indicators are looking very bullish. The weekly PMO has turned up and the weekly RSI is positive. There is even a positive OBV divergence. I would look for VRSN to keep on hitting new all-time highs.
Don't forget, on Thursdays I look at reader-requested symbols, so shoot me an email at erin@decisionpoint.com. I read every email I receive and try to answer them all!
Current Market Outlook:
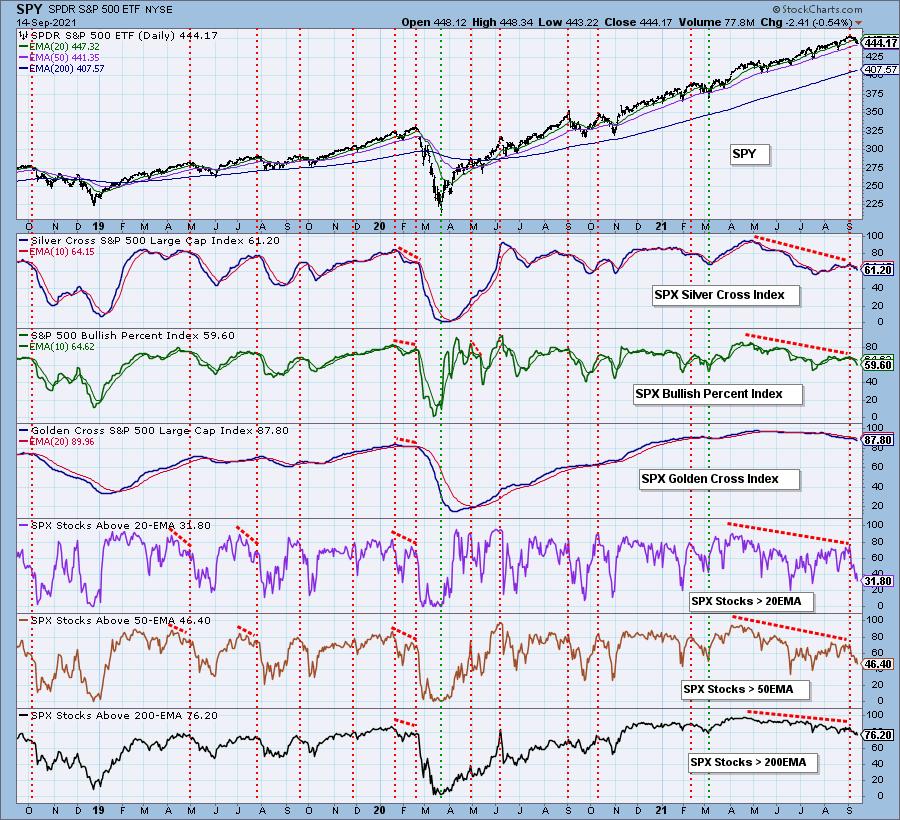
Market Environment: It is important to consider the odds for success by assessing the market tides. The following chart uses different methodologies for objectively showing the depth and trend of participation for intermediate- and long-term time frames.
- The Silver Cross Index (SCI) shows the percentage of SPX stocks on IT Trend Model BUY signals (20-EMA > 50-EMA)
- The Golden Cross Index (GCI) shows the percentage of SPX stocks on LT Trend Model BUY signals (50-EMA > 200-EMA)
- The Bullish Percent Index (BPI) shows the percentage of SPX stocks on Point & Figure BUY signals.
Don't forget that as a "Diamonds" member, you have access to our GCI/SCI curated ChartList on DecisionPoint.com. You'll find it under "Members Only" links on the left side on the Blogs and Links Page.
Here is the current chart:
Full Disclosure: I'm about 70% invested and 30% is in 'cash', meaning in money markets and readily available to trade with.
Technical Analysis is a windsock, not a crystal ball.
Happy Charting!
- Erin
erin@decisionpoint.com
Watch the latest episode of DecisionPoint with Carl & Erin Swenlin on Mondays 7:00p EST or on the DecisionPoint playlist on the StockCharts TV YouTube channel here!
NOTE: The stocks reported herein are from mechanical trading model scans that are based upon moving average relationships, momentum and volume. DecisionPoint analysis is then applied to get five selections from the scans. The selections given should prompt readers to do a chart review using their own analysis process. This letter is not a call for a specific action to buy, sell or short any of the stocks provided. There are NO sure things or guaranteed returns on the daily selection of "Diamonds in the Rough."
Helpful DecisionPoint Links:
DecisionPoint Shared ChartList and DecisionPoint Chart Gallery
Price Momentum Oscillator (PMO)
Swenlin Trading Oscillators (STO-B and STO-V)
For more links, go to DecisionPoint.com