
I always enjoy Reader Request Day as I get to see what symbols are on your watch lists. The request list was somewhat extensive today, but I believe I found a few gems and certainly some educational opportunities.
You know how I feel about "falling knives" type investments. They don't suit my trading style or analysis process as I'm a momentum trader. However, I felt that this request merited discussion, not because I'm in favor of the investment, but about why I am not a buyer here.
Coal did well today and one of today's requests was a coal company. I love the chart. I didn't get into ARCH today so this may be on my watchlist going into tomorrow and early next week. At the moment, I'm paring down some of my exposure, and actually have been. A few of you noted that my exposure level hasn't changed from 70% in awhile. That is true as I've been rotating into Energy and Materials by adding to current positions when others are closed.
I don't like what's going on in the market, but we did see a downside exhaustion climax today. I don't think the selling is over as we haven't seen any real capitulation by market participants. Just be careful about your exposure, particularly in the more aggressive areas of the market like Technology and Consumer Discretionary.
An ETF that is on my radar going into next week is Palladium (PALL). I've been stalking this chart for a few weeks now and it is finally looking like it might reverse off long-term support. I'll present the chart to you in tomorrow's Diamond Mine trading room (remind me if I forget!).
Today's "Diamonds in the Rough" are: FANG, HAIN, HCC, KRE and LSPD.
"Short List" (no order): PBFX, TDC, BAC, HNRG, MVO, AX, UBSI and OSUR.

RECORDING LINK Friday (9/24):
Topic: DecisionPoint Diamond Mine (9/24/2021) LIVE Trading Room
Start Time : Sep 24, 2021 09:00 AM
Meeting Recording LINK.
Access Passcode: Sept-24th
REGISTRATION FOR FRIDAY 10/1 Diamond Mine:
When: Oct 1, 2021 09:00 AM Pacific Time (US and Canada)
Topic: DecisionPoint Diamond Mine (10/1/2021) LIVE Trading Room
Register in advance for this webinar HERE.
Save the registration confirmation email with login instructions in case Zoom doesn't notify you in time.

Free DP Trading Room (9/20) RECORDING LINK:
Topic: DecisionPoint Trading Room
Start Time : Sep 20, 2021 09:00 AM
Meeting Recording LINK.
Access Passcode: Sept-20th
For best results, copy and paste the access code to avoid typos.
Welcome to DecisionPoint Daily Diamonds, wherein I highlight five "Diamonds in the Rough." These are selected from the results of my DecisionPoint scans, which search for stocks that could benefit from the trend and condition of the market. Remember, these are not recommendations to buy or sell, but are the most interesting of the stocks that surfaced in my scans. My objective is to save you the work of the initial, tedious culling process, but you need to apply your own analysis to see if these stocks pique your interest as well. There are no guaranteed winners here!
Diamondback Energy, Inc. (FANG)
EARNINGS: 11/1/2021 (AMC)
Diamondback Energy, Inc. is an independent oil and natural gas company, which engages in the acquisition, development, exploration and exploitation of unconventional, onshore oil and natural gas reserves. It operates through the Upstream and Midstream Services segments. The Upstream segment focuses on the Permian Basin operations in West Texas. The Midstream Services segment involves in the Midland and Delaware Basins. The company was founded in December 2007 and is headquartered in Midland, TX.
Predefined Scans Triggered: Elder Bar Turned Blue, P&F Ascending Triple Top Breakout, P&F Double Top Breakout.
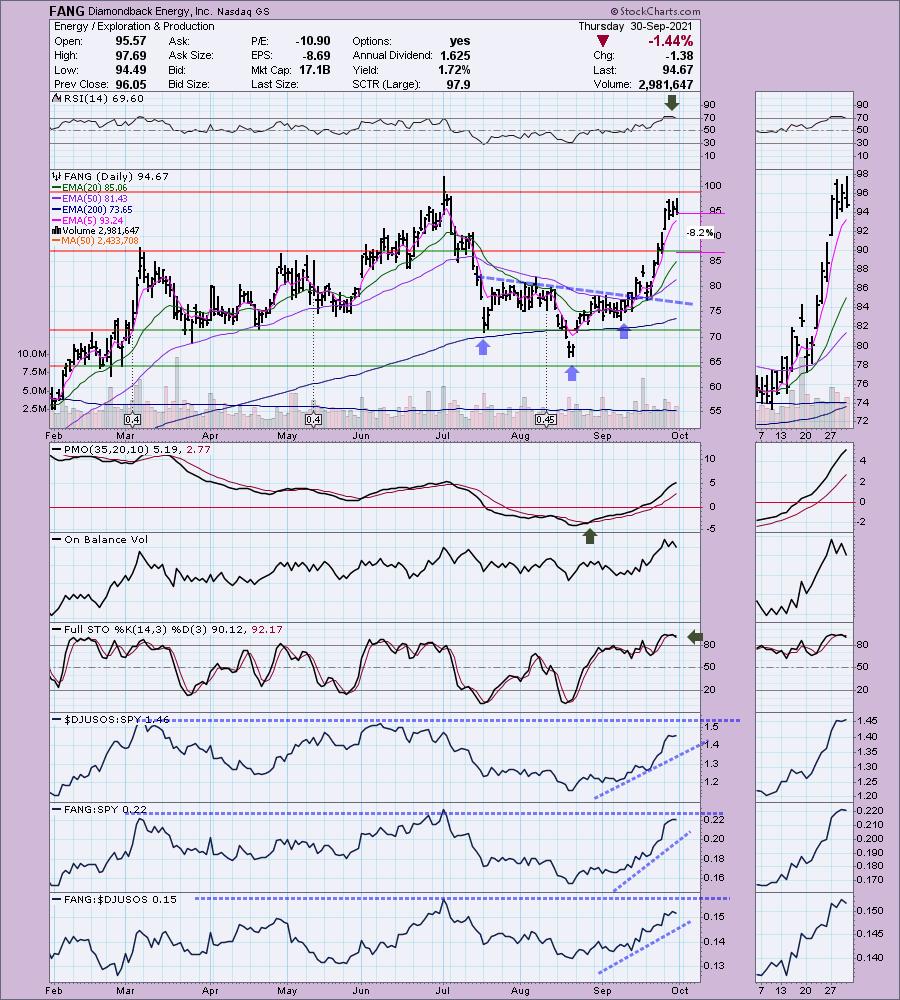
FANG is up +0.24% in after hours trading. I covered FANG on February 9th 2021. The stop was never triggered so the position is currently up 41.4%. I like the chart, but I do have a few reservations. We have what appears to be some consolidation after the strong rally which is good and could be considered a possible flag on a flagpole. I didn't annotate it because the "flag" is rising and those patterns tend to bust more than the down-sloping flags. The RSI is no longer overbought after today's pullback which is positive. The PMO is rising strongly. I'm not thrilled with Stochastics having a negative crossover in overbought territory, but given this is in a hot sector, there is a high likelihood it will stay overbought for some time. Relative strength is strong, but we are getting close to resistance. The stop is set below support at the March/April/May tops.
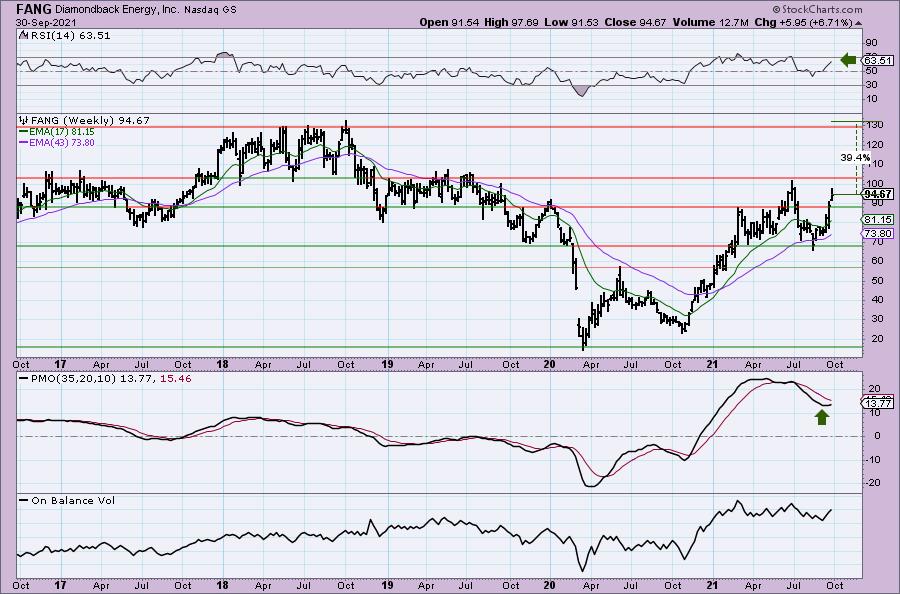
I like the weekly chart. The weekly PMO has turned up and the weekly RSI is positive. If it can break above strong overhead resistance, we can look for it to test 2018 highs.
Hain Celestial Group, Inc. (HAIN)
EARNINGS: 11/8/2021 (BMO)
The Hain Celestial Group, Inc. engages in the production and distribution of organic and natural products. Its brands include Alba Botanica, Avalon Organics, Earth's Best, JASON, Live Clean, Imagine, and Queen Helene. The company was founded by Irwin David Simon on May 19, 1993 and is headquartered in Lake Success, NY.
Predefined Scans Triggered: P&F Double Top Breakout.
HAIN is unchanged in after hours trading. I've covered HAIN twice before: April 1st 2020 and July 27th 2020. The first position is still open and up +64.2% and the second position was stopped out.
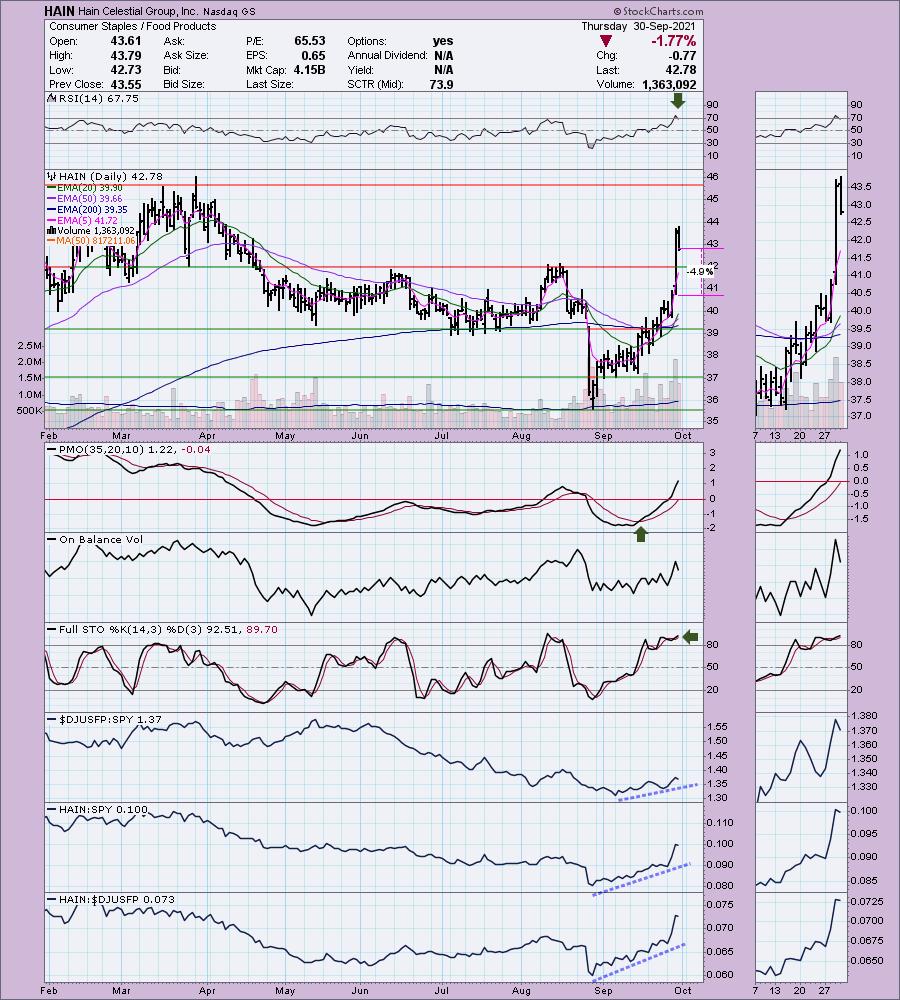
HAIN popped yesterday and pulled back toward the breakout point today. That brought the RSI out of overbought territory but did zero damage to the PMO. Additionally, this triggered an IT Trend Model "Silver Cross" BUY signal. Stochastics are overbought but still rising. Relative strength is excellent. Given the weakness in the market overall, I would consider using tighter stops. I think you could tighten this stop even more. If it can't stay above new support, I wouldn't want it.
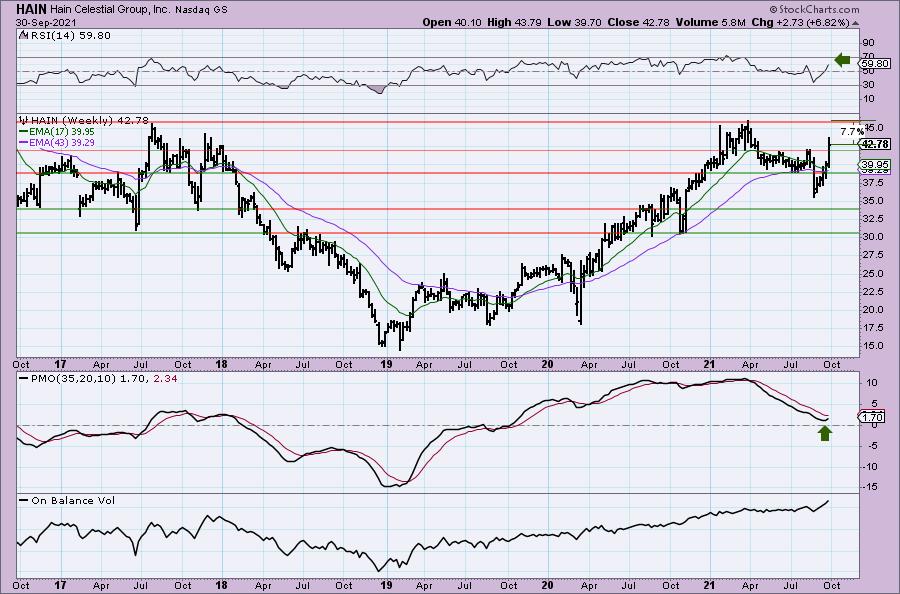
However, looking at the weekly chart, I think this one could do very well moving forward. The weekly RSI is positive and not overbought and the weekly PMO has just turned up. If this one is going to run, we will see new all-time highs and a move larger than 7.7%.
Warrior Met Coal Inc. (HCC)
EARNINGS: 10/27/2021 (AMC)
Warrior Met Coal, Inc engages in the production and export of metallurgical coal. The firm extracts methane gas from the Blue Creek coal seam. It also sells natural gas, which is extracted as a by-product from coal production. The company was founded on September 3, 2015 and is headquartered in Brookwood, AL.
Predefined Scans Triggered: Filled Black Candles and Parabolic SAR Buy Signals.
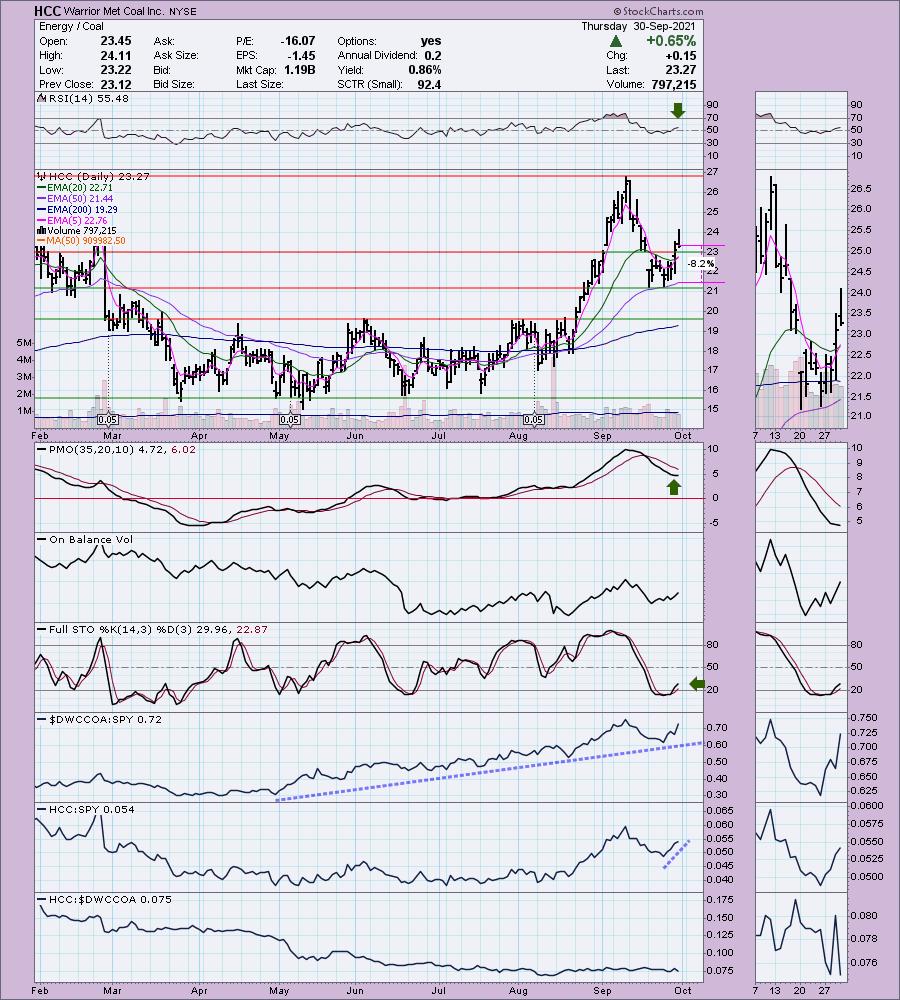
HCC is up +0.99% in after hours trading. Thank you, Fred for bringing this one to the table. As I mentioned yesterday, I am interested in a position in coal. This is a great looking chart. The RSI is positive and the PMO although falling, is decelerating nicely. Stochastics are just turning up. The pullback and subsequent bounce off the 50-EMA and the closure of the gap down is positive. I do see a small double-bottom pattern, but that has already seen the minimum upside target reached. Relative strength is good. It is performing in line with its group and that is just fine given coal's outperformance of late. The stop is set at the 50-EMA.
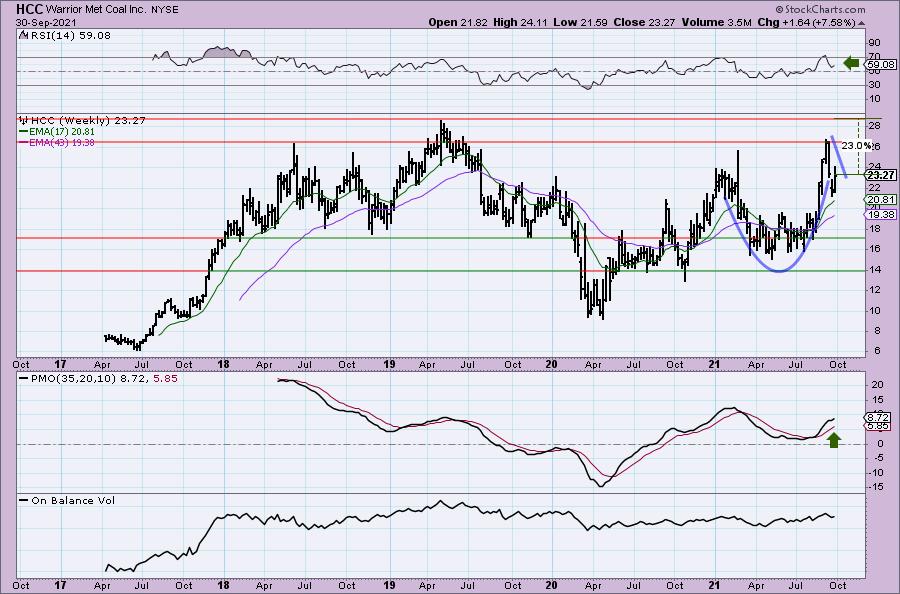
We have a large cup and handle-ish pattern. It isn't textbook as we want the second top to be below the first. The indicators are very favorable with the positive RSI and weekly PMO bottom above the signal line. Upside potential is 23% which seems easily reachable.
SPDR S&P Regional Banking ETF (KRE)
EARNINGS: N/A
KRE tracks an equal-weighted index of US regional banking stocks.

Predefined Scans Triggered: Elder Bar Turned Blue, Bearish Engulfing, Stocks in a New Uptrend (ADX), P&F Double Top Breakout and P&F Triple Top Breakout.
KRE is down -0.24% in after hours trading. I've covered KRE twice before on April 30th 2020 and August 11th 2020. I didn't set a stop on the first position, but it had a short-term decline shortly after I printed it so I'm sure any stop I would've set would have been triggered. The second position was also stopped out.
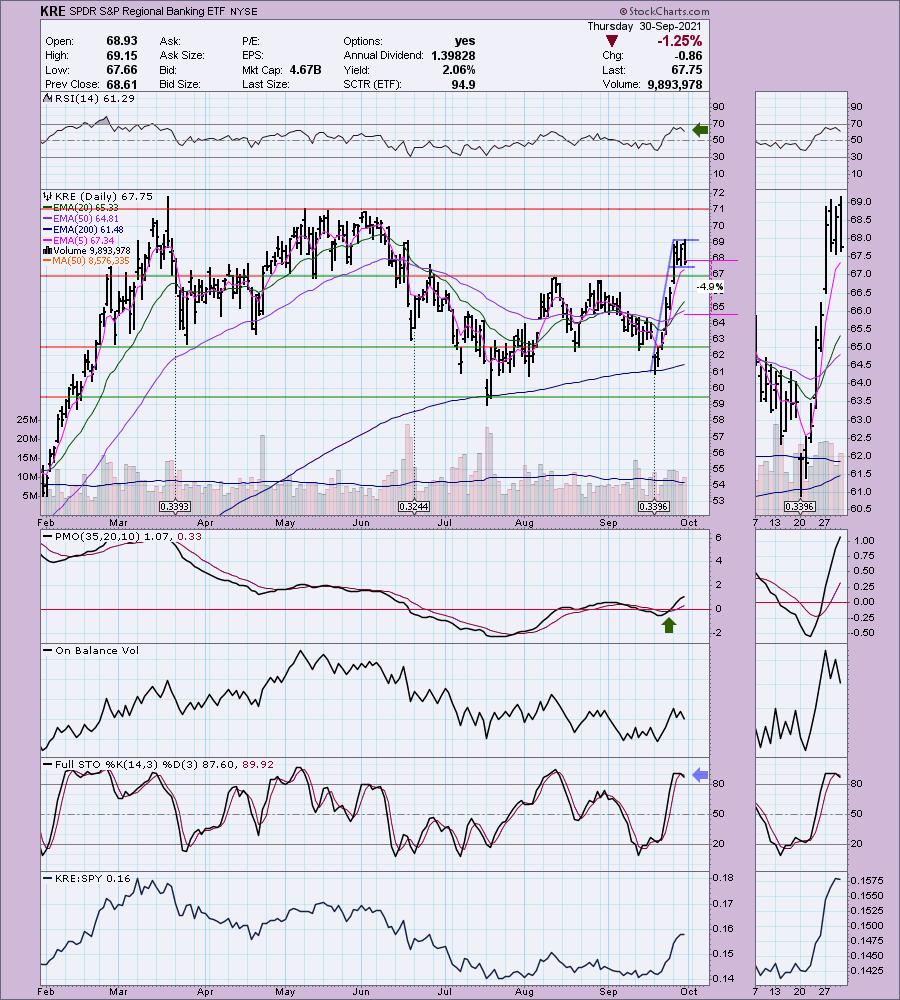
I'm not thrilled with this chart, but I don't hate it either. I like the positive RSI and the bullish flag formation. The PMO rising and buy signal also are good. Why don't I like it? Well I don't like the shape of the Stochastics topping in overbought territory. I like that you can set a tight stop either just under support or at the 50-EMA.
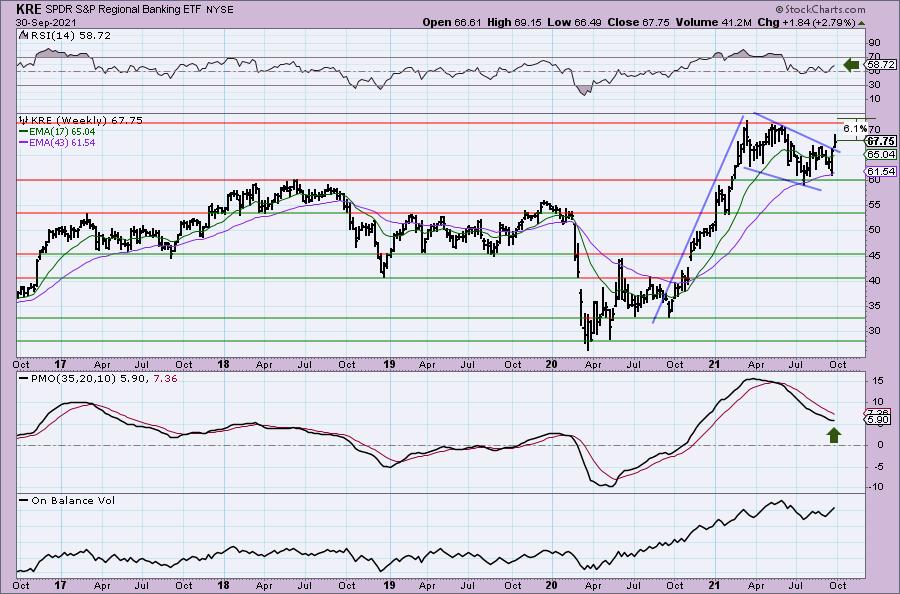
I like the weekly chart. The weekly PMO is turning up and the weekly RSI is positive. There is a large flag formation that is in the process of executing as price breaks above the declining tops trendline. If the flag is correct, we will see new all-time highs that could continue.
Lightspeed POS, Inc. (LSPD)
EARNINGS: None Listed.
Lightspeed Commerce, Inc. provides point-of-sale software for retailers and restaurants. It offers workflow analysis, training, configuration, networking and business services. The company was founded by Dax Dasilva on March 21, 2005 and is headquartered in Montreal, Canada.
Predefined Scans Triggered: P&F Triple Bottom Breakdown, P&F Double Bottom Breakout, P&F Long Tail Down and Declining Chaikin Money Flow.
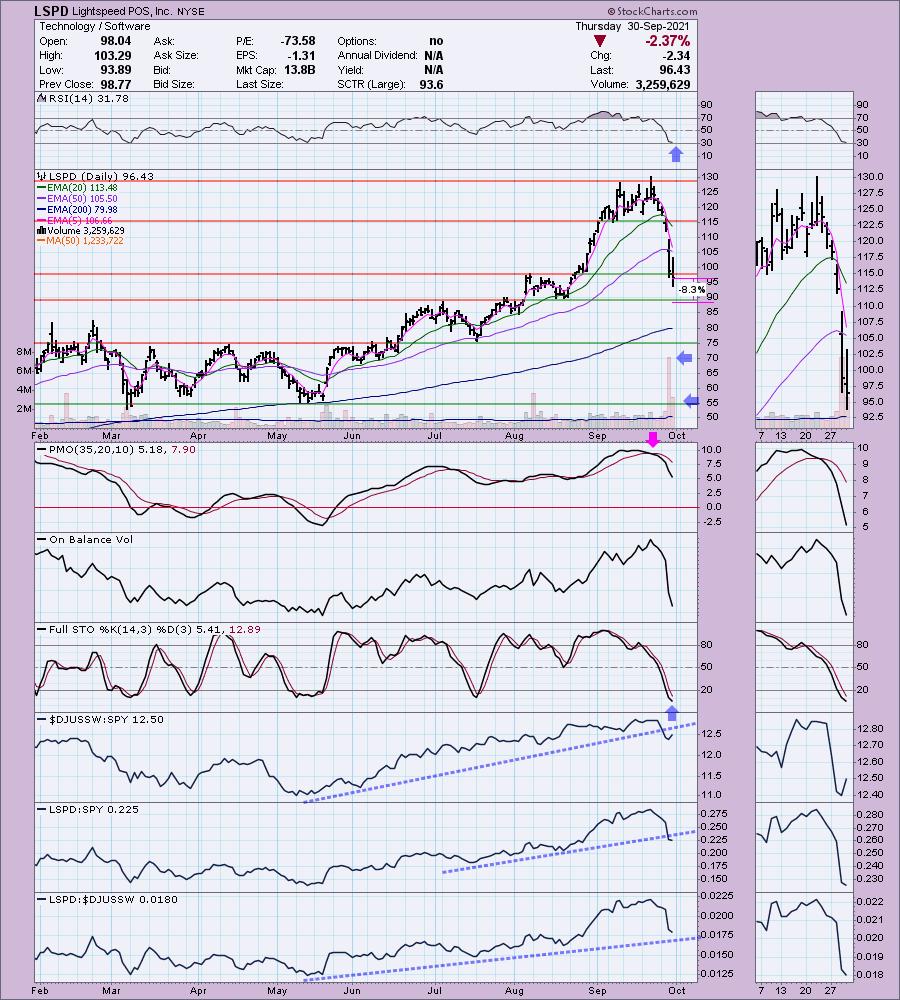
LSPD is up +0.05% in after hours trading. Here is our "falling knife". Heather, I know you are one of my less risk averse subscribers out there so it wasn't a complete surprise to see this request from you. I will say that it definitely has merit. My problem is we aren't seeing any improvement yet. Today, it broke below support and is headed toward the next support level after dropping past the 50-EMA. This level could be a reversal point. The RSI is oversold and Stochastics are beginning to decelerate. Unfortunately the PMO is not and we're seeing a ton of distribution so be careful. If you want to put your hand out, I wouldn't let it go past that 8.3% stop. It could very likely test the 200-EMA before reversing.
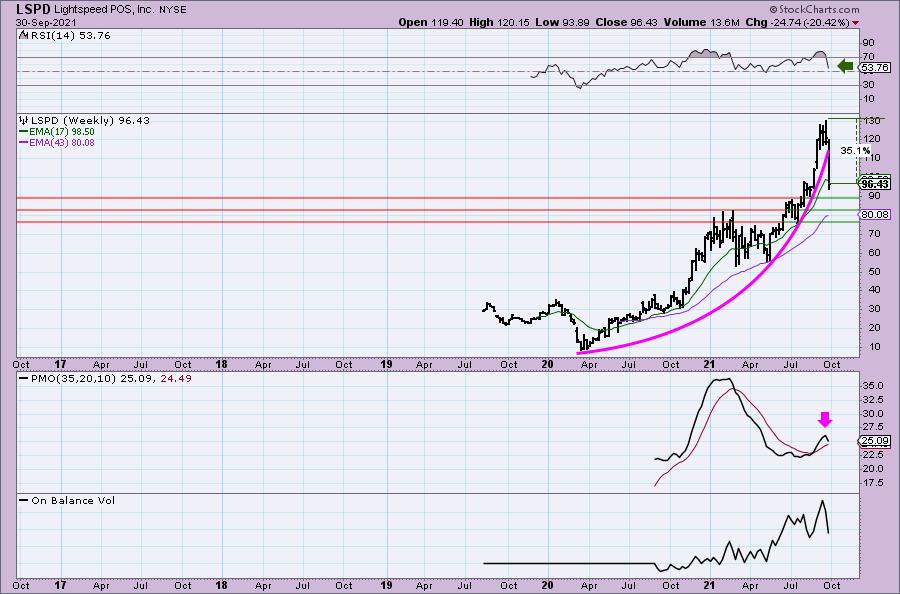
The weekly chart suggests LSPD is in the midst of a breakdown from a parabolic price rise. These generally breakdown quickly and find support at the basing pattern. In this case, I think the bottom of the support zone I've annotated would suffice. If it can make a turnaround here, there is a lot of upside potential.
Don't forget, on Thursdays I look at reader-requested symbols, so shoot me an email at erin@decisionpoint.com. I read every email I receive and try to answer them all!
Current Market Outlook:
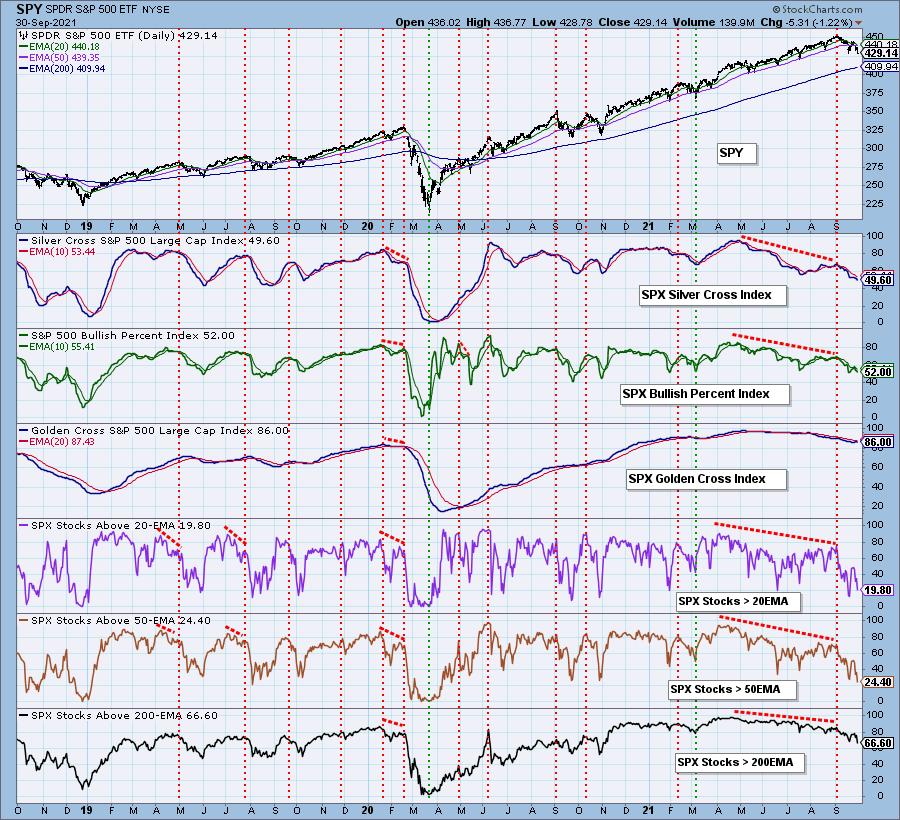
Market Environment: It is important to consider the odds for success by assessing the market tides. The following chart uses different methodologies for objectively showing the depth and trend of participation for intermediate- and long-term time frames.
- The Silver Cross Index (SCI) shows the percentage of SPX stocks on IT Trend Model BUY signals (20-EMA > 50-EMA)
- The Golden Cross Index (GCI) shows the percentage of SPX stocks on LT Trend Model BUY signals (50-EMA > 200-EMA)
- The Bullish Percent Index (BPI) shows the percentage of SPX stocks on Point & Figure BUY signals.
Don't forget that as a "Diamonds" member, you have access to our GCI/SCI curated ChartList on DecisionPoint.com. You'll find it under "Members Only" links on the left side on the Blogs and Links Page.
Here is the current chart:
Full Disclosure: I'm about 70% invested and 30% is in 'cash', meaning in money markets and readily available to trade with. I haven't gotten Coal yet, but am looking at ARCH and HCC for an add.
I'm required to disclose if I currently own a stock and if I may buy it within the next 72 hours.
Technical Analysis is a windsock, not a crystal ball.
Happy Charting!
- Erin
erin@decisionpoint.com
Watch the latest episode of DecisionPoint with Carl & Erin Swenlin on Mondays 7:00p EST or on the DecisionPoint playlist on the StockCharts TV YouTube channel here!
NOTE: The stocks reported herein are from mechanical trading model scans that are based upon moving average relationships, momentum and volume. DecisionPoint analysis is then applied to get five selections from the scans. The selections given should prompt readers to do a chart review using their own analysis process. This letter is not a call for a specific action to buy, sell or short any of the stocks provided. There are NO sure things or guaranteed returns on the daily selection of "Diamonds in the Rough."
Helpful DecisionPoint Links:
DecisionPoint Shared ChartList and DecisionPoint Chart Gallery
Price Momentum Oscillator (PMO)
Swenlin Trading Oscillators (STO-B and STO-V)
For more links, go to DecisionPoint.com