
I have quite a mix of stocks for you to look at. As noted in the title I have a Energy stock that is firing up again and like Natural Gas, we should see much higher prices moving into the fall and winter months. I have a Financial stock that was actually in a group I didn't care for on Friday, but then rising water floats all boats and that sector is still strong. The Industrial stock has an excellent set-up and based on the RRG sector chart, XLI is gaining relative strength.
Finally I have a Biotech for you. It is a new one that doesn't have that much data on it, but the data we have looks very bullish. It's volatile and not for the faint of heart, but I know I have some short-term risk takers out there, so this one's for you.
Natural Gas (UNG) pulled back sharply today and I was thrilled! I added BOIL at a discount based on the decline. I'm still very bullish on Nat Gas and am curious to see how far it will run.
Today's "Diamonds in the Rough" are: ARCH, ARGO, LYEL and UFPI.
"Short List" (no order): EA, ATVI, AIG, GEF, APTS, IDA, VGR and CBU.

RECORDING LINK Friday (9/24):
Topic: DecisionPoint Diamond Mine (9/24/2021) LIVE Trading Room
Start Time : Sep 24, 2021 09:00 AM
Meeting Recording LINK.
Access Passcode: Sept-24th
REGISTRATION FOR FRIDAY 10/1 Diamond Mine:
When: Oct 1, 2021 09:00 AM Pacific Time (US and Canada)
Topic: DecisionPoint Diamond Mine (10/1/2021) LIVE Trading Room
Register in advance for this webinar HERE.
Save the registration confirmation email with login instructions in case Zoom doesn't notify you in time.

Free DP Trading Room (9/20) RECORDING LINK:
Topic: DecisionPoint Trading Room
Start Time : Sep 20, 2021 09:00 AM
Meeting Recording LINK.
Access Passcode: Sept-20th
For best results, copy and paste the access code to avoid typos.
Welcome to DecisionPoint Daily Diamonds, wherein I highlight five "Diamonds in the Rough." These are selected from the results of my DecisionPoint scans, which search for stocks that could benefit from the trend and condition of the market. Remember, these are not recommendations to buy or sell, but are the most interesting of the stocks that surfaced in my scans. My objective is to save you the work of the initial, tedious culling process, but you need to apply your own analysis to see if these stocks pique your interest as well. There are no guaranteed winners here!
Arch Coal, Inc. (ARCH)
EARNINGS: 10/21/2021 (BMO)
Arch Resources, Inc. engages in the production and distribution of thermal coal. It operates through the following segments: Powder River Basin, Metallurgical and Other Thermal. The Powder River Basin segment contains thermal operations in Wyoming. The Metallurgical segment contains metallurgical operations in West Virginia. The Other Thermal segment contains supplementary thermal operations in Colorado, Illinois and the Coal Mac thermal operations in West Virginia. The company was founded in 1969 and is headquartered in St. Louis, MO.
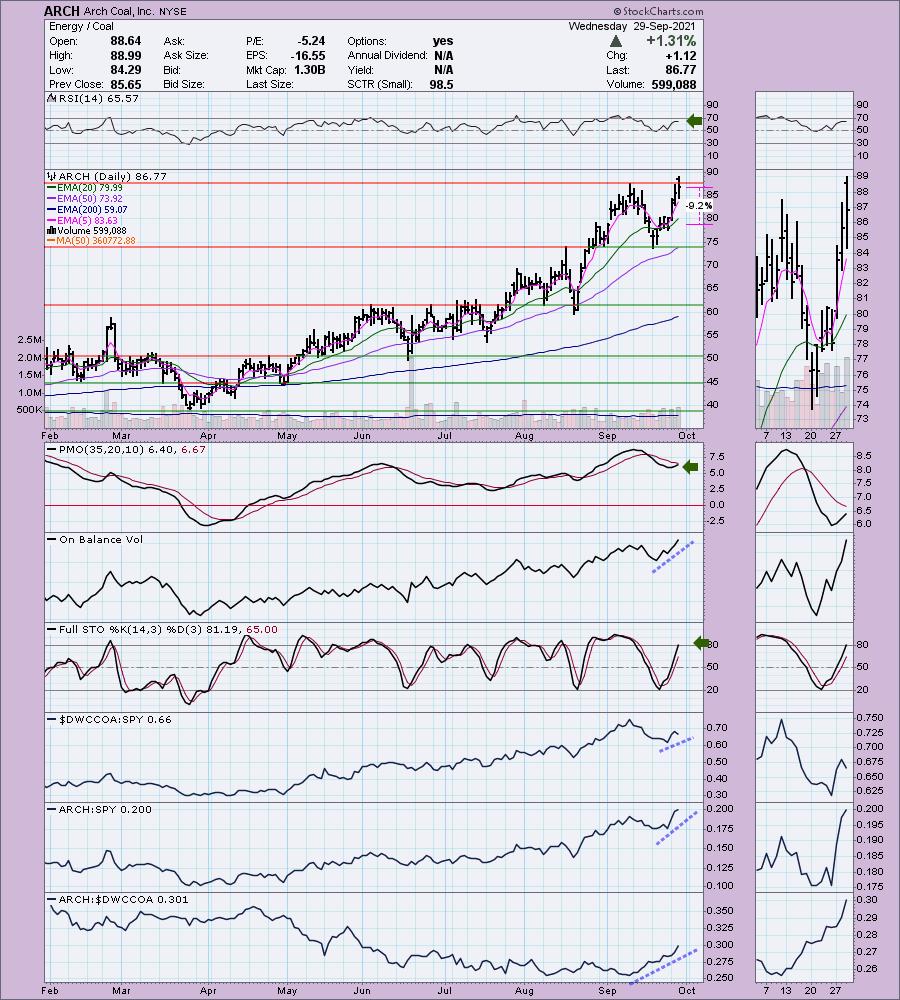
Predefined Scans Triggered: New 52-week Highs, Filled Black Candles, P&F Double Top Breakout.
ARCH is up +3.42% in after hours trading so we know the breakout will likely continue tomorrow. I picked METC last week in the coal industry and today I'm presenting another small-cap coal company. This one has already had a sizable rally, but given the bullish indicators I suspect it will continue higher. The PMO is nearing a crossover BUY signal and the RSI is positive. Stochastics are entering overbought territory, but are still rising strongly. The OBV is confirming the rally and relative strength has been strong for ARCH. The industry group is beginning to outperform again and this one is a leader. The stop is set well below the 20-EMA to accommodate any pullbacks.
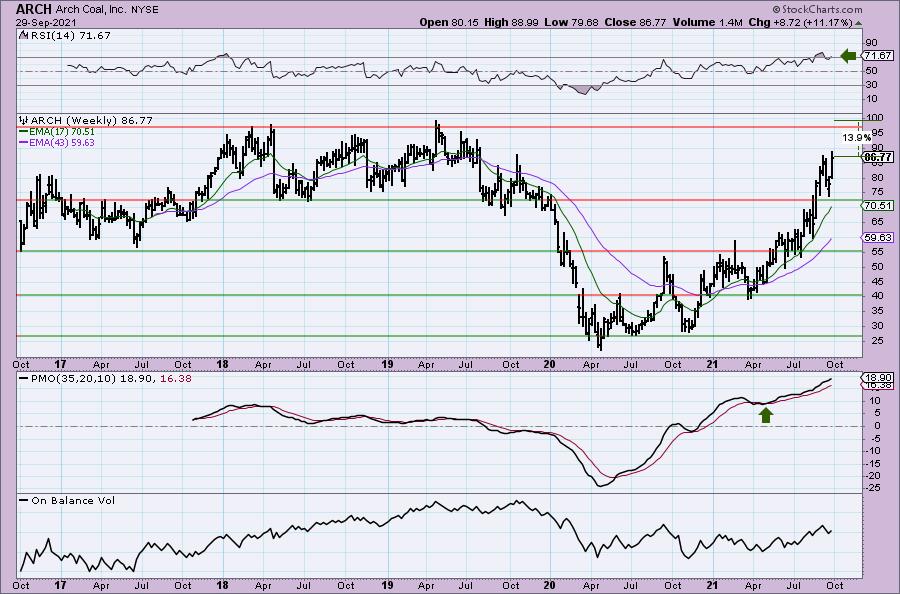
The weekly chart is strong with the only negative being a slightly overbought RSI. I would look for coal to challenge the 2018/2019 price highs, with a high probability that it will breakout to give us a more than 14% gain.
Argo Group Intl Holdings, Ltd. (ARGO)
EARNINGS: 11/1/2021 (AMC)
Argo Group International Holdings Ltd. engages in the provision of underwriting property and casualty insurance and reinsurance products. It operates through the following segments: U.S. Operations, International Operations, and Run-off Lines. The U.S. Operations segment include distribution through retail, wholesale, and managing general brokers/agents in the specialty insurance market. The International Operations segment involves in the insurance risks through the broker market, focusing on specialty property insurance, property catastrophe reinsurance, primary/excess casualty, professional liability and marine, and energy insurance. The Run-off Lines segment comprises liabilities associated with discontinued lines previously underwritten by the insurance subsidiaries. The company was founded in 1957 and is headquartered in Pembroke, Bermuda.
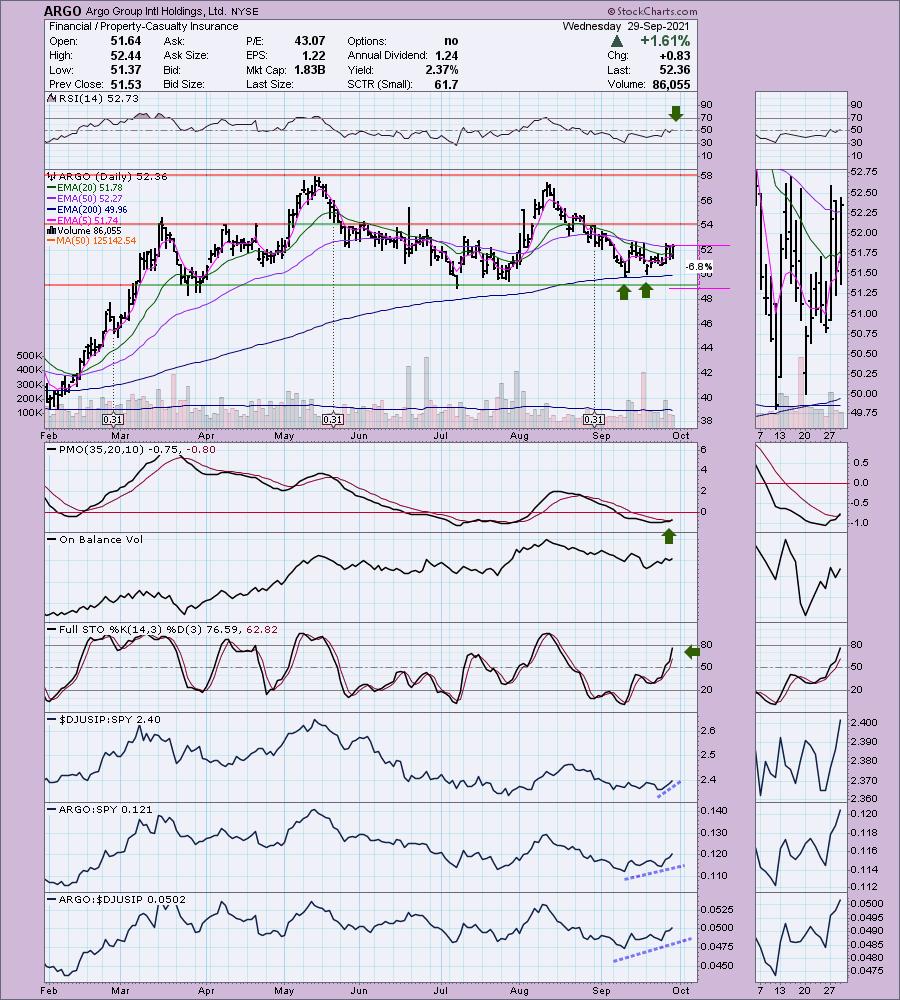
Predefined Scans Triggered: P&F High Pole.
ARGO is unchanged in after hours trading. I wasn't thrilled with the insurance industry groups last Friday, but I like the setup on this chart. First, I will point out that this one has been a sideways mover most of the year. That's okay given it is bouncing off the bottom of the range. The RSI just moved above net neutral (50) and the PMO had a crossover BUY signal trigger today. Stochastics are rising and aren't yet overbought. Relative strength looks good.
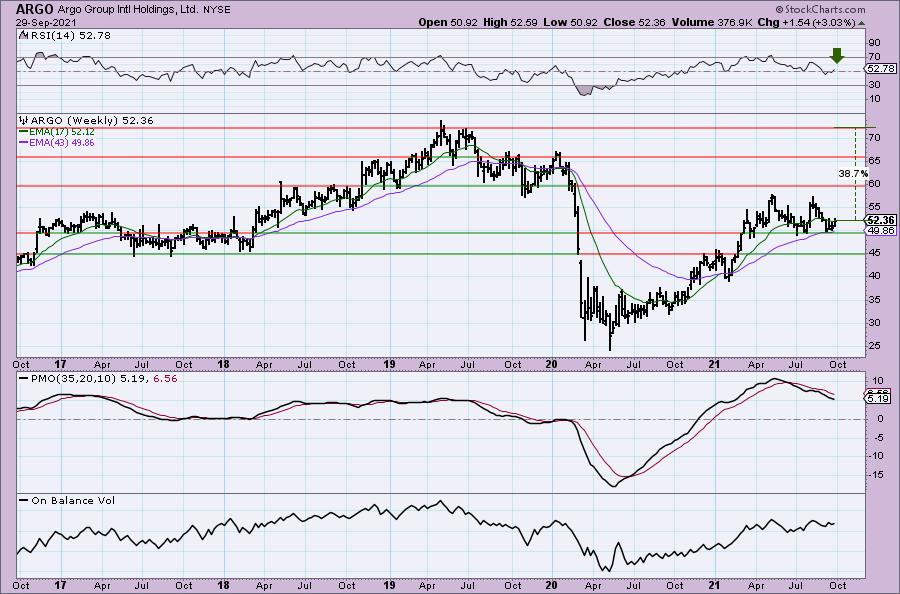
The weekly chart is somewhat mixed, but it does show us that this trading range could be broken from. I didn't annotate it, but this does look a lot like a cup and handle bullish chart pattern. The weekly PMO is still declining which I don't like.
Lyell Immunopharma Inc. (LYEL)
EARNINGS: 10/28/2021 (AMC)
Lyell Immunopharma, Inc. operates as a holding company, which engages in the development of cell-based immunotherapies for human diseases. The company was founded by Richard D. Klausner, Stan Riddell, and Crystal Mackall in June 2018 and is headquartered in South San Francisco, CA.
Predefined Scans Triggered: Bullish MACD Crossovers and P&F Low Pole.
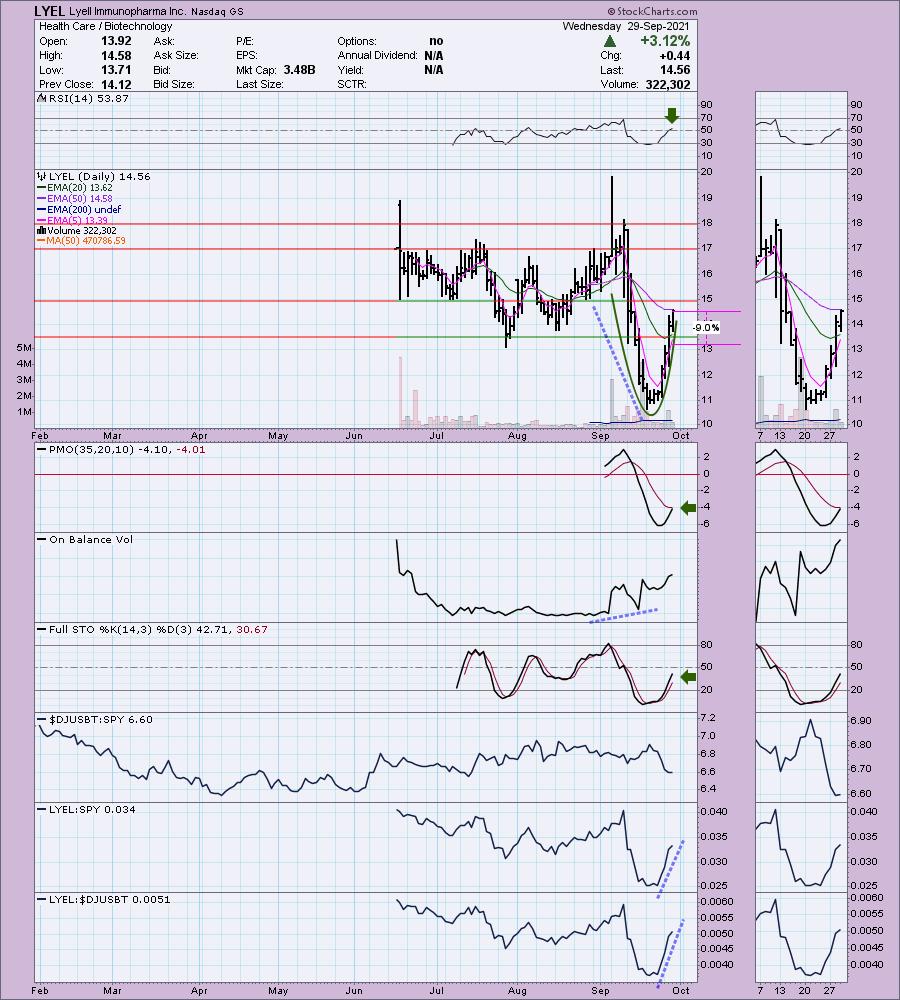
LYEL is down -0.07% in after hours trading. This isn't generally my kind of trade (volatile biotech, lower priced and little data). However, this "V" bottom looks great and the indicators are very positive based on the data available. The RSI just hit positive territory, the PMO is nearing a positive crossover and the Stochastics are very bullish. We even have a positive OBV divergence. The stop is deep mainly because this one is volatile and will likely require an iron stomach. While Biotechs have been floundering, LYEL is outperforming both the group and most importantly, the SPY.
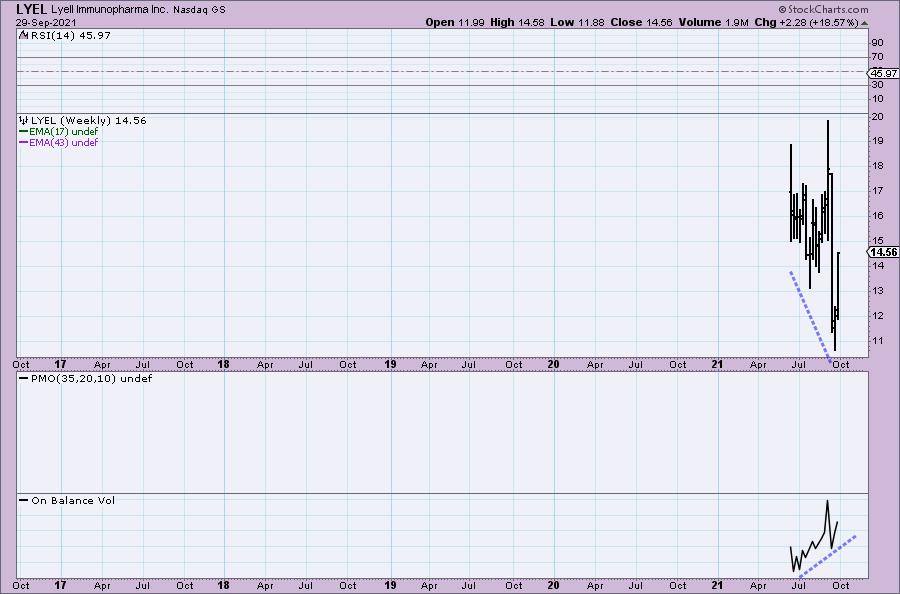
The weekly chart is bare, but we can see the very positive OBV divergence in the longer-term.
UFP Industries (UFPI)
EARNINGS: 10/20/2021 (AMC)
UFP Industries, Inc. manufactures and distributes wood and wood alternative products. It operates through the following segments: Retail, Industrial and Construction. The Retail segment comprises national home center retailers, retail-oriented regional lumberyards and contractor-oriented lumberyards. The Industrial segment manufacturers pallets, specialty crates, wooden boxes, and other containers used for packaging, shipping and material handling purposes. The Construction segment engages in factory-built housing, site-built residential construction, concrete forming, and commercial construction, which represent the business units. The company was founded in 1955 and is headquartered in Grand Rapids, MI.
Predefined Scans Triggered: Elder Bar Turned Green, Bullish MACD Crossovers, Parabolic SAR Buy Signals and P&F Double Bottom Breakout.
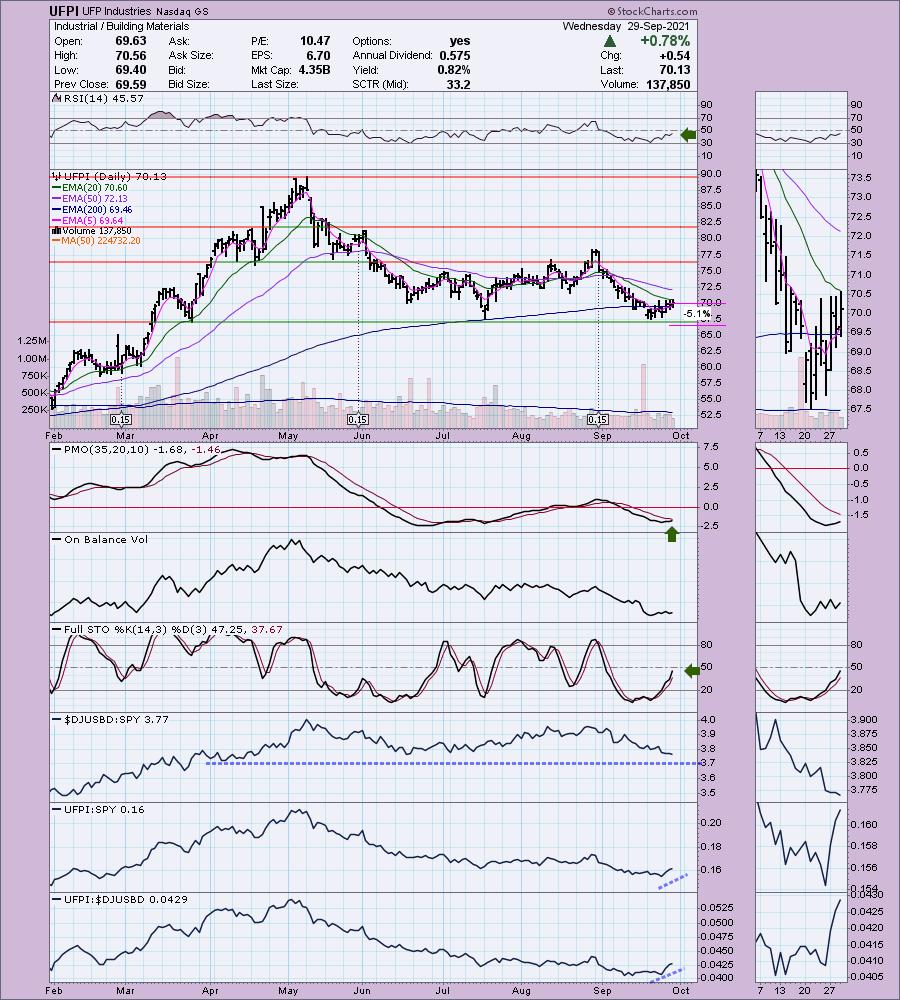
UFPI is unchanged in after hours trading. This one has been in a trading range since June. Price is now bouncing off the bottom of the range. It is also bouncing off the 200-EMA. The PMO is headed for a crossover BUY signal. The RSI is negative, but is also headed higher. Stochastics are rising strongly and are far from being overbought. Relative strength for the group is in decline, but it is nearing its own level of support. UFPI is performing well within its group as well as against the SPY. The stop can be set tightly at 5%.
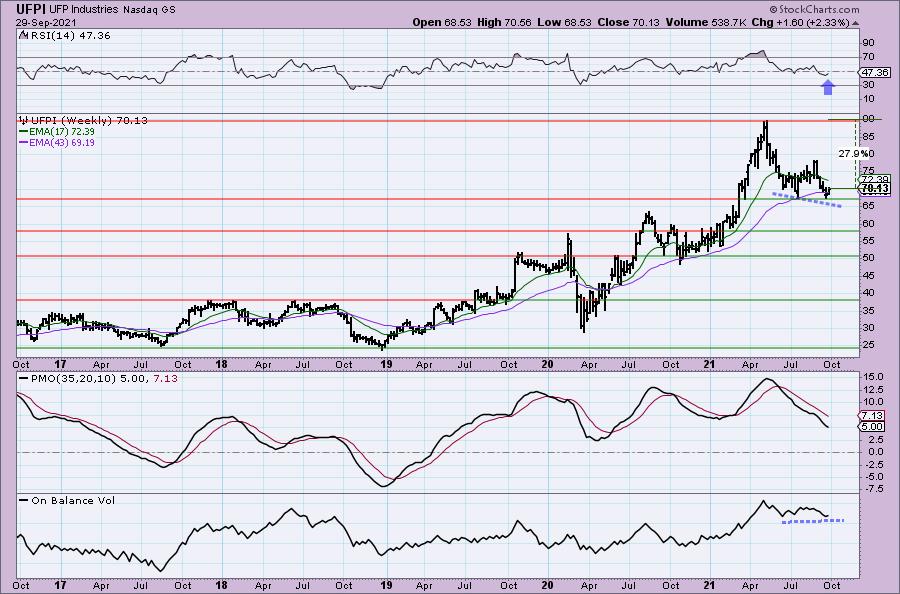
The weekly chart shows a positive OBV divergence and a rising RSI. The PMO appears to be decelerating somewhat. It is reaching near-term oversold territory. If it can get to this year's all-time high, that would be an over 27% gain.
Don't forget, on Thursdays I look at reader-requested symbols, so shoot me an email at erin@decisionpoint.com. I read every email I receive and try to answer them all!
Current Market Outlook:
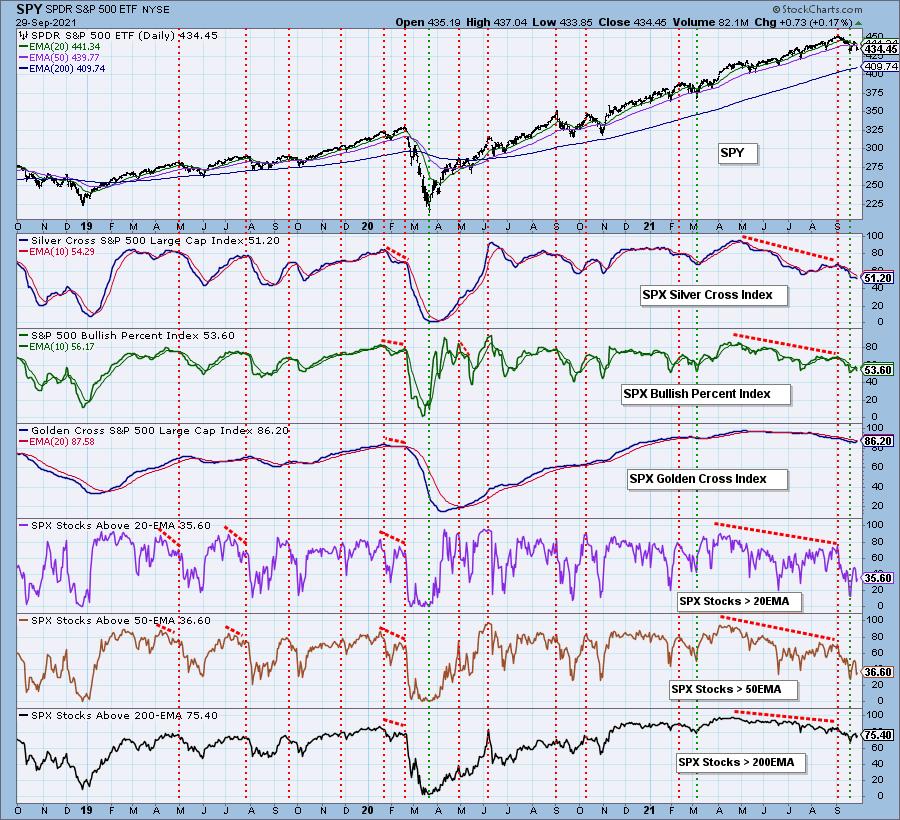
Market Environment: It is important to consider the odds for success by assessing the market tides. The following chart uses different methodologies for objectively showing the depth and trend of participation for intermediate- and long-term time frames.
- The Silver Cross Index (SCI) shows the percentage of SPX stocks on IT Trend Model BUY signals (20-EMA > 50-EMA)
- The Golden Cross Index (GCI) shows the percentage of SPX stocks on LT Trend Model BUY signals (50-EMA > 200-EMA)
- The Bullish Percent Index (BPI) shows the percentage of SPX stocks on Point & Figure BUY signals.
Don't forget that as a "Diamonds" member, you have access to our GCI/SCI curated ChartList on DecisionPoint.com. You'll find it under "Members Only" links on the left side on the Blogs and Links Page.
Here is the current chart:
Full Disclosure: I'm about 70% invested and 30% is in 'cash', meaning in money markets and readily available to trade with. I had a few positions stop out, but I added BOIL to my portfolio. I'm considering adding a position in coal with either METC or ARCH.
I'm required to disclose if I currently own a stock and if I may buy it within the next 72 hours.
Technical Analysis is a windsock, not a crystal ball.
Happy Charting!
- Erin
erin@decisionpoint.com
Watch the latest episode of DecisionPoint with Carl & Erin Swenlin on Mondays 7:00p EST or on the DecisionPoint playlist on the StockCharts TV YouTube channel here!
NOTE: The stocks reported herein are from mechanical trading model scans that are based upon moving average relationships, momentum and volume. DecisionPoint analysis is then applied to get five selections from the scans. The selections given should prompt readers to do a chart review using their own analysis process. This letter is not a call for a specific action to buy, sell or short any of the stocks provided. There are NO sure things or guaranteed returns on the daily selection of "Diamonds in the Rough."
Helpful DecisionPoint Links:
DecisionPoint Shared ChartList and DecisionPoint Chart Gallery
Price Momentum Oscillator (PMO)
Swenlin Trading Oscillators (STO-B and STO-V)
For more links, go to DecisionPoint.com