
Scan results were not plentiful today which tells me the market may see some more downside this week. When results are scant, it tells me not to open new positions in the short term and to watch my short-term trades more carefully than usual.
I have two breakout charts for you today. High volume moves that took out overhead resistance are generally going to see follow-through so these charts jumped out at me immediately.
The third is a possible purchase on an upside reversal off the all-important 50-EMA. I know many of you like to find stocks that are nearing possible reversal points off key moving averages so this one will certainly be of interest to you. The nice thing about this reversal is that the indicators are already beginning to confirm the bounce on this stock.
Today's "Diamonds in the Rough" are: BL, PYPL and TROX.
"Stocks to Review" from my short list are: CPNG, LYFT, GD, SI, TSCO and ZION.

RECORDING LINK Friday (9/3):
Topic: DecisionPoint Diamond Mine (09/03/2021) LIVE Trading Room
Start Time : Sep 3, 2021 09:00 AM
Meeting Recording Link.
Access Passcode: Sept-3rd
REGISTRATION FOR FRIDAY 9/10 Diamond Mine:
When: Sep 10, 2021 09:00 AM Pacific Time (US and Canada)
Topic: DecisionPoint Diamond Mine (9/10/2021) LIVE Trading Room
Register in advance for this webinar HERE.
Save the registration confirmation email with login instructions in case Zoom doesn't notify you in time.


Julius de Kempenaer joined Erin in the free DP Trading Room this week! The recording link is below:
Free DP Trading Room (9/7) RECORDING LINK:
Topic: DecisionPoint Trading Room
Start Time : Sep 7, 2021 09:00 AM PT
Meeting Recording Link HERE.
Access Passcode: Sept@7th
For best results, copy and paste the access code to avoid typos.
Welcome to DecisionPoint Daily Diamonds, wherein I highlight five "Diamonds in the Rough." These are selected from the results of my DecisionPoint scans, which search for stocks that could benefit from the trend and condition of the market. Remember, these are not recommendations to buy or sell, but are the most interesting of the stocks that surfaced in my scans. My objective is to save you the work of the initial, tedious culling process, but you need to apply your own analysis to see if these stocks pique your interest as well. There are no guaranteed winners here!
BlackLine, Inc. (BL)
EARNINGS: 10/28/2021 (AMC)
BlackLine, Inc. operates a cloud-based software platform which is designed to transform accounting and finance operations for organizations of all types and sizes. Its scalable platform supports critical accounting processes such as the financial close, account reconciliations, intercompany accounting, and controls assurance. The company was founded by Therese Tucker in May 2001 and is headquartered in Woodland Hills, CA.
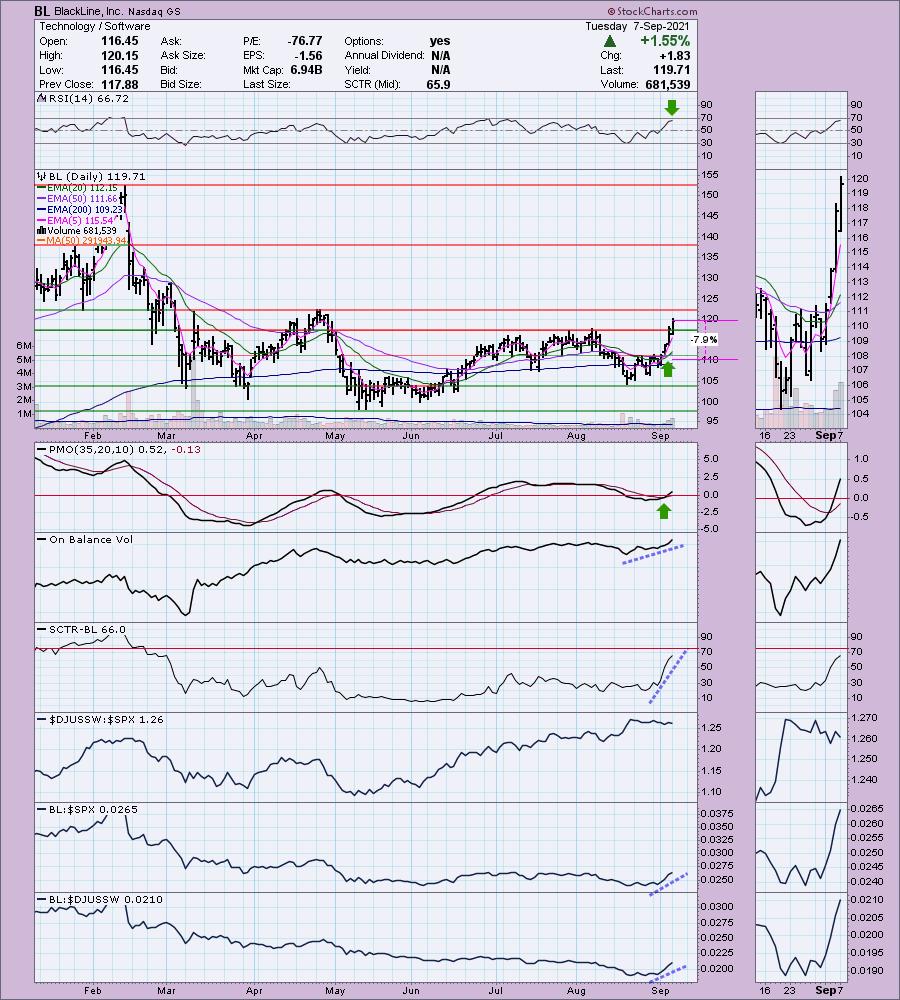
BL is currently unchanged in after hours trading. Today we have a breakout from short-term overhead resistance at the July/August highs. There is overhead resistance at the January low and April high, but the indicators suggest we will see that breakout too. The PMO had a crossover BUY signal last week and has now reached positive territory. The RSI is positive and not yet overbought. The OBV is confirming the rally and the SCTR has shot up toward the "hot zone" above 75 (meaning it is in the upper quartile of all mid-cap stocks in the IT and LT). The Software group is keeping up with the market, but BL is outperforming both right now. The stop is set below the late August tops, but you could stretch it down to the 200-EMA depending on your risk appetite.
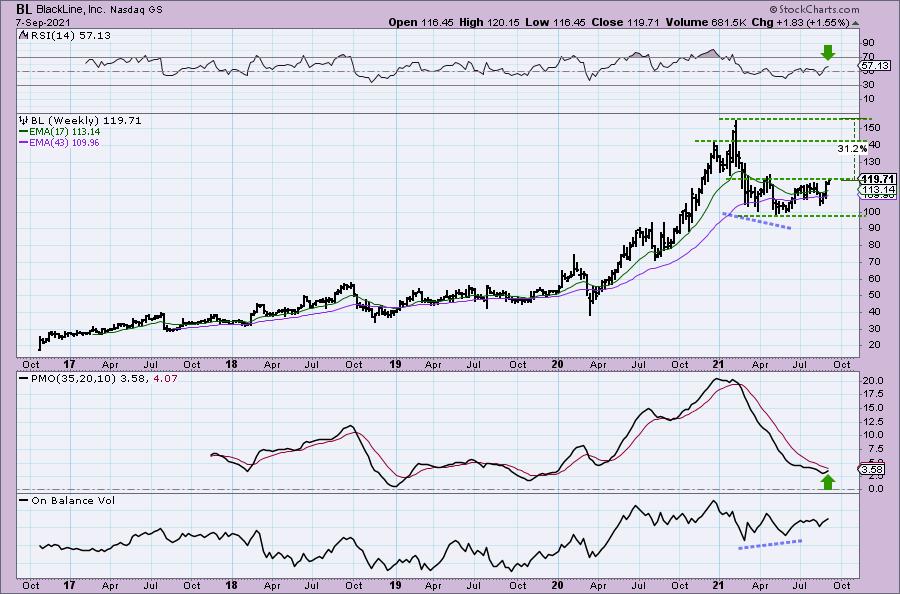
We can see that intermediate-term overhead resistance is only now being challenged so we could see a pullback that could bring price all the way back down to $100. However, the RSI is positive and rising and most importantly, the weekly PMO has turned up. You can see the positive OBV divergence that led into the previous rally. Currently the weekly OBV is confirming the current rally with rising bottoms.
PayPal Holdings, Inc. (PYPL)
EARNINGS: 11/1/2021 (AMC)
PayPal Holdings, Inc. engages in the development of technology platform for digital payments. Its solutions include PayPal, PayPal Credit, Braintree, Venmo, Xoom, and Paydiant products. The firm manages a two-sided proprietary global technology platform that links customers, which consist of both merchants and consumers, to facilitate the processing of payment transactions. It allows its customers to use their account for both purchase and paying for goods, as well as to transfer and withdraw funds. The firm also enables consumers to exchange funds with merchants using funding sources, which include bank account, PayPal account balance, PayPal Credit account, credit and debit card or other stored value products. It offers consumers person-to-person payment solutions through its PayPal Website and mobile application, Venmo and Xoom. The company was founded in December 1998 and is headquartered in San Jose, CA.
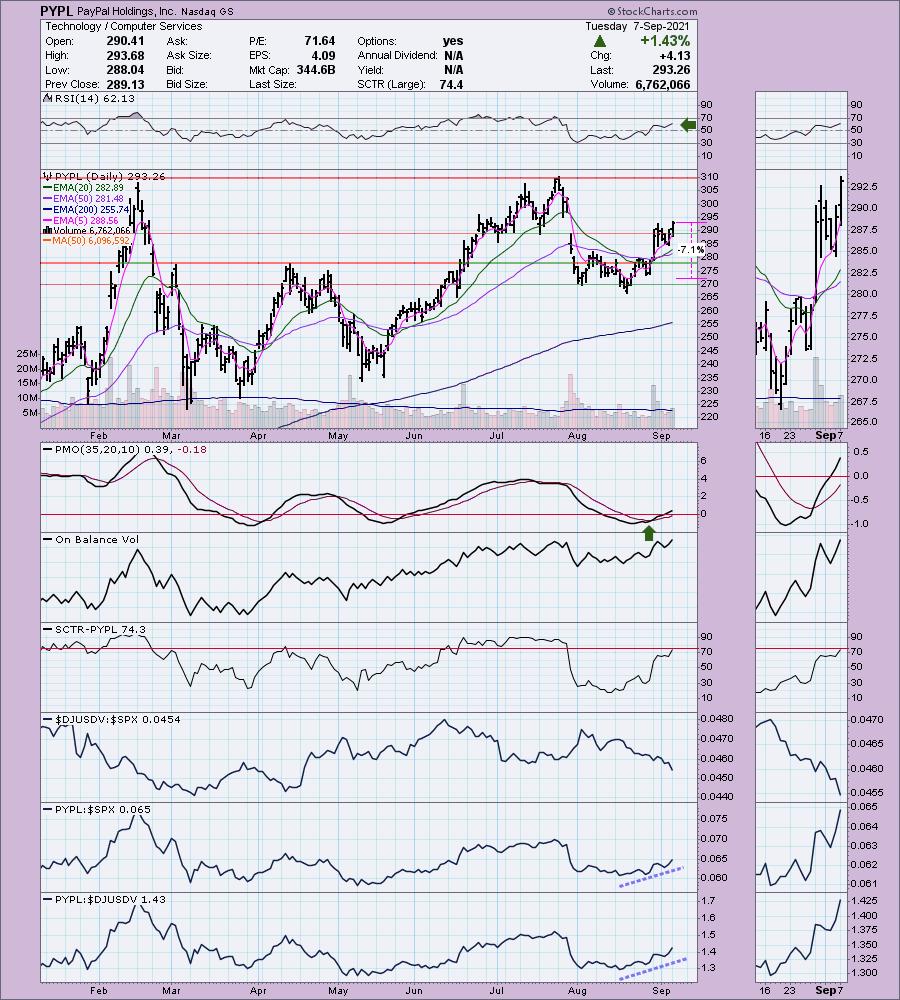
PYPL is down -0.09% in after hours trading. I've covered PYPL several times. The most recent was on April 27th 2021. Timing was poor so the 7.7% stop was hit in May. The second time I covered it was on January 14th 2021. The position was never stopped out so it is currently up +18.5%. I covered it on September 29th 2021. The stop wasn't hit so that position is up 47.5% as of today.
PYPL is down -0.09% in after hours trading. I like today's breakout from a short-term flag formation. Price is making its way upward to cover the July gap down. The RSI is positive and the PMO is on an oversold crossover BUY signal from late August. The industry group is languishing, but PYPL is still outperforming the SPX. The stop can be adjusted, but I set it below those late August lows.
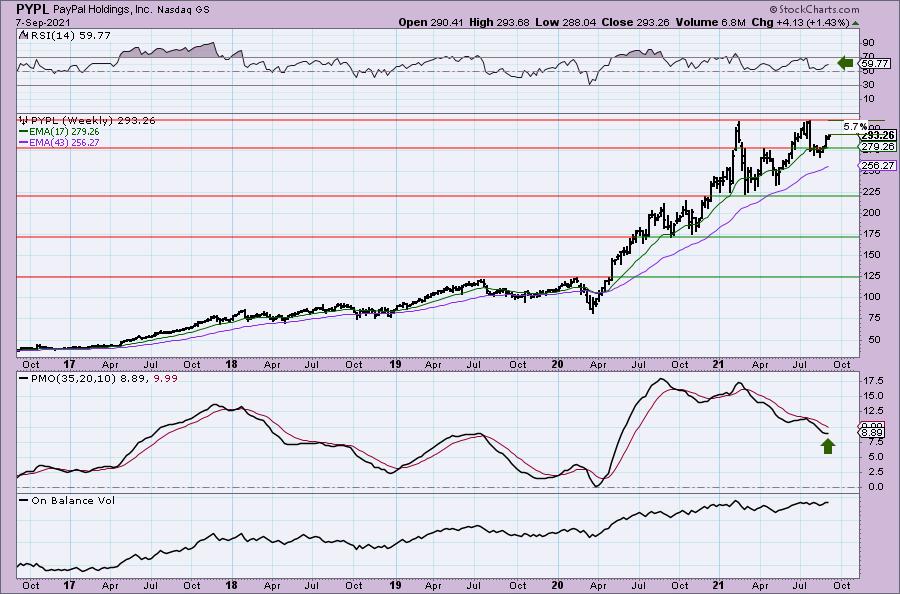
The weekly chart is favorable with a positive weekly RSI and weekly PMO that is curling upward. Overhead resistance is very close by, but indicators suggest an upcoming breakout move.
Tronox Holdings plc (TROX)
EARNINGS: 10/27/2021 (AMC)
Tronox Holdings Plc engages in the mining and inorganic chemical business. Its products include Titanium Dioxide Mineral Sands. The firm also mines and processes titanium ore, zircon and other minerals, and manufactures titanium dioxide pigments. The company was founded in 2006 and is headquartered in Stamford, CT.
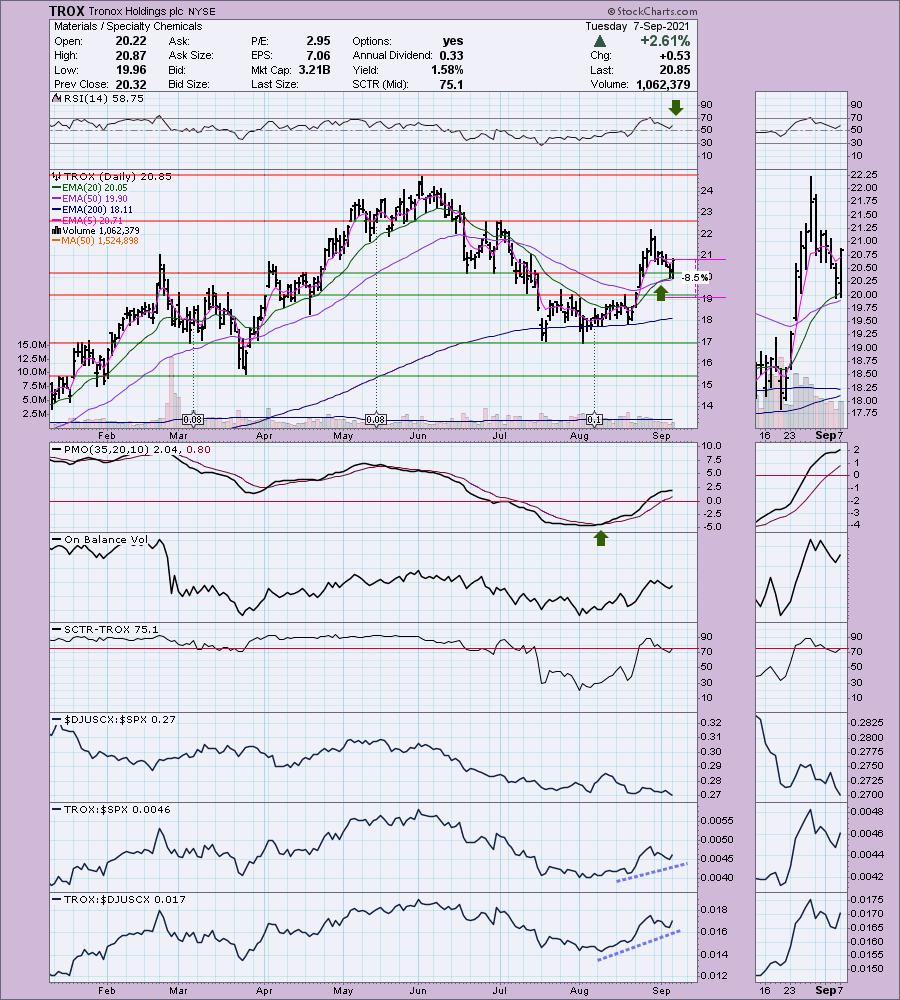
TROX is unchanged in after hours trading. Here is the pullback chart you have been waiting for. Price tested the 50-EMA on a pullback that began over a week ago. Today it rallied strongly. It didn't really break the currently declining trend, but I love the turnaround on the indicators. The RSI turned up just above net neutral (50) to remain in positive territory. The PMO which had been turning over on the decline, switched direction today. The group has not been outperforming and TROX has cooled relatively speaking, but in the intermediate-term, you could still consider it as outperforming given the rising bottoms on relative strength. The stop is set below support at the early August tops.
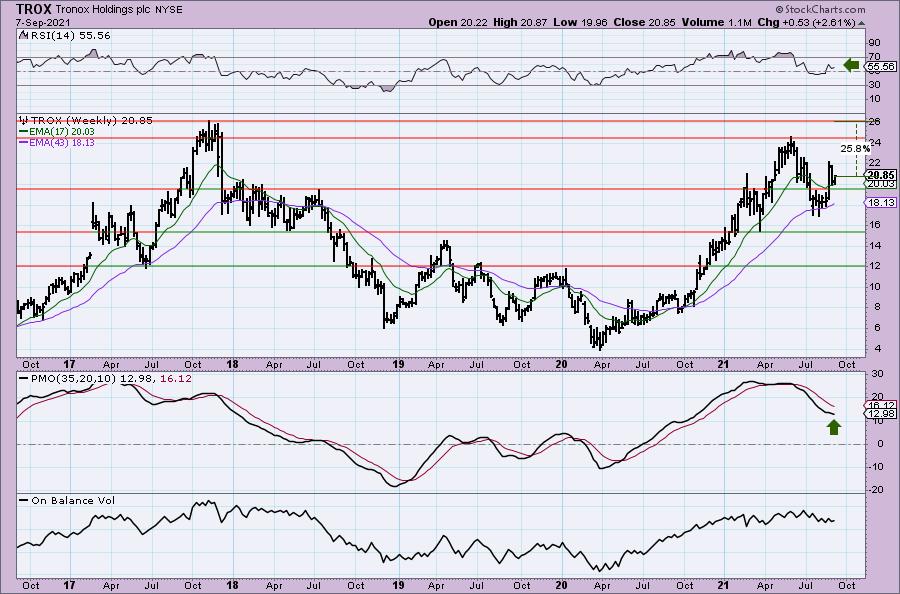
The weekly chart is showing some improvement with the weekly PMO decelerating. The weekly RSI is positive. Price also pulled back to important intermediate-term support along the 17-week EMA. Even if it just gets to the first line of overhead resistance that is a 17%+ move, but if it can test its all-time highs, that would be a gain of over 25%.
Don't forget, on Thursdays I look at reader-requested symbols, so shoot me an email at erin@decisionpoint.com. I read every email I receive and try to answer them all!
Current Market Outlook:
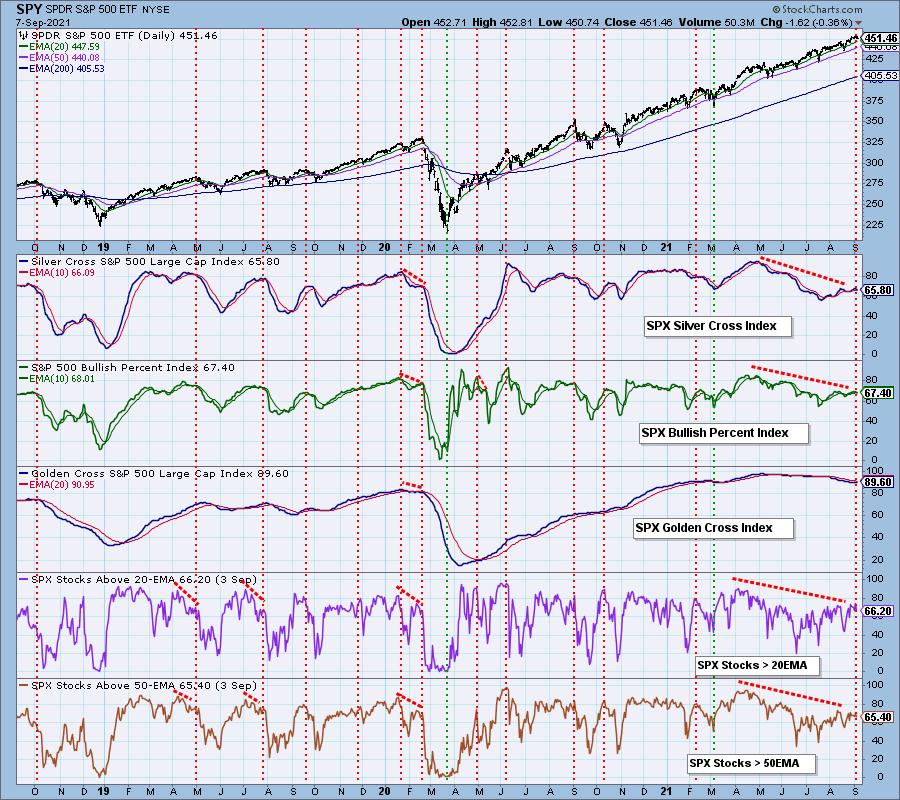
Market Environment: It is important to consider the odds for success by assessing the market tides. The following chart uses different methodologies for objectively showing the depth and trend of participation for intermediate- and long-term time frames.
- The Silver Cross Index (SCI) shows the percentage of SPX stocks on IT Trend Model BUY signals (20-EMA > 50-EMA)
- The Golden Cross Index (GCI) shows the percentage of SPX stocks on LT Trend Model BUY signals (50-EMA > 200-EMA)
- The Bullish Percent Index (BPI) shows the percentage of SPX stocks on Point & Figure BUY signals.
Don't forget that as a "Diamonds" member, you have access to our GCI/SCI curated ChartList on DecisionPoint.com. You'll find it under "Members Only" links on the left side on the Blogs and Links Page.
Here is the current chart:
Full Disclosure: I'm about 70% invested and 30% is in 'cash', meaning in money markets and readily available to trade with.
Technical Analysis is a windsock, not a crystal ball.
Happy Charting!
- Erin
erin@decisionpoint.com
Watch the latest episode of DecisionPoint with Carl & Erin Swenlin on Mondays 7:00p EST or on the DecisionPoint playlist on the StockCharts TV YouTube channel here!
NOTE: The stocks reported herein are from mechanical trading model scans that are based upon moving average relationships, momentum and volume. DecisionPoint analysis is then applied to get five selections from the scans. The selections given should prompt readers to do a chart review using their own analysis process. This letter is not a call for a specific action to buy, sell or short any of the stocks provided. There are NO sure things or guaranteed returns on the daily selection of "Diamonds in the Rough."
Helpful DecisionPoint Links:
DecisionPoint Shared ChartList and DecisionPoint Chart Gallery
Price Momentum Oscillator (PMO)
Swenlin Trading Oscillators (STO-B and STO-V)
For more links, go to DecisionPoint.com