
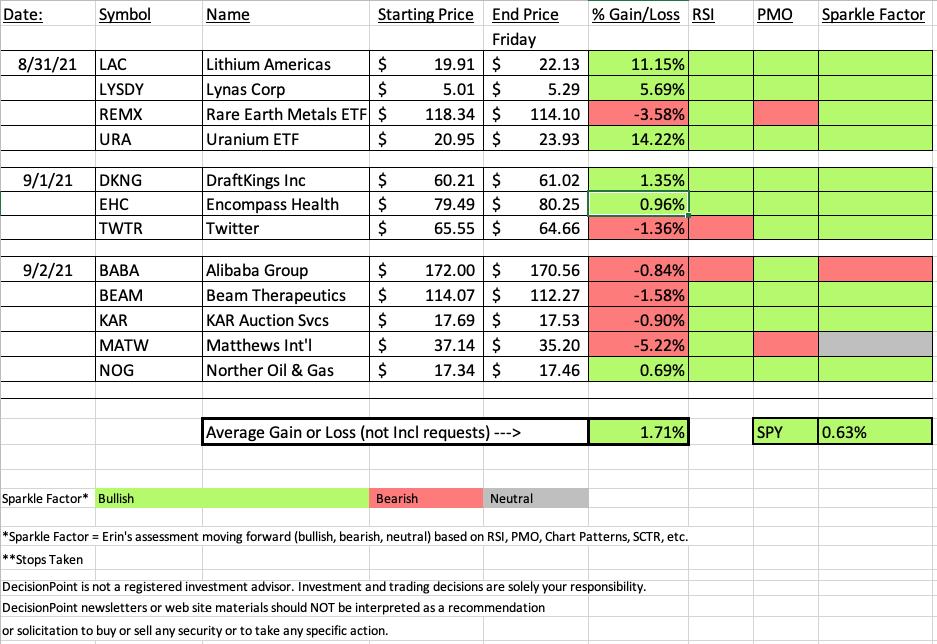
A successful week overall for "Diamonds in the Rough", mainly off the back of various rare earth metals. Those Tuesday picks in that area of the market were very successful, with the exception of the actual Rare Earth/Strategic Metals ETF (REMX) which was down about 3.5% since Tuesday. I still like this area of the market and would consider this pullback on REMX an opportunity. Keep the chart in your watch list.
You'll see a new 'ad' below. I recorded a presentation that was included in "Women on Wealth - Smart Choices for Treacherous Markets". I highly recommend you take advantage of this FREE download. The other women on the panel are titans in this industry--I was happy to be included in their company.
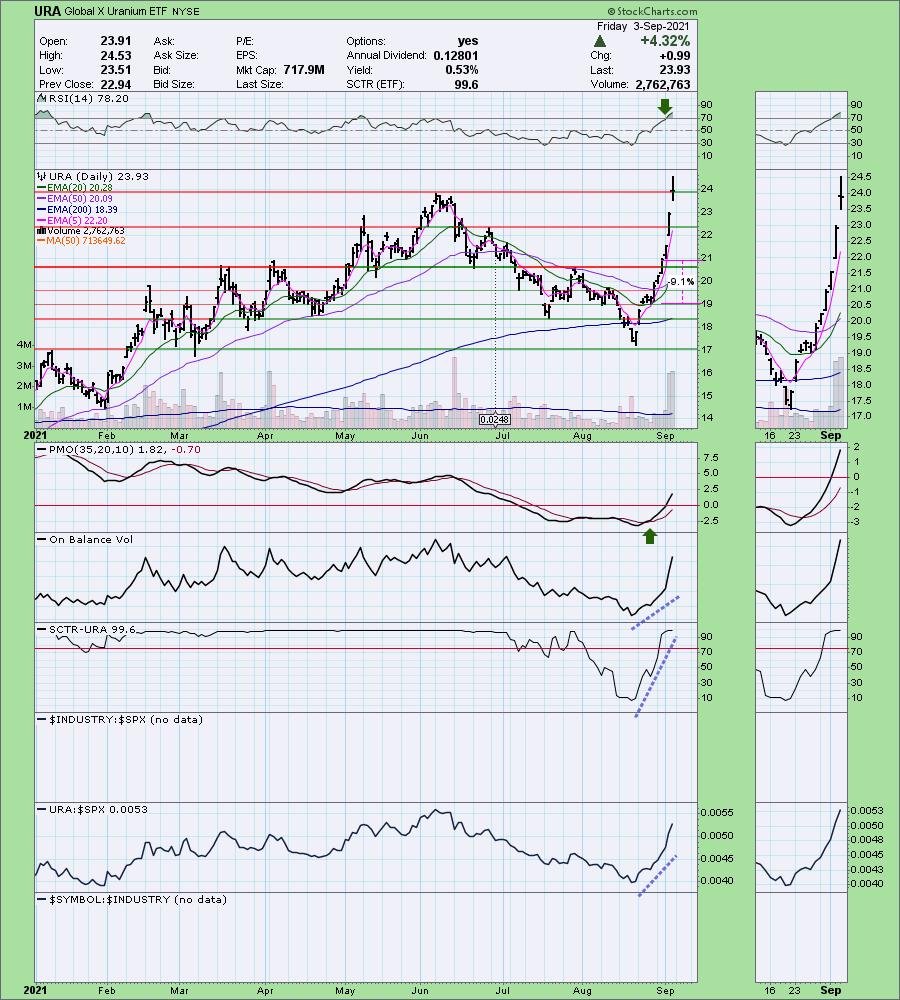
The "Darling" this week was Uranium (URA) which was up 14.22% since being picked on Tuesday.
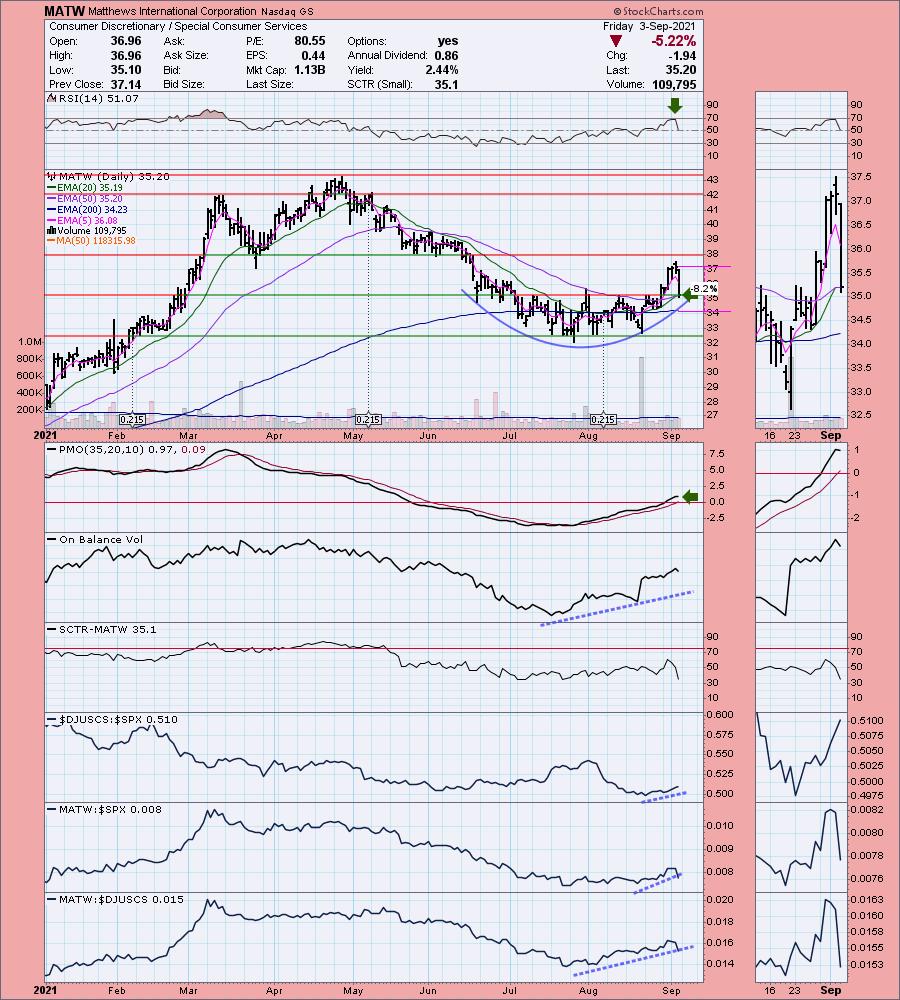
The "Dud" this week was Mathews Int'l (MATW). It is actually in the group that I feel is a "one to watch" this week. I mentioned this group already this week, but I still like the chart going into next week. I'm not so sure MATW will be a good choice in this group moving forward.
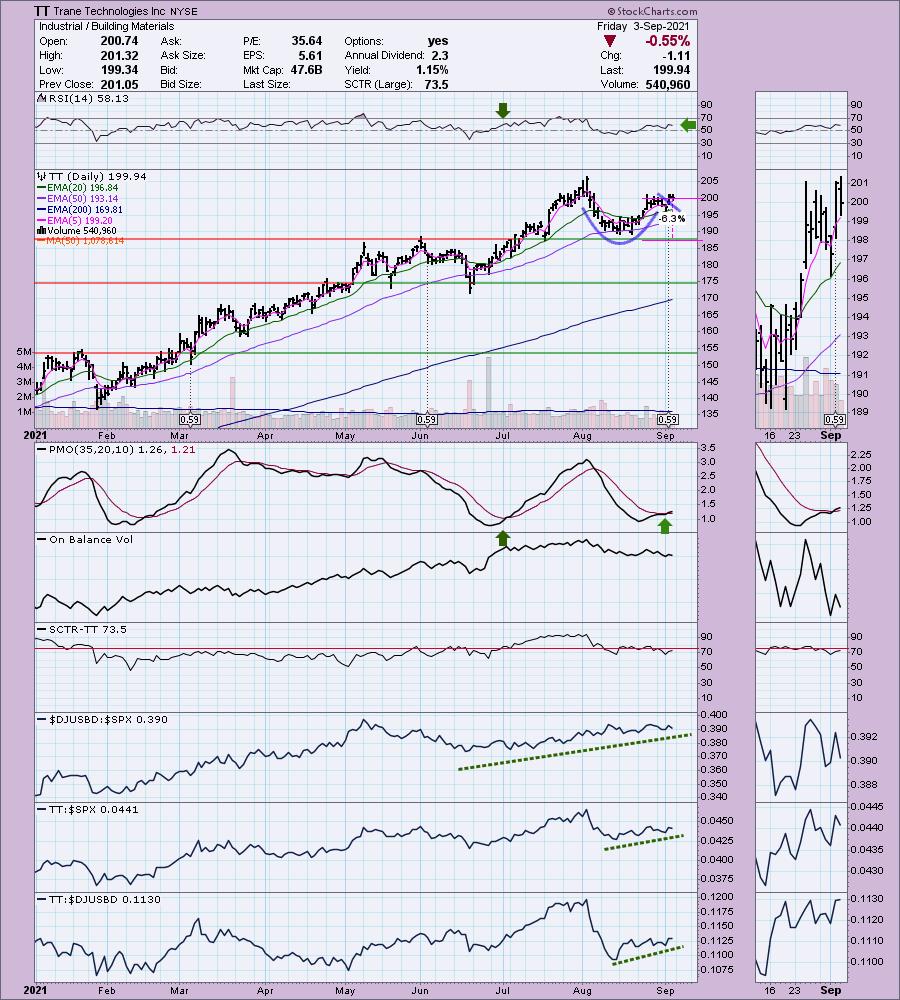
I don't normally pick a stock on Friday's, Trane Technologies (TT) has an excellent looking chart going into next week. I talked about during yesterday's Chartwise Women. Beautiful cup and handle that is in the process of executing. Positive RSI and new PMO crossover BUY signal. The expectation of the pattern is a breakout above the start of the cup. Full Disclosure: I am considering this for my portfolio next week, I want to see a breakout above short-term overhead resistance.
Register now for next Friday's Diamond Mine trading room below or right HERE.

No Recording on 8/27 due to illness.
RECORDING LINK Friday (8/20):
Topic: DecisionPoint Diamond Mine (8/20/2021) LIVE Trading Room
Start Time : Aug 20, 2021 08:58 AM
Meeting Recording Link HERE.
Access Passcode: August/20th
REGISTRATION FOR FRIDAY 9/3 Diamond Mine:
When: Sep 3, 2021 09:00 AM Pacific Time (US and Canada)
Topic: DecisionPoint Diamond Mine (09/03/2021) LIVE Trading Room
Register in advance for this webinar HERE.
Save the registration confirmation email with login instructions in case Zoom doesn't notify you in time.


Julius de Kempenaer "Mr. RRG" Will Be in TUESDAY's DP Trading Room! Be sure to get your symbol requests in this weekend and he'll add it to an RRG! Register HERE if you haven't already!
Free DP Trading Room (8/30) RECORDING LINK:
Topic: DecisionPoint Trading Room
Start Time : Aug 30, 2021 08:57 AM
Meeting Recording Link.
Access Passcode: August-30th
For best results, copy and paste the access code to avoid typos.
FREE eBook! "Smart Choices for Treacherous Markets"

Listen To These 11 Women!

These 11 women have more than 221 years combined experience in trading...
Which is why you should pay close attention to what they have to say.
If you ever wondered how to build wealth and generate income with less risk...
Or if there were simple tools that traders use to find profitable "big move trades" without risking all their capital...
My video chapter on Using Momentum and Relative Strength to Find the Best Trades shares how this smart woman is beating the markets.
To download your FREE copy, click HERE.
A few items about the spreadsheet: I've put on the spreadsheet whether the RSI is positive (green) or negative (red). The PMO column tells you if it is rising (green) or falling (red). Finally I've added my own "Sparkle Factor" that gives you my assessment going forward, bullish (green), bearish (red) or neutral (gray). The Sparkle Factor is basically my thoughts on whether I expect it to rise or fall. A neutral means it could really go either way so it could be added to a watch list. If you're in a stock I consider "neutral" going forward, the ball is in your court.
Darling:
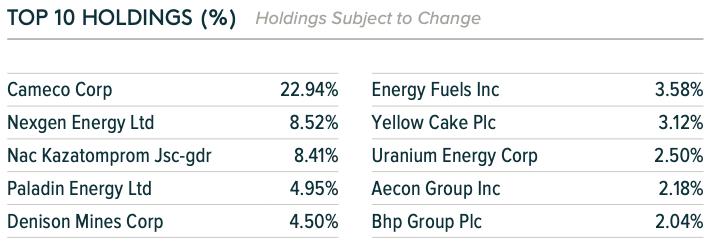
Global X Uranium ETF (URA)
EARNINGS: N/A
URA tracks a market-cap-weighted index of companies involved in uranium mining and the production of nuclear components.
 Below is the commentary and chart from Tuesday:
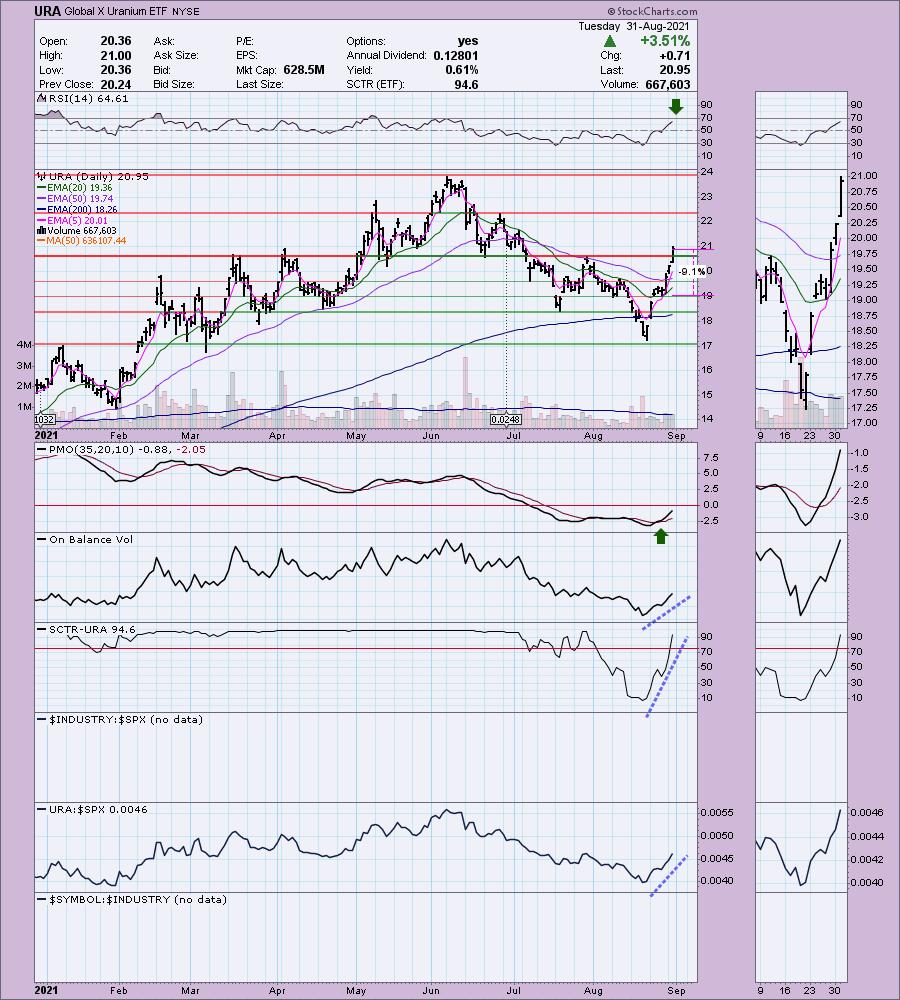
"URA is up +0.24% in after hours trading. I covered URA on October 21st 2020. The position is still open as the 6.4% stop was never hit. Currently it is up +87.1% since. It has been enjoying a strong rally the last half of this month, but there is plenty of upside potential even on the daily chart. The RSI is positive and the PMO is on a oversold crossover BUY signal. The OBV is confirming the current rally. The SCTR shot up into the "hot zone" above 75, meaning it is in the upper 6% of all ETFs out there as far as relative strength. The stop is at 9.1% which puts at gap support."
Here is today's chart:
Not much to add except 'wow'. We now have a breakout above overhead resistance. The RSI is overbought, so there may be an opportunity for a pullback entry, but with a runner like this, overbought conditions can persist. Full Disclosure: I own URA.
Don't forget, on Thursdays I look at reader-requested symbols, so shoot me an email at erin@decisionpoint.com. I read every email I receive and try to answer them all!
Dud:
Matthews International Corporation (MATW)
EARNINGS: 10/26/2021 (AMC)
Matthews International Corp. engages in the provision of brand solutions, memorialization products, and industrial technologies. It operates through the following segments: SGK Brand Solutions, Memorialization, and Industrial Technologies. The SGK Brand Solutions segment consists of brand management, pre-media services, printing plates and cylinders, engineered products, imaging services, digital asset management, merchandising display systems, and marketing and design services for consumer goods and retail industries. The Memorialization segment consists of bronze and granite memorials, and other memorialization products, caskets and cremation and incineration equipment for cemetery and funeral home industries. The Industrial Technologies segment includes marking and coding equipment and consumables, industrial automation products and order fulfillment systems for identifying, tracking, picking and conveying consumer, and industrial products. The company was founded by John Dixon Matthews in 1850 and is headquartered in Pittsburgh, PA.
Below is the commentary and chart from yesterday:
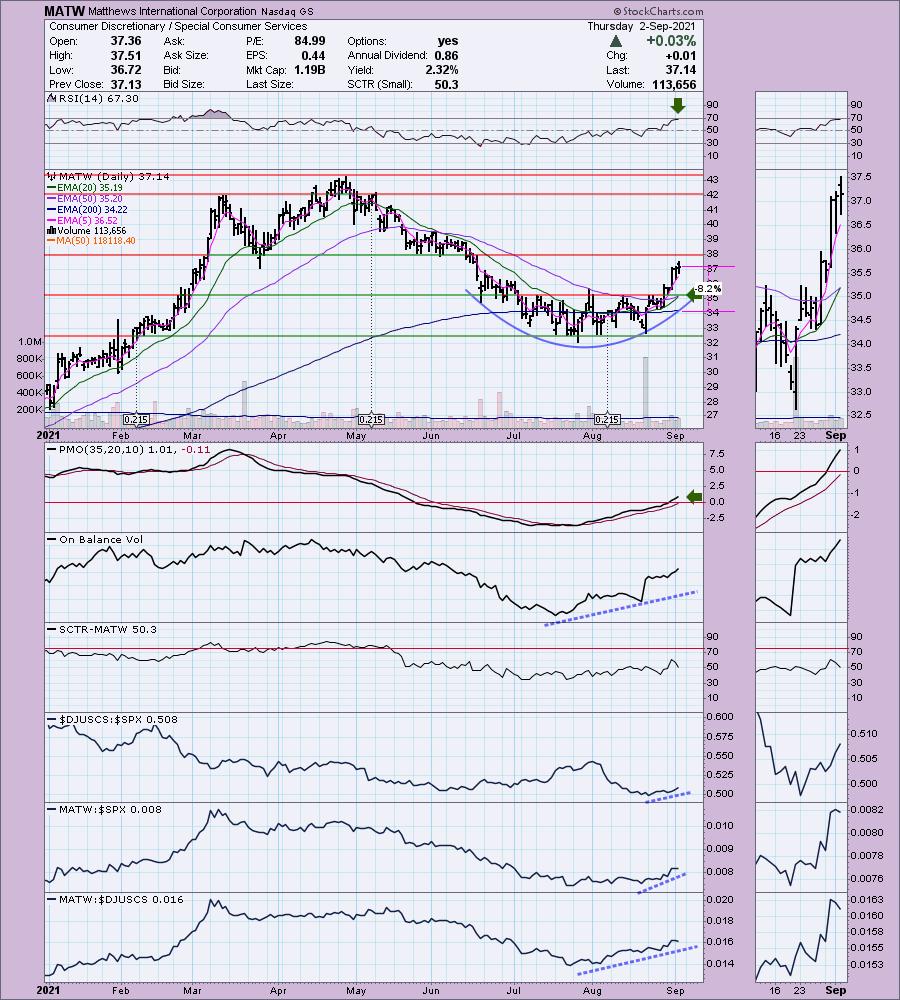
"MATW is unchanged in after hours trading. This chart is very bullish for a number of reasons. The price pattern is a cup shaped basing pattern. Price broke above key moving averages this past week and is headed toward a test of overhead resistance at $38. We could see a pullback there to form a handle on this saucer, but it isn't a given. The RSI is positive and not yet overbought. The PMO just hit positive territory after a clean upside crossover. The OBV has a positive divergence with the almost flat price bottoms. The SCTR could use some help, but relative strength looks very good. I've set the stop at the 200-EMA."
Below is today's chart:
I actually listed this with a "neutral" Sparkle Factor, meaning I don't think it is bearish enough to not buy, but there is risk involved given today's deep decline. It closed right on the 50-EMA and support. This could be a natural pullback after a breakout, or it could be a failure that will see a test of $32.50. I think there are better choices out there, but I think you can watch list this one.
THIS WEEK's Sector Performance: 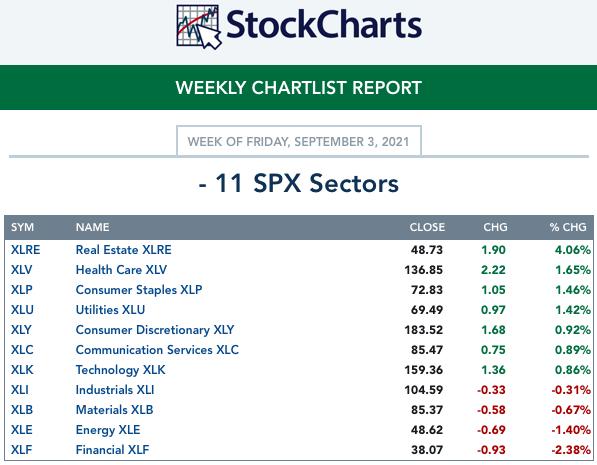
DecisionPoint Sector Scoreboard (Mechanical Trend Model Signals):
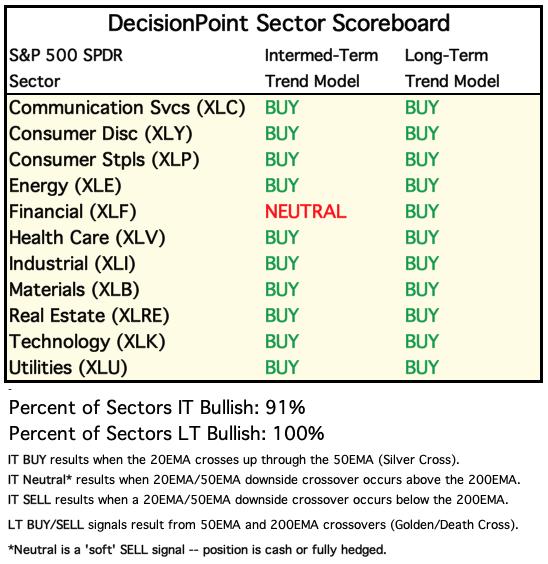
Click Here to view Carl's annotated Sector ChartList!
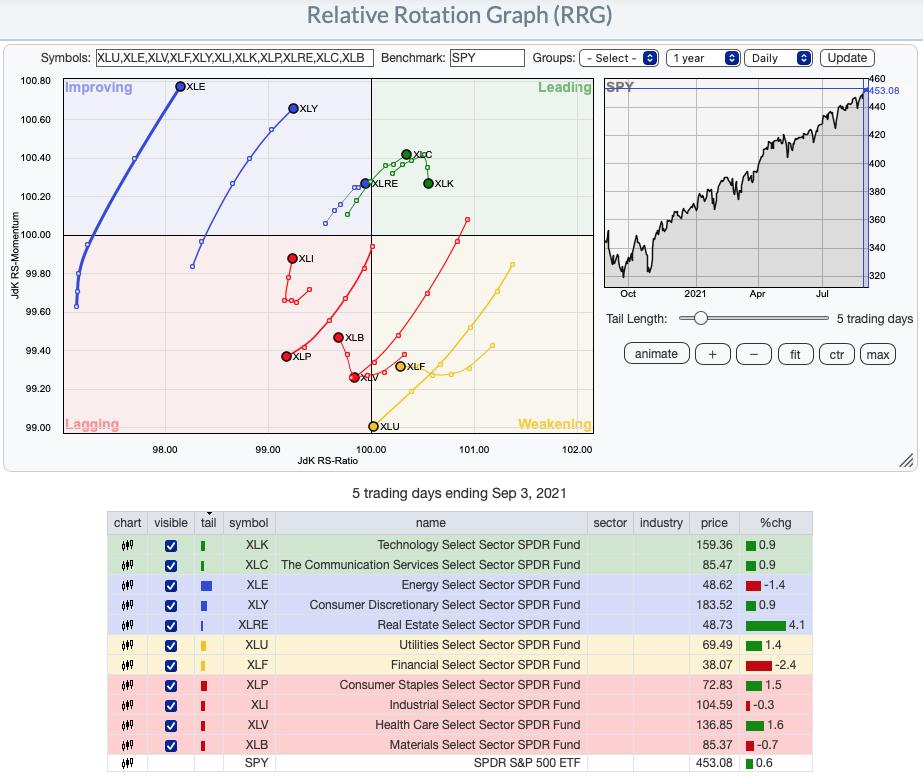
Short-term RRG: We have quite a few sectors that are showing relative strength right now. In particular, XLE, XLY, XLC and XLRE. I did pick Technology (XLK) as the sector to watch next week. In particular, consider Software, Semiconductors and Computer Hardware.
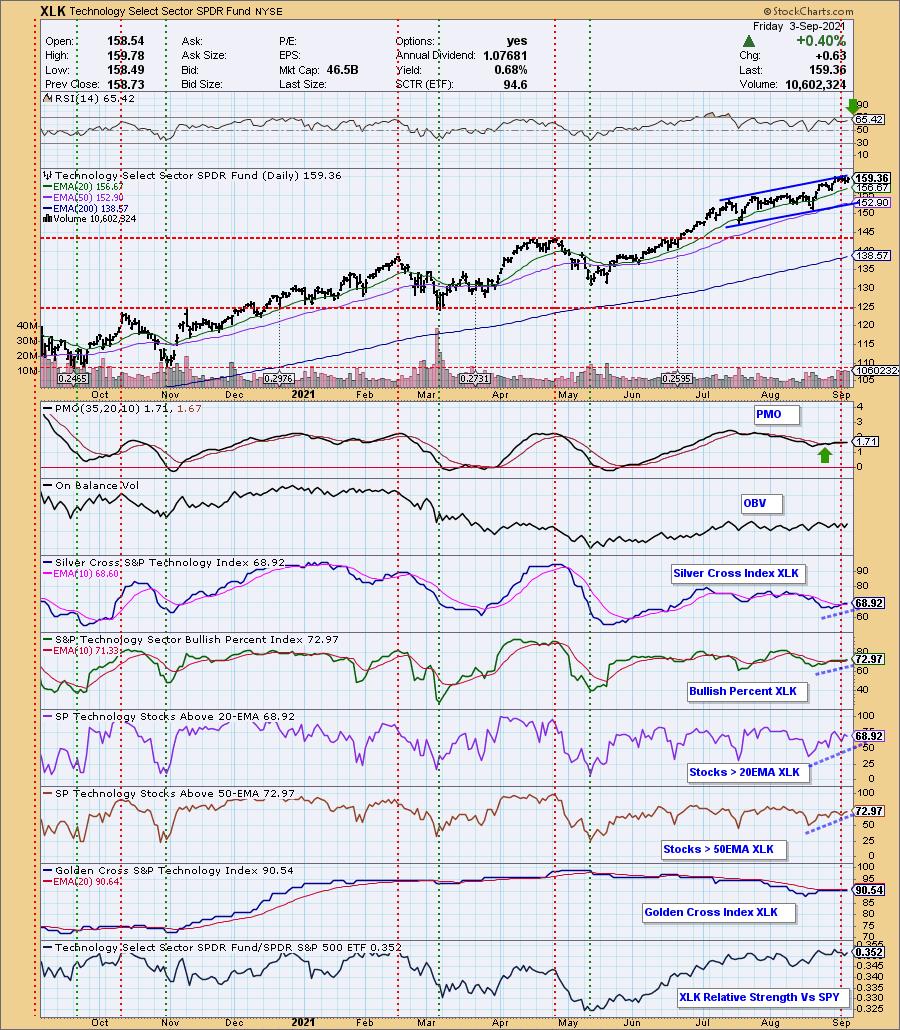
Sector to Watch: Technology (XLK)
I believe that XLRE is overbought and XLI isn't improving enough. XLY has problems with participation. So I opted to pick Technology as the sector to watch. Currently XLK is in a rising trend channel. The risk is that it is about to test the bottom of the channel. However, it is holding short-term support at the late August top. There is a bullish bias given participation is higher than the SCI reading. It is just beginning to outperform the SPX.
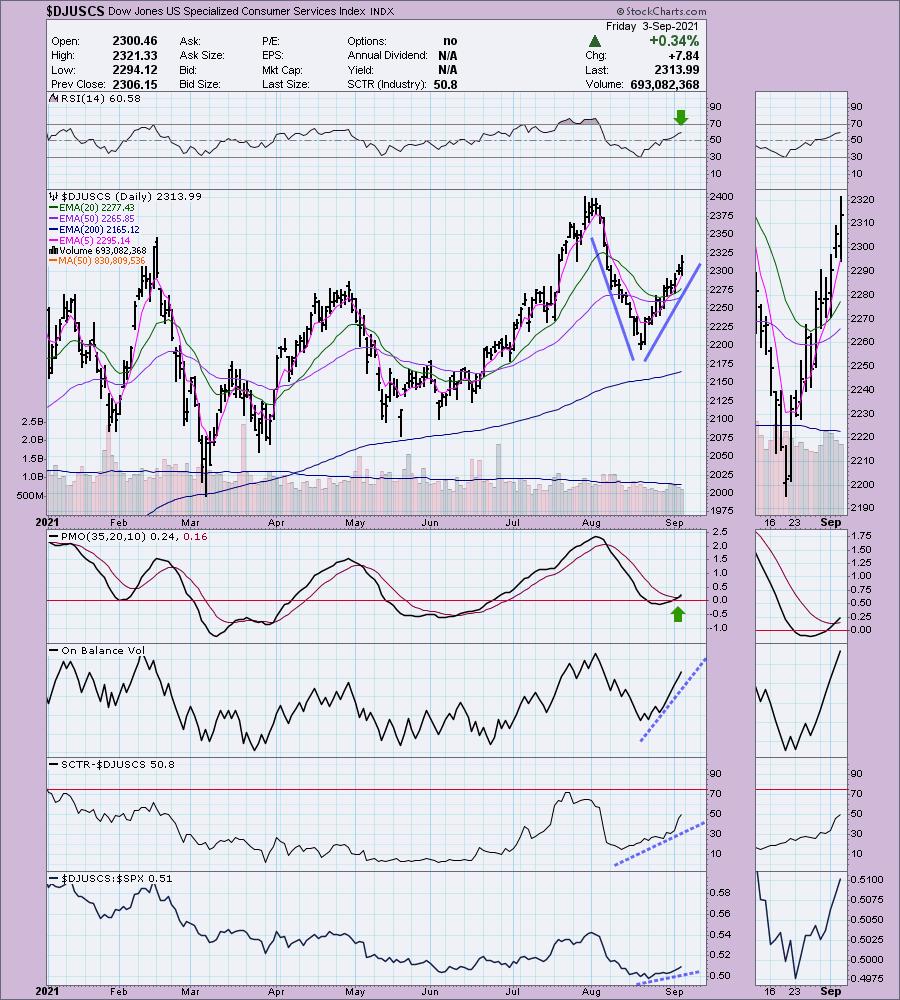
Industry Group to Watch: Specialized Consumer Services ($DJUSCS)
I know I showed you this chart yesterday. It is only getting better. That "V" bottom suggests we will see an upside breakout above resistance at 2400. The PMO has just triggered a crossover BUY signal and the RSI is positive. It is now outperforming the SPX.
Go to our Sector ChartList on DecisionPoint.com to get an in depth view of all the sectors.
Technical Analysis is a windsock, not a crystal ball.
Have a great HOLIDAY weekend & Happy Charting! Next Diamonds Report is Tuesday 9/7.
- Erin
erin@decisionpoint.com
Full Disclosure: I'm about 70% invested right now and 30% is in 'cash', meaning in money markets and readily available to trade with.
Watch the latest episode of DecisionPoint with Carl & Erin Swenlin on Mondays 7:00p EST or on the DecisionPoint playlist on the StockCharts TV YouTube channel here!
NOTE: The stocks reported herein are from mechanical trading model scans that are based upon moving average relationships, momentum and volume. DecisionPoint analysis is then applied to get five selections from the scans. The selections given should prompt readers to do a chart review using their own analysis process. This letter is not a call for a specific action to buy, sell or short any of the stocks provided. There are NO sure things or guaranteed returns on the daily selection of "diamonds in the rough."
Helpful DecisionPoint Links:
DecisionPoint Shared ChartList and DecisionPoint Chart Gallery
Price Momentum Oscillator (PMO)
Swenlin Trading Oscillators (STO-B and STO-V)
(c) Copyright 2021 DecisionPoint.com