
There were actually hundreds of stocks to look at when you combine the four scans I used today. Using CandleGlance I honed in a handful that looked promising based simply on price and the PMO. After that I studied those and picked out what I think are the most bullish based on my analysis process.
One thing I wasn't thrilled with (and something that is becoming a problem on most stocks) is that upside potential is difficult to determine because so many stocks are very near or are at all-time highs. Also, any type of pullback will cause weekly PMOs to point downward because they have soared out of the bear market low. Remember that I'm trying to get in on a rally as soon as possible. Intermediate-term reversals take time with the PMO. Just consider most of these "Diamonds in the Rough" as short-term investments if the weekly charts aren't especially bullish.
With Materials breaking out today, it was no surprise that many of them found their way into my scan results. I've been stalking Steel and two companies came in: Cleveland-Cliffs (CLF) and Nuecor (NUE). I opted for NUE, but CLF is priced lower and may be of more interest to you. I chose NUE based on the slightly more favorable OBV line.
The other two are actually Cyclicals. One is in auto parts and the other is in recreational services. Be careful with these.
Finally, "Diamonds in the Rough" are not meant to be purchased and held for a week. Case in point, all of last week's Diamonds are up except two and none have hit their stop levels. I'm not presenting any of these "Diamonds in the Rough" as a "call to action". My primary point is to show you what constitutes a good chart based on my indicators, analysis and scans.
Earnings Update: Just FYI some of the big stocks reported after hours today. It seems based on after hours trading, there are mixed reviews so a sector like Materials may lose some of the love it got today. GOOGL is up +3.03% in after hours trading, AAPL -1.53%, MSFT +0.89% and Visa (V) -1.11%. It'll be interesting to see how this shakes out tomorrow.
Today's "Diamonds in the Rough" are: ALV, NUE, RICK and SXT.
Stocks to Review ** (no order): CLF, EW, INFY, MP, LVMUY, and CNMD.
** The "Stocks to Review" are stocks that were on my short list for the day.

RECORDING LINK Friday (7/16):
Topic: DecisionPoint Diamond Mine (7/16/2021) LIVE Trading Room
Start Time : Jul 16, 2021 09:02 AM
Meeting Recording Link.
Access Passcode: July-16th
RECORDING LINK Friday (7/23):
Topic: DecisionPoint Diamond Mine (07/23/2021) LIVE Trading Room
Start Time : Jul 23, 2021 09:00 AM
Recording link for 7/23 Diamond Mine is HERE.
Access Passcode: July/23rd
REGISTRATION FOR FRIDAY 7/30 Diamond Mine:
When: Jul 30, 2021 09:00 AM Pacific Time (US and Canada)
Topic: DecisionPoint Diamond Mine (7/30/2021) LIVE Trading Room
Register in advance for the 7/30 Diamond Mine HERE.
Save the registration confirmation email with login instructions in case Zoom doesn't notify you in time.
Free DP Trading Room (7/26) RECORDING LINK:
Topic: DecisionPoint Trading Room
Start Time : Jul 26, 2021 08:59 AM
Meeting Recording Link.
Access Passcode: July/26th
For best results, copy and paste the access code to avoid typos.
Welcome to DecisionPoint Daily Diamonds, wherein I highlight five "Diamonds in the Rough." These are selected from the results of my DecisionPoint scans, which search for stocks that could benefit from the trend and condition of the market. Remember, these are not recommendations to buy or sell, but are the most interesting of the stocks that surfaced in my scans. My objective is to save you the work of the initial, tedious culling process, but you need to apply your own analysis to see if these stocks pique your interest as well. There are no guaranteed winners here!
Autoliv, Inc. (ALV)
EARNINGS: 10/22/2021 (BMO)
Autoliv, Inc. engages in the development, manufacture, and supply of automotive safety systems. It operates through the Passive Safety and Electronics segment. The Passive Safety segment includes airbags, seatbelts, steering wheels, and restrain electronics. The Electronics segment comprises of restraint control systems, brake control systems and active safety. The company was founded by Lennart Lindblad in 1953 and is headquartered in Stockholm, Sweden.
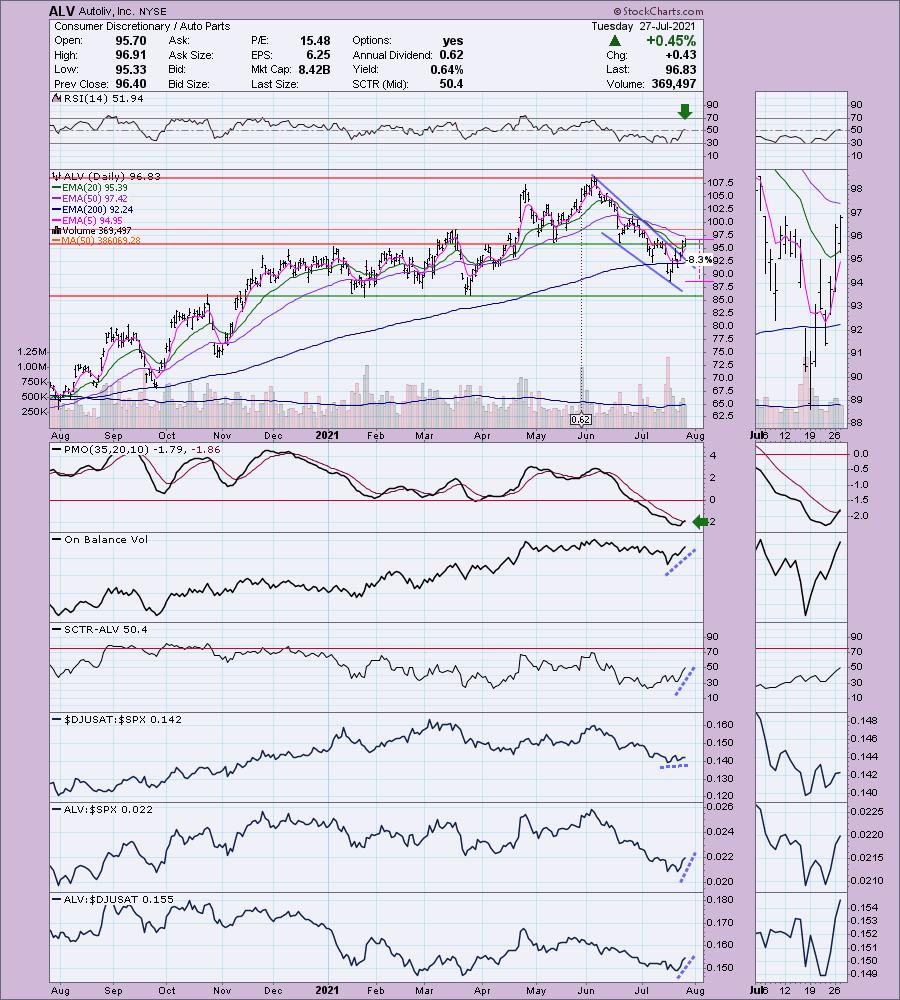
ALV is unchanged in after hours trading. This industry group was doing great this past spring but then cooled way off. It hasn't really taken off yet, but it did break its declining relative performance trend. If this group decides to get hot, this one outperforms the group. Right now it is already outperforming both the group and the SPX. The price chart interested me given the breakout from a bullish falling wedge. The RSI has just moved into positive territory and the PMO had a crossover BUY signal. What makes it a bit risky in my mind is that it hasn't broken above the 50-EMA yet. However, we should see a ST Trend Model BUY signal soon when the 5-EMA crosses above the 20-EMA.
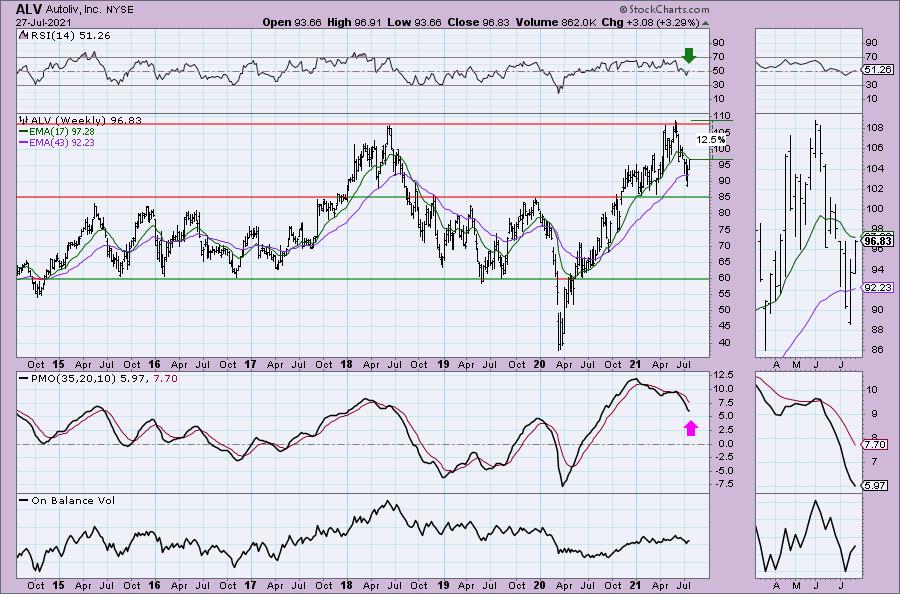
The weekly PMO is not good. However price is bouncing off the 43-week EMA and it didn't need to go all the way down to support before rebounding. As noted in my opening, upside potential is difficult to really determine given its proximity to the all-time high, but at a minimum make your upside target twice your stop level at a minimum. Given the stop level is at 8.3%, set the upside target at 17%.
Nucor Corp. (NUE)
EARNINGS: 10/21/2021 (BMO)
Nucor Corp. engages in the manufacturing of steel and steel products. It operates through the following segments: Steel Mills, Steel Products, and Raw Materials. The Steel Mills segment comprises of carbon and alloy steel in sheet, bars; structural and plate; steel trading businesses; rebar distribution businesses; and Nucor's equity method investments. The Steel Products segment includes steel joists and joist girders, steel deck, fabricated concrete reinforcing steel, cold finished steel, steel fasteners, metal building systems, steel grating, tubular products businesses, piling products business, and wire and wire mesh. The Raw Materials segment consists of direct reduced iron, and ferrous and nonferrous metals. The company was founded by Ransom E. Olds in 1905 and is headquartered in Charlotte, NC.
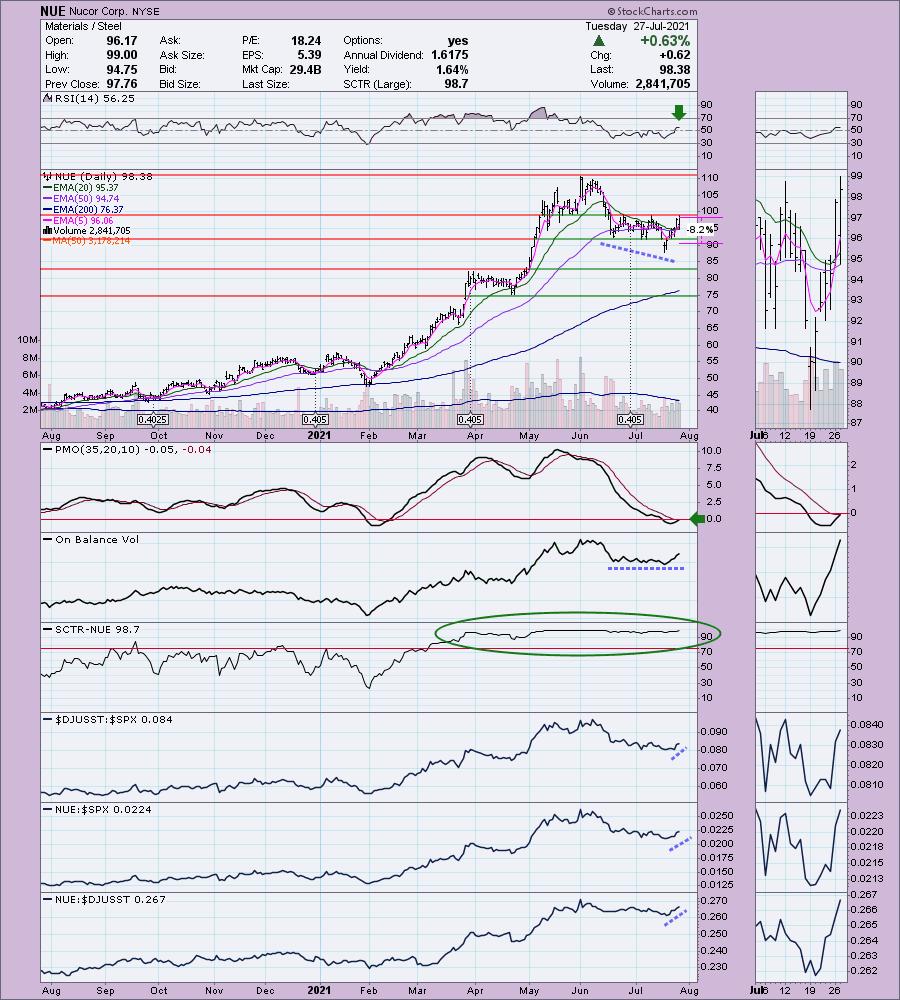
NUE is down -0.38% in after hours trading. I've covered it twice before, most recently as a Reader Request on June 3rd 2021 where the 7.3% stop was hit before the end of the month. Prior to that I covered it in the February 25th 2021 Diamonds Report as a bonus pick. That position is up +59.9% since.
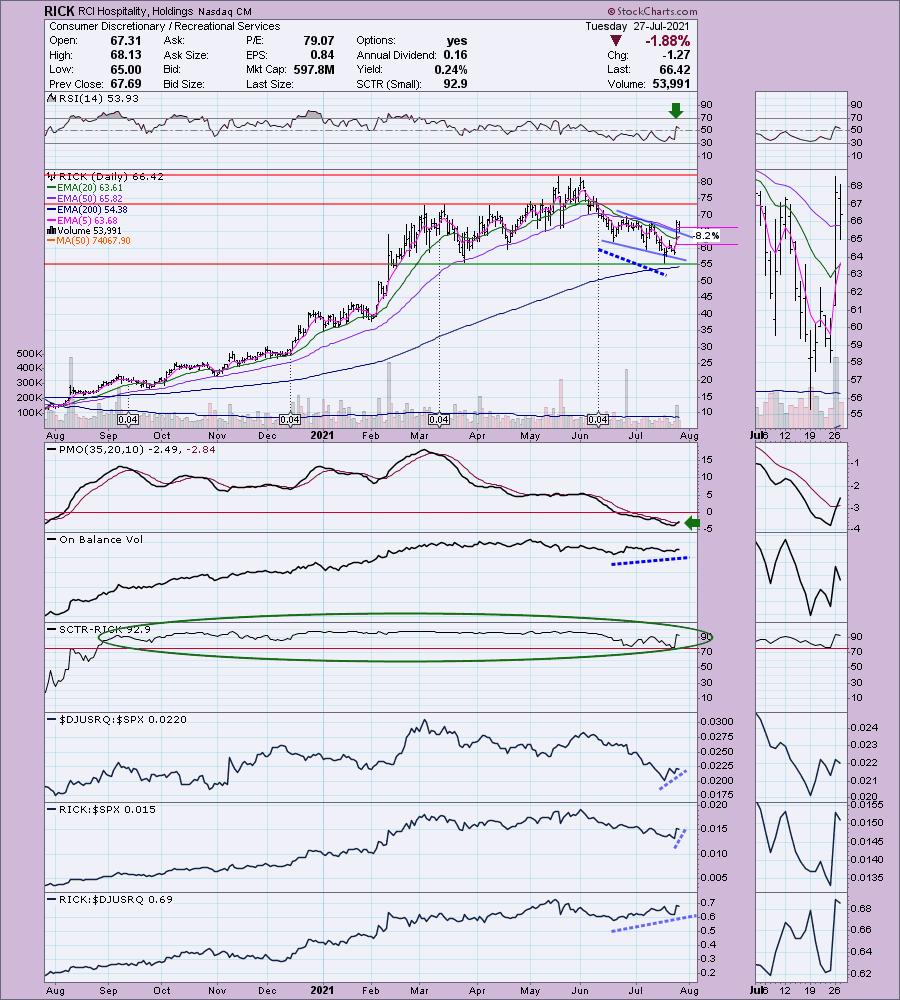
My only hesitation in presenting this one is that it hasn't broken above overhead resistance at the prior tops. However, it did trade entirely above the 50-EMA for two days which does make it worth presenting. The RSI just turned positive and the PMO is about to give us an oversold BUY signal. There is a slight positive divergence between price lows and OBV lows. Despite the correction off the June top, the SCTR has remained in the "hot zone" above 75 which indicates it is in the top quartile among large-cap stocks based on the SCTR calculation which is weighted toward the intermediate and long terms. The stop is set at 8.2%, but you could tighten that up and get rid of it if it doesn't breakout as it should. Or bide your time and put it in a watch list.
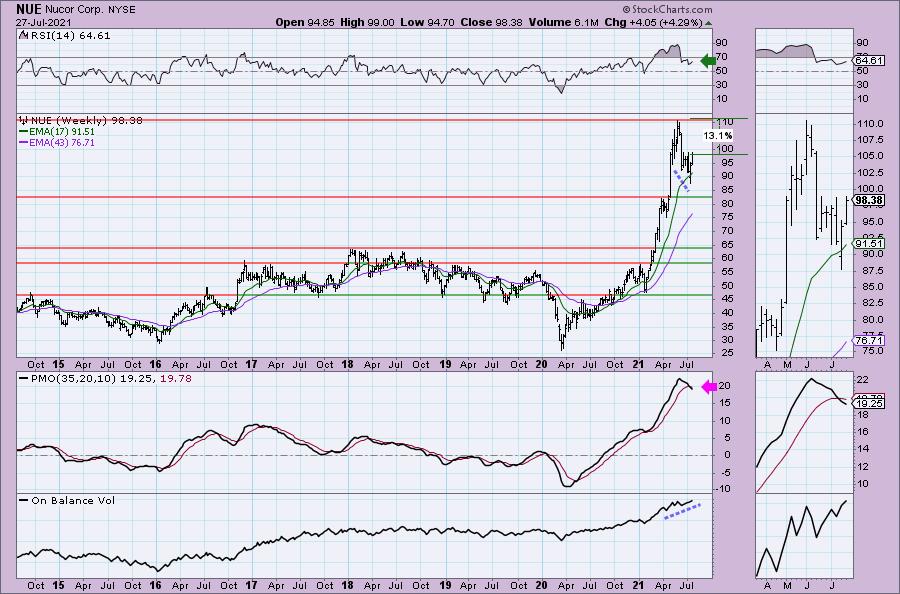
The weekly chart is alright. The PMO did give us a negative crossover, but it is already trying to flatten out in the thumbnail. The RSI is positive and not overbought and there is a nice OBV positive divergence which suggests a sustained rally here. The all-time highs are 13.1% away, but consider an upside target around 17%.
RCI Hospitality, Holdings (RICK)
EARNINGS: 8/9/2021 (AMC)
RCI Hospitality Holdings, Inc. operates as a holding company, which engages in hospitality activities and related businesses. Through its subsidiaries, it offers live adult entertainment and bar operations. It operates through the following segments; Nightclubs, Bombshells and Other. The Nightclubs segment operates adult entertainment clubs. Its major brands include Rick's Cabaret, Jaguar's Club, Tootsie's Cabaret, XTC Cabaret and Club Onyx. The Bombshells segment operates restaurants in Texas, Dallas, Austin and Houston. The Other segment includes media which is a business communications company. The company was founded by Robert L. Watters in 1983 and is headquartered in Houston, TX.
RICK is unchanged in after hours trading. Quite a few reasons I like this chart. The RSI is now positive. A bullish falling wedge resolved upward yesterday and today price pulled back to the breakout point. It also stayed above the 50-EMA. There is a new ST Trend Model BUY signal as the 5-EMA crossed above the 20-EMA. The PMO is on a new crossover BUY signal. There is a strong positive divergence between price lows and the OBV lows. The SCTR has been in the "hot zone" nearly the entire year. Relative performance is very favorable. The stop is set at 8.2% which is just below the June low.
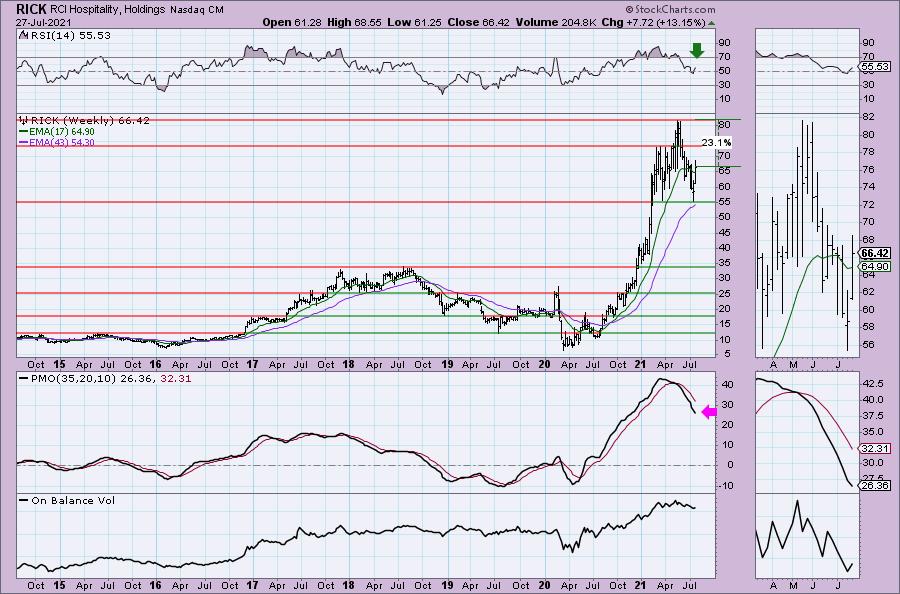
The weekly RSI is positive and rising. The PMO is not good, but may be decelerating its decline as noted in the thumbnail. Price bounced off the 43-week EMA and support at the earlier 1st quarter low. This formation does look a little toppy on the weekly chart so if it fails to break above the highs from earlier this year, don't keep it. If it does breakout, there is a +23% upside target.
Sensient Technologies Corp. (SXT)
EARNINGS: 10/22/2021 (BMO)
Sensient Technologies Corp. engages in the manufacture of colors, flavors, and fragrances. It operates through the following segments: Flavors and Fragrances Group; Color Group; and Asia Pacific Group segments. The Flavors and Fragrances segment includes beverage flavors, bionutrients, savory flavors, sweet flavors, natural ingredients, and fragrance compounds and ingredients. The Color segment comprises of natural and synthetic color solutions for the food and beverage, cosmetic, pharmaceutical, and industrial markets. The Asia Pacific segment markets product lines in the Pacific Rim under the Sensient name. The company was founded in 1882 and is headquartered in Milwaukee, WI.
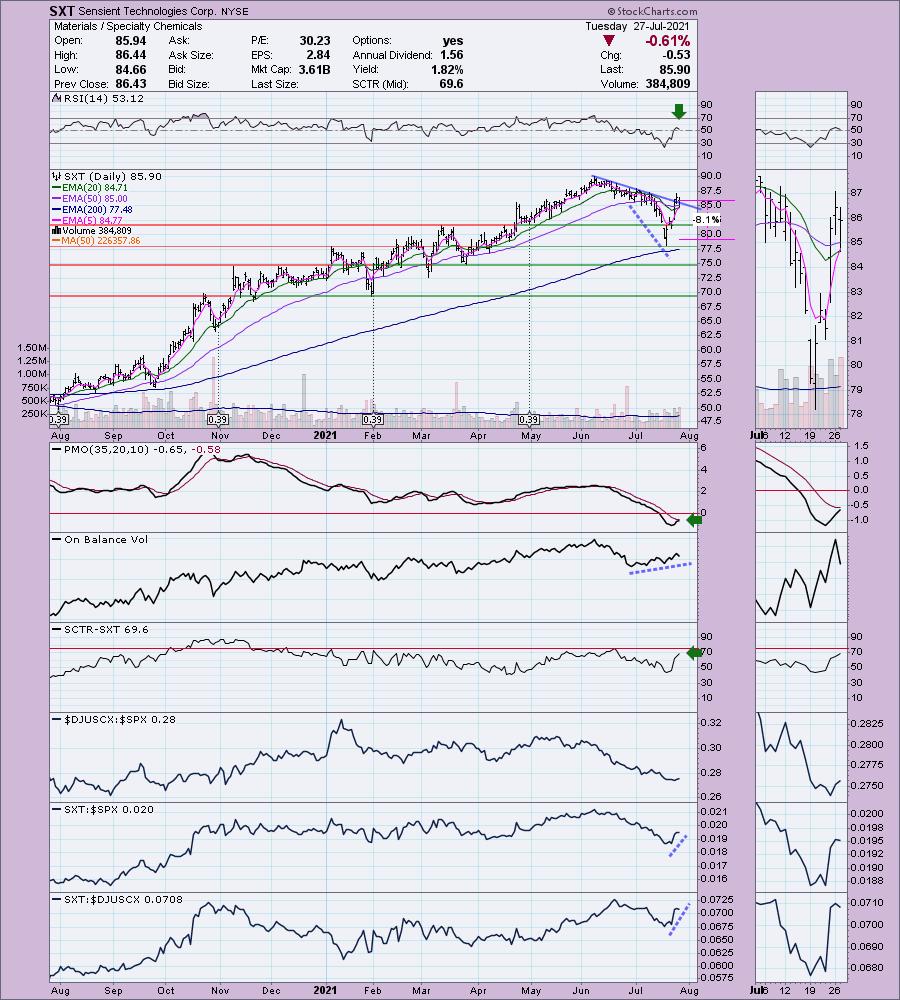
SXT is unchanged in after hours trading. Two things stood out to me on this one: the positive OBV divergence and the pullback to the 20-EMA. Add to that a positive RSI and PMO that is nearing a BUY signal and the chart looks even better. Today there was a ST Trend Model BUY signal as the 5-EMA crossed above the 20-EMA. The SCTR is rising indicating new internal strength. It is performing quite well against its group (which is just starting to show some relative strength) and the SPX.
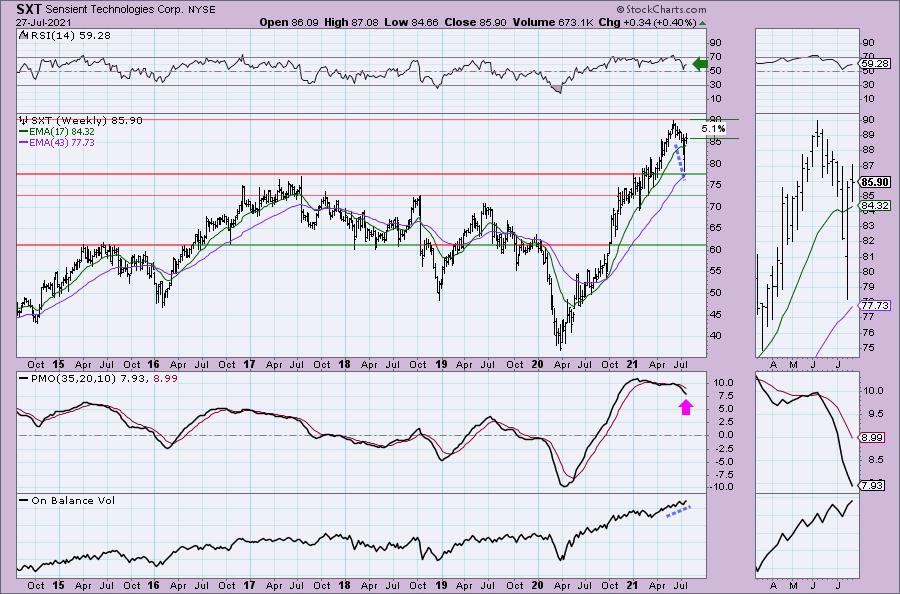
The positive OBV divergence is evident on the weekly chart as well. The weekly RSI is positive. The rebound last week occurred above the 43-week EMA and support at the 2017 high. Upside potential should be considered at 16.5% higher than the current price. That will require a breakout to new all-time highs.
"Under the Hood" Indicators
My webinar last week on "Under the Hood" Indicators at the Synergy Traders event was a success. I was able to get links to the recordings for BOTH days. You'll find my presentation in the second link. I was the last presenter.
Day 1 of Synergy Traders "Favorite Indicators" educational webinar event LINK.
Day 2 of Synergy Traders "Favorite Indicators" educational webinar event with Erin's webinar LINK.
Don't forget, on Thursdays I look at reader-requested symbols, so shoot me an email at erin@decisionpoint.com. I read every email I receive and try to answer them all!
Current Market Outlook:
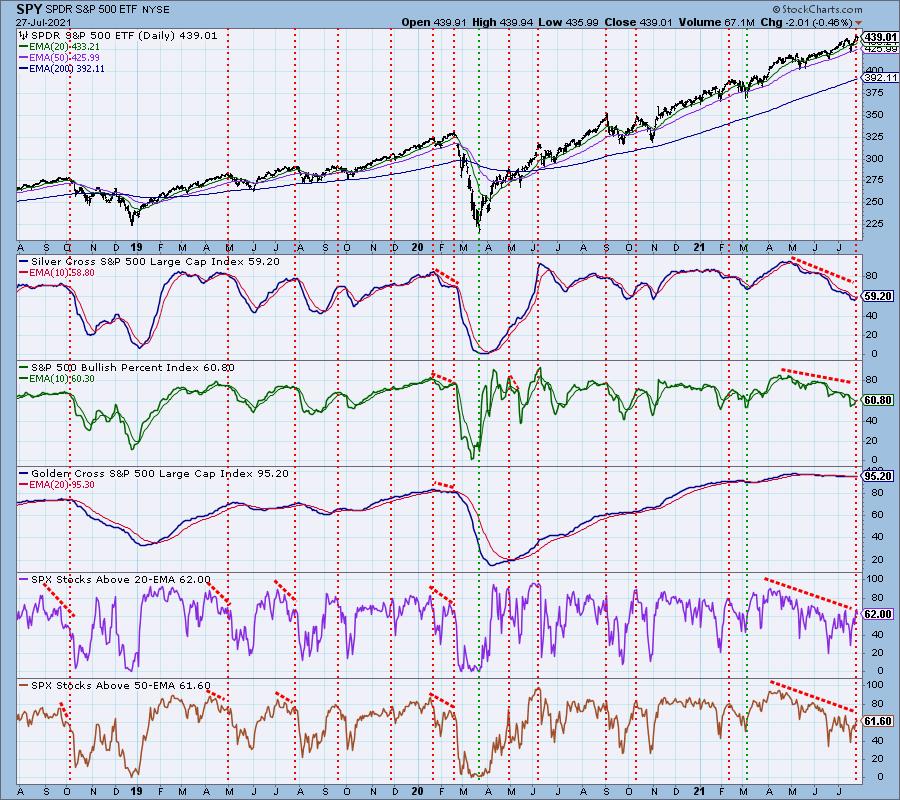
Market Environment: It is important to consider the odds for success by assessing the market tides. The following chart uses different methodologies for objectively showing the depth and trend of participation for intermediate- and long-term time frames.
- The Silver Cross Index (SCI) shows the percentage of SPX stocks on IT Trend Model BUY signals (20-EMA > 50-EMA)
- The Golden Cross Index (GCI) shows the percentage of SPX stocks on LT Trend Model BUY signals (50-EMA > 200-EMA)
- The Bullish Percent Index (BPI) shows the percentage of SPX stocks on Point & Figure BUY signals.
Don't forget that as a "Diamonds" member, you have access to our GCI/SCI curated ChartList on DecisionPoint.com. You'll find it under "Members Only" links on the left side on the Blogs and Links Page.
Here is the current chart:
Full Disclosure: I'm about 40% invested and 60% is in 'cash', meaning in money markets and readily available to trade with.
Technical Analysis is a windsock, not a crystal ball.
Happy Charting!
- Erin
erin@decisionpoint.com
Watch the latest episode of DecisionPoint with Carl & Erin Swenlin on Mondays 7:00p EST or on the DecisionPoint playlist on the StockCharts TV YouTube channel here!
NOTE: The stocks reported herein are from mechanical trading model scans that are based upon moving average relationships, momentum and volume. DecisionPoint analysis is then applied to get five selections from the scans. The selections given should prompt readers to do a chart review using their own analysis process. This letter is not a call for a specific action to buy, sell or short any of the stocks provided. There are NO sure things or guaranteed returns on the daily selection of "Diamonds in the Rough."
Helpful DecisionPoint Links:
DecisionPoint Shared ChartList and DecisionPoint Chart Gallery
Price Momentum Oscillator (PMO)
Swenlin Trading Oscillators (STO-B and STO-V)
For more links, go to DecisionPoint.com