
If you recall, last Friday I wrote that Healthcare was the sector to watch this week. Additionally, I listed my favorite industry group as Medical Supplies. Well today I have two medical supply companies that look promising. I also added a Biotech in the healthcare mix.
My extra today is an aerospace company. For some reason, I just kept going back to this particular chart. Something caught my eye despite the somewhat ugly weekly chart. You may want to look at some of the other aerospace companies and see if their charts are as favorable as this one.
Don't forget! Tomorrow is Reader Request Day! I have a few offered up, but I always like to see what else y'all are looking at! Gold Miners and Metals/Mining are beginning to pique my interest. Stay tuned.
Today's "Diamonds in the Rough" are: HOLX, HSIC, NSTG and TGI.
Stocks to Review ** (no order): SONY, DIOD, CSII, ARNC, BSBR, AMSWA, CYRX, JOE and ITRI.
** The "Stocks to Review" are stocks that were on my short list for the day.

RECORDING LINK Friday (7/16):
Topic: DecisionPoint Diamond Mine (7/16/2021) LIVE Trading Room
Start Time : Jul 16, 2021 09:02 AM
Meeting Recording Link.
Access Passcode: July-16th
RECORDING LINK Friday (7/23):
Topic: DecisionPoint Diamond Mine (07/23/2021) LIVE Trading Room
Start Time : Jul 23, 2021 09:00 AM
Recording link for 7/23 Diamond Mine is HERE.
Access Passcode: July/23rd
REGISTRATION FOR FRIDAY 7/30 Diamond Mine:
When: Jul 30, 2021 09:00 AM Pacific Time (US and Canada)
Topic: DecisionPoint Diamond Mine (7/30/2021) LIVE Trading Room
Register in advance for the 7/30 Diamond Mine HERE.
Save the registration confirmation email with login instructions in case Zoom doesn't notify you in time.
Free DP Trading Room (7/26) RECORDING LINK:
Topic: DecisionPoint Trading Room
Start Time : Jul 26, 2021 08:59 AM
Meeting Recording Link.
Access Passcode: July/26th
For best results, copy and paste the access code to avoid typos.
Welcome to DecisionPoint Daily Diamonds, wherein I highlight five "Diamonds in the Rough." These are selected from the results of my DecisionPoint scans, which search for stocks that could benefit from the trend and condition of the market. Remember, these are not recommendations to buy or sell, but are the most interesting of the stocks that surfaced in my scans. My objective is to save you the work of the initial, tedious culling process, but you need to apply your own analysis to see if these stocks pique your interest as well. There are no guaranteed winners here!
Hologic, Inc. (HOLX)
EARNINGS: 7/28/2021 (AMC) ** Reported Today **
Hologic, Inc. engages in the development, manufacture, and supply of diagnostics products, medical imaging systems, and surgical products dedicated to serve the healthcare needs of women. It operates through the following segments: Breast Health, Diagnostics, GYN Surgical, and Skeletal Health. The Breast Health segment includes a portfolio of solutions for breast cancer care for radiology, pathology, and surgery. The Diagnostics segment comprises products used to aid in the screening and diagnosis of human diseases. The GYN Surgical segment involves the NovaSure Endometrial Ablation System, the MyoSure Hysteroscopic Tissue Removal System, and the Fluent Fluid Management System. The Skeletal Health segment covers the Horizon DXA and the Fluoroscan Insight FD mini C-arm. The company was founded by S. David Ellenbogen and Jay A. Stein in 1985 and is headquartered in Marlborough, MA.
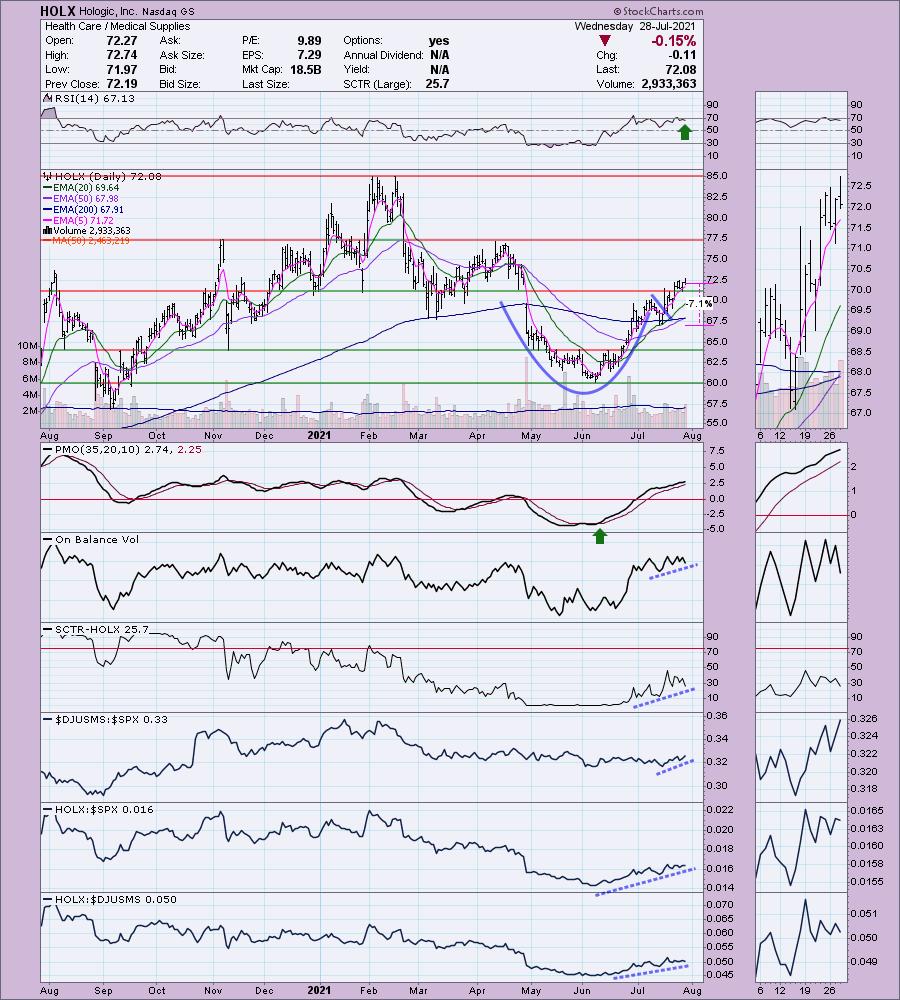
HOLX reported earnings today and they beat estimates by nearly 20%. It is currently up +0.58% in after hours trading. I covered HOLX back on October 28th 2020. The 6.8% stop was finally hit shortly after the big April gap down. However, it was up nearly 20% during the February highs.
I like it again. Price has broken out from a bullish cup and handle. We just got an Long-Term Trend Model "Golden Cross" BUY signal today. The RSI is positive and not overbought. I don't usually present stocks that have been on a PMO BUY signal for so long, but I don't think HOLX is done rising yet. The OBV is confirming this rally. Relative performance is strong against both the SPX and its strengthening industry group. You could actually set the stop a little tighter, just under the 200-EMA, but I opted to set it just below the March lows.
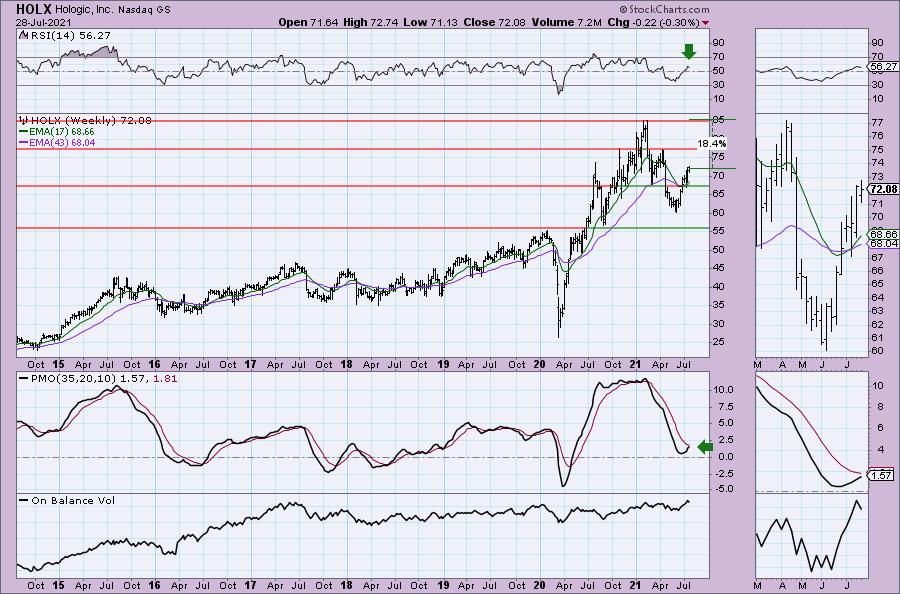
The weekly chart shows a "V" bottom pattern that suggests price should reach all-time highs. I love that the RSI just moved positive and the weekly PMO is readying for a crossover BUY signal.
Henry Schein, Inc. (HSIC)
EARNINGS: 8/3/2021 (BMO)
Henry Schein, Inc. engages in the provision of health care products and services to medical, dental, and veterinary office-based practitioners. It operates through the Healthcare Distribution, and Technology and Value-Added Services segments. The Healthcare Distribution segment includes consumable products, small equipment, laboratory products, large equipment, equipment repair services, branded and generic pharmaceuticals, vaccines, surgical products, diagnostic tests, infection-control products and vitamins. The Technology & Value-Added Services segment offers financial services on a non-recourse basis, e-services practice, technology, network and hardware services. The company was founded by Henry Schein and Esther Schein in 1932 and is headquartered in Melville, NY.
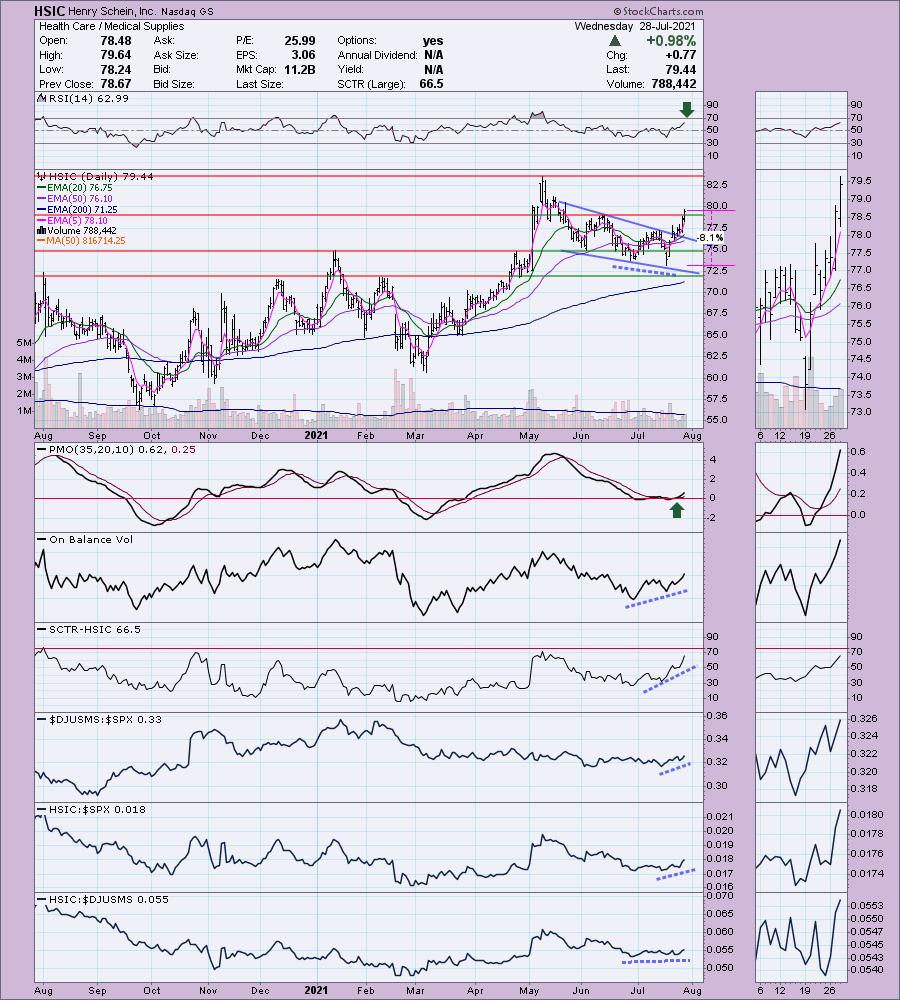
HSIC is unchanged in after hours trading. Price recently broke out from a bullish falling wedge. The RSI just moved into positive territory and the PMO just had a strong crossover BUY signal just above the zero line. There is a strong OBV positive divergence that led into this rally, suggesting it will continue higher. While relative performance isn't quite as strong as HOLX, it is still respectable. This is another you could tighten the stop on. I chose this one because it is just below the close from the July low.
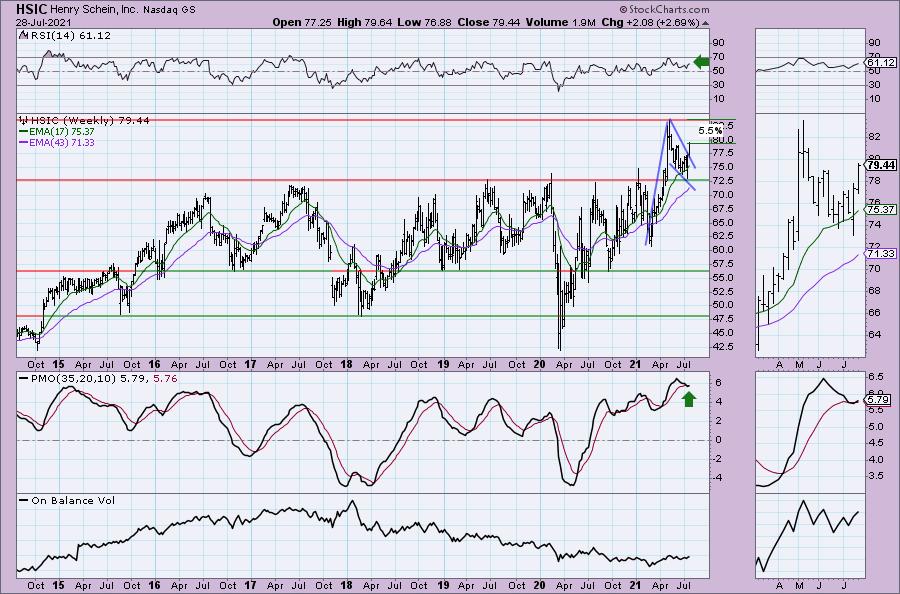
The weekly chart is very good. There is a bull flag that price is breaking out of. The RSI is positive and the weekly PMO has just whipsawed back into a crossover BUY signal. It's only about 5.5% away from its all-time high, but the bull flag suggests and upside target around $102.50 which is about a 29% upside gain if it hits it.
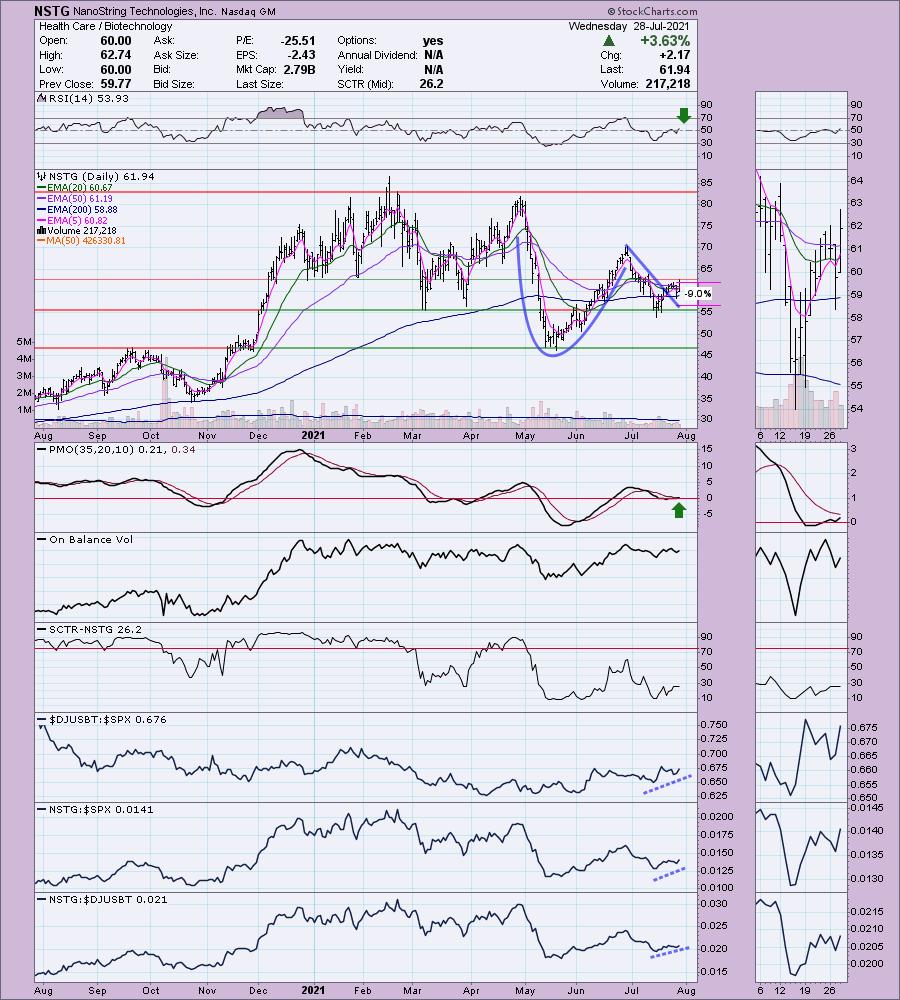
NanoString Technologies, Inc. (NSTG)
EARNINGS: 8/4/2021 (AMC)
NanoString Technologies, Inc. engages in the development and commercialization of instruments and services for profiling of genes and proteins from tissue sample. It offers the GeoMx Digital Spatial Profiler and nCounter Analysis System product platforms, both of which include instruments, related consumables, and software. The company was founded by Amber Ratcliffe, Krassen Dimitrov, and Dwayne Dunaway on June 20, 2003 and is headquartered in Seattle, WA.
NSTG is unchanged in after hours trading. There is a large bullish cup and handle pattern. Price is breaking out of the declining trend of the "handle". Today it had a ST Trend Model BUY signal when the 5-EMA crossed above the 20-EMA. The PMO has turned up just above the zero line and is going in for a crossover BUY signal. The RSI just reached positive territory. The SCTR could use some work, but it is rising. Relative performance is good. The stop is fairly deep. I set it just below the closing low from March.
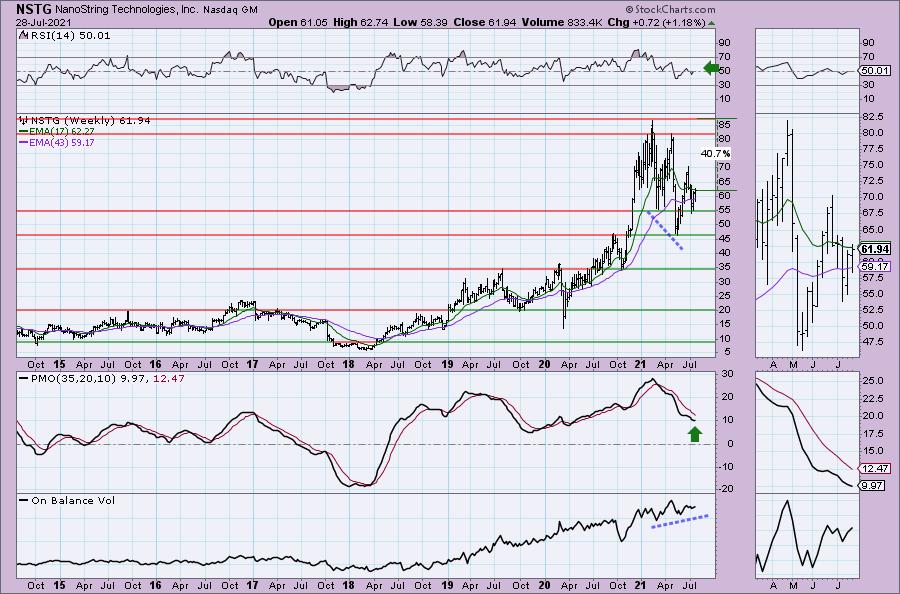
The weekly chart is improving. There was a positive OBV divergence that led into the previous rally but could still hold some power. The weekly PMO is still declining but appears to slowing its descent. The RSI just got positive. Upside potential is great.
Triumph Group, Inc. (TGI)
EARNINGS: 8/4/2021 (BMO)
Triumph Group, Inc. engages in the designing, engineering, manufacturing, repairing and overhauling of aerospace and defense systems, components and structures. It operates through the following three segments: Triumph Integrated Systems, Triumph Aerospace Structures and Triumph Product Support. The Triumph Integrated Systems segment engages in designing, development and supporting proprietary components, subsystems and systems, as well as production of complex assemblies using external designs. The Triumph Aerospace Structures segment engages in supplying of commercial, business, regional and military manufacturers with large metallic and composite structures and produce close-tolerance parts. The Triumph Product Support segment provides full life cycle solutions for commercial, regional and military aircraft. The company was founded by Richard C. Ill in 1993 and is headquartered in Berwyn, PA.
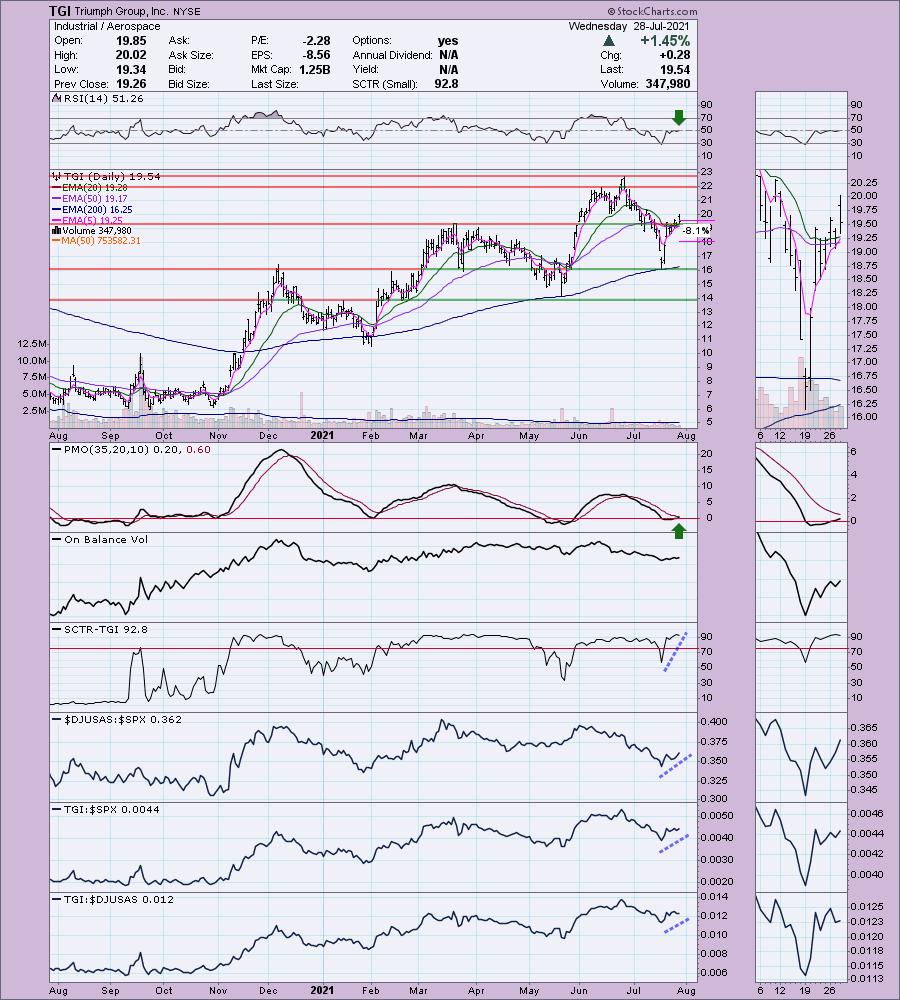
TGI is unchanged in after hours trading. As noted in the opening, there was something I can't quite put my finger on that kept dragging me back to this chart, so I decided to see what you think. Today's breakout above the March top was good. That also put price above all three of the fast moving EMAs. The 5-EMA is about ready to cross above the 20-EMA for a ST Trend Model BUY signal. This also looks like a "V" bottom. It has definitely retraced at least one-third of the decline into the pattern which suggests we will see a breakout above the June high. The RSI just hit positive territory and the PMO is going in for an oversold crossover BUY signal just above the zero line. It has a first-rate SCTR and relative performance is very good. The stop was set somewhat capriciously at my preferred 8% level. It was too tight at the March high and too deep at the bottom of the "V".
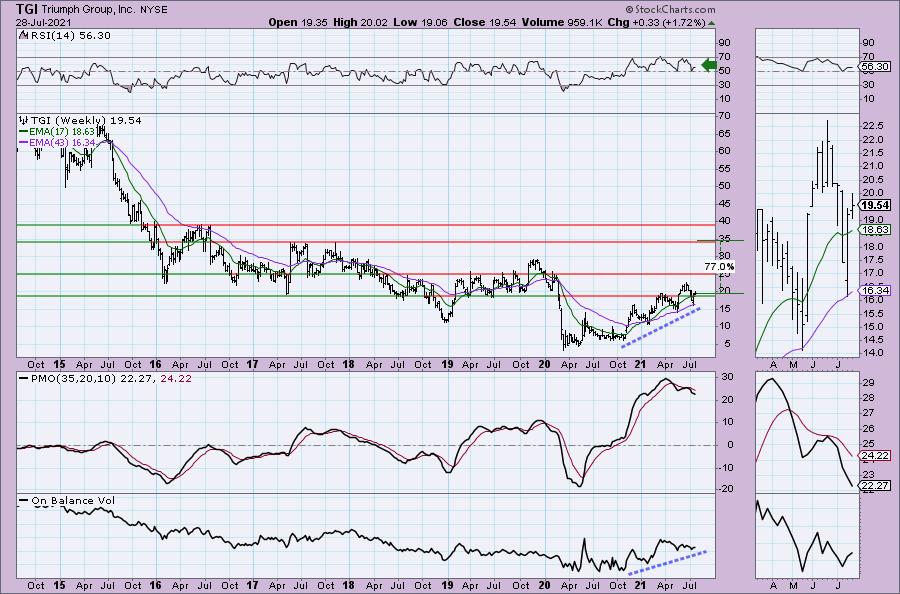
The weekly chart isn't that great, but it isn't that terrible. The RSI is staying above net neutral (50). Price is on a rising trend and hugging the 43-week EMA. The OBV is confirming the rally. The PMO, however, is quite ugly. We have a top below the signal line and it is continuing lower. You'll want to babysit this if you're going for an intermediate-term trade. I have a 77% upside target, but if it passes the 2019 top, I'd be perfectly happy to cash in.
"Under the Hood" Indicators
My webinar last week on "Under the Hood" Indicators at the Synergy Traders event was a success. I was able to get links to the recordings for BOTH days. You'll find my presentation in the second link. I was the last presenter.
Day 1 of Synergy Traders "Favorite Indicators" educational webinar event LINK.
Day 2 of Synergy Traders "Favorite Indicators" educational webinar event with Erin's webinar LINK.
"Simple Indicators to Improve Stock Selection & Timing"
I have another free seminar coming up on August 3rd, 2021 with Festival of Traders! My presentation will be at 6:40p ET. If you can't make it, register and you'll receive the recording! Your support is always appreciated! More details to follow.
Don't forget, on Thursdays I look at reader-requested symbols, so shoot me an email at erin@decisionpoint.com. I read every email I receive and try to answer them all!
Current Market Outlook:
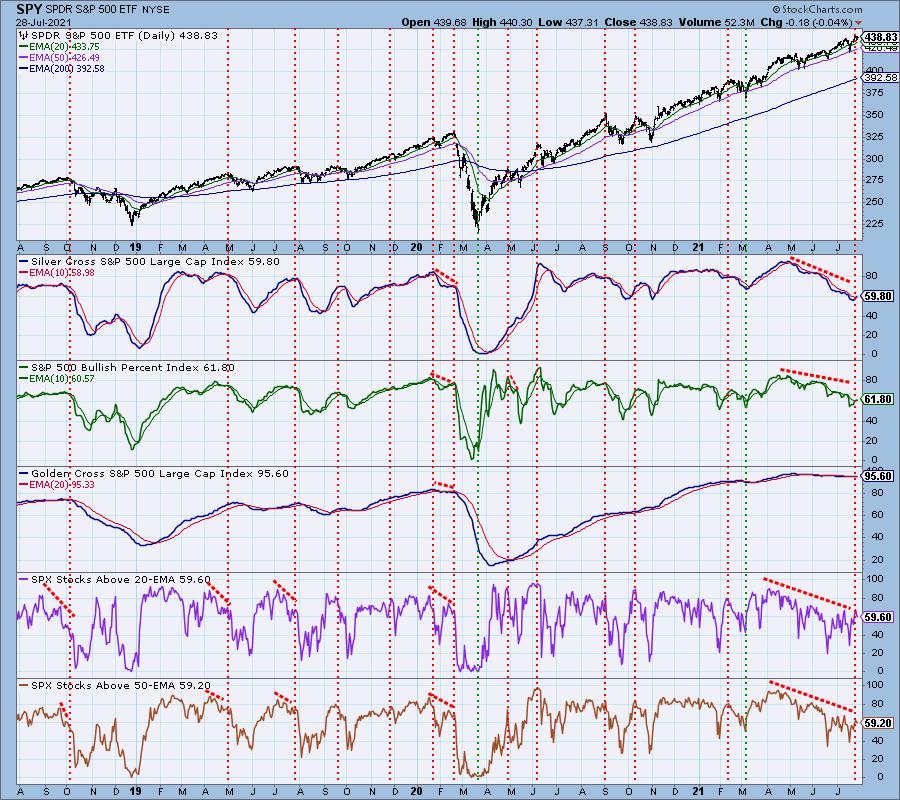
Market Environment: It is important to consider the odds for success by assessing the market tides. The following chart uses different methodologies for objectively showing the depth and trend of participation for intermediate- and long-term time frames.
- The Silver Cross Index (SCI) shows the percentage of SPX stocks on IT Trend Model BUY signals (20-EMA > 50-EMA)
- The Golden Cross Index (GCI) shows the percentage of SPX stocks on LT Trend Model BUY signals (50-EMA > 200-EMA)
- The Bullish Percent Index (BPI) shows the percentage of SPX stocks on Point & Figure BUY signals.
Don't forget that as a "Diamonds" member, you have access to our GCI/SCI curated ChartList on DecisionPoint.com. You'll find it under "Members Only" links on the left side on the Blogs and Links Page.
Here is the current chart:
Full Disclosure: I'm about 40% invested and 60% is in 'cash', meaning in money markets and readily available to trade with.
Technical Analysis is a windsock, not a crystal ball.
Happy Charting!
- Erin
erin@decisionpoint.com
Watch the latest episode of DecisionPoint with Carl & Erin Swenlin on Mondays 7:00p EST or on the DecisionPoint playlist on the StockCharts TV YouTube channel here!
NOTE: The stocks reported herein are from mechanical trading model scans that are based upon moving average relationships, momentum and volume. DecisionPoint analysis is then applied to get five selections from the scans. The selections given should prompt readers to do a chart review using their own analysis process. This letter is not a call for a specific action to buy, sell or short any of the stocks provided. There are NO sure things or guaranteed returns on the daily selection of "Diamonds in the Rough."
Helpful DecisionPoint Links:
DecisionPoint Shared ChartList and DecisionPoint Chart Gallery
Price Momentum Oscillator (PMO)
Swenlin Trading Oscillators (STO-B and STO-V)
For more links, go to DecisionPoint.com