
I discussed that Utilities (XLU) was the sector to watch going into this week while we were in Friday's Diamond Mine trading room. I decided to focus on this sector today for our "Diamonds in the Rough", particularly finding stocks with new momentum and with RSIs that were positive and not overbought. All of these stocks look good seasonally going into July and August. You can look at the "seasonality" using the StockCharts Seasonality tool. You'll find a link to it under the "Charts & Tools" tab. Be sure to extend the sample size to get a true picture.
I am pleased with today's selections in Utilities. I presented AGR yesterday on the DecisionPoint Show. All of today's "Diamonds in the Rough" have a 3%+ yield. My sense is that Energy and Healthcare will perform well given Crude Oil and Biotechs are outperforming. I'll be keeping my selections this week in these areas as I prepare to play defense.
The market is acting toppy and with the Fed under more scrutiny than usual, news could finally bring this house of cards down. On the other hand, if the news is considered favorable to the market, a decline could be staved off this week, but don't look for any rocket rallies, the market is weak.
Take a good look at your positions and determine if it is time to take some profits or set a tighter stop. It's DecisionPoint's job to keep you apprised when the storm clouds are gathering. I'd say in weather terms we are moving from a storm "watch" to a storm "warning".
Today's "Diamonds in the Rough" are: AGR, EIX, NRG and VST.
Stocks/ETFs to Review (no order): AES, EXC, NI, OGS, PCG and POR.
** UPCOMING VACATION - June 28th to July 9th **
It's that time of year again! Last year it was a road trip to Alabama and back, this year it is a road trip to Utah and back! We plan on dropping in Las Vegas, Zion, Spanish Fork, Bryce Canyon, back to the Grand Canyon, Bull Head City and finally back home. I'll include my travel diary and pictures just like last year for Diamonds readers!
I plan on writing, but trading rooms will be postponed until I return home. Blog articles may be delayed depending on WIFI service and/or our travel for the day. You'll miss two Diamond Mines (I'll make them up in the coming weeks).
 Diamond Mine REGISTRATION Information:
When: Jun 18, 2021 09:00 AM Pacific Time (US and Canada)
Topic: DecisionPoint Diamond Mine (06/18/2021) LIVE Trading Room
Register in advance for the Diamond Mine HERE.
After registering, you will receive a confirmation email containing information about joining the webinar, including the password. SAVE IT! Zoom doesn't always send out the reminders.
=======================================================================
Diamond Mine RECORDING Link:
Topic: DecisionPoint Diamond Mine (6/11/2021) LIVE Trading Room
Start Time : Jun 11, 2021 08:59 AM
Diamond Mine Recording Link.
Access Passcode: June-11th
***Click here to register for this recurring free DecisionPoint Trading Room on Mondays at Noon ET!***
+++++++++++++++++++++++++++++++++++++++++++++++++++++++++++++++++++++++++++++++
Free DP Trading Room RECORDING LINK:
Topic: DecisionPoint Trading Room
Start Time : Jun 14, 2021 09:00 AM
Free Trading Room Recording Link
Access Passcode: June/14th
For best results, copy and paste the access code to avoid typos.
Welcome to DecisionPoint Daily Diamonds, wherein I highlight five "diamonds in the rough." These are selected from the results of my DecisionPoint scans, which search for stocks that could benefit from the trend and condition of the market. Remember, these are not recommendations to buy or sell, but are the most interesting of the stocks that surfaced in my scans. My objective is to save you the work of the initial, tedious culling process, but you need to apply your own analysis to see if these stocks pique your interest as well. There are no guaranteed winners here!
Avangrid, Inc. (AGR)
EARNINGS: 7/20/2021 (AMC)
Avangrid, Inc. engages in the energy transmission and gas distribution. It operates through the following segments: Networks, Renewables, and Other. The Networks segment includes energy transmission and distribution, electric transmission, and gas distribution activities. The Renewables segment relating to renewable energy, mainly wind energy generation and trading related with such activities. The Other segment covers miscellaneous corporate revenues including intersegment eliminations. The company was founded in 1852 and is headquartered in Orange, CT.
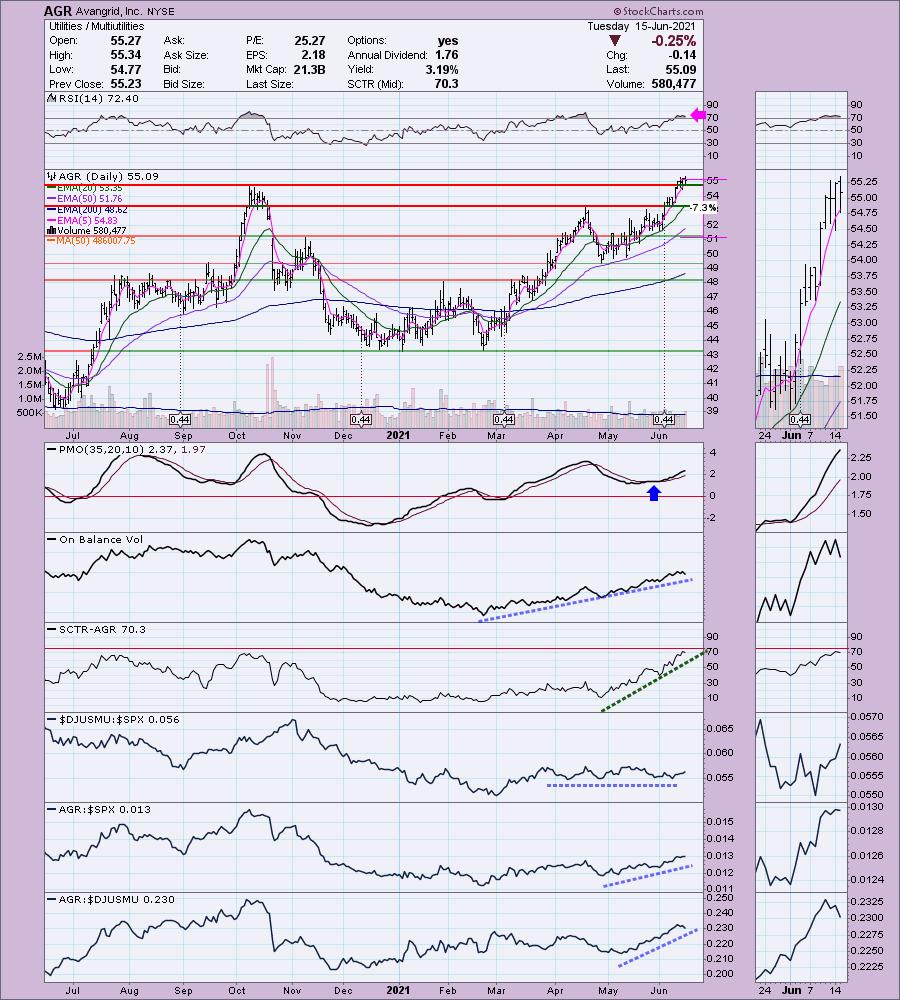
AGR is unchanged in after hours trading. This 3.19% yielder broke out last week and is now consolidating that move. It may consolidate a bit longer given that the RSI is overbought right now. The PMO is on a BUY signal and isn't overbought. The OBV has been confirming this rally since late February. The Multiutilities are just beginning to outperform, but AGR has been outperforming since May. I do note that this past week it is underperforming its group, but I still like the chart.
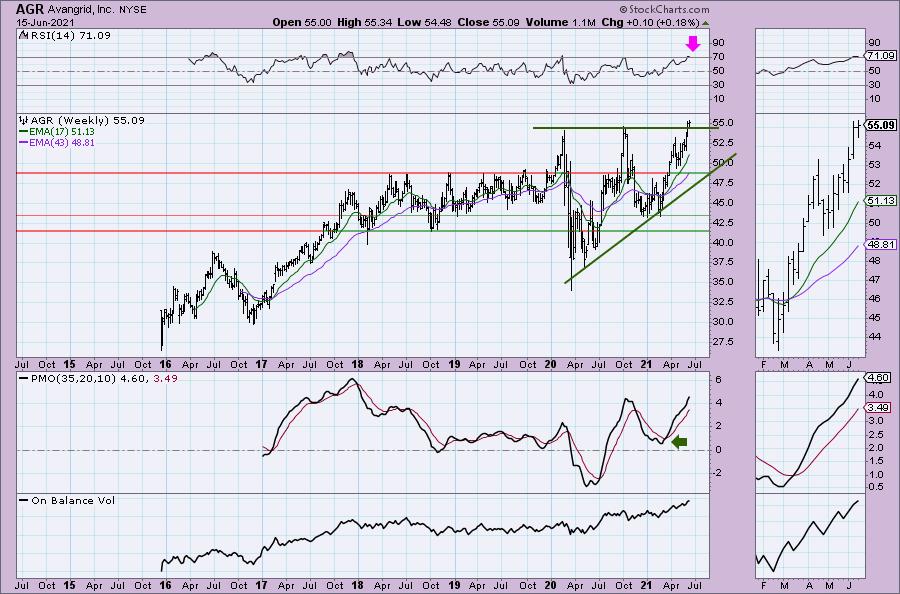
I really like the weekly chart with its breakout from a bullish ascending triangle. The overbought RSI could be a problem, but as I mentioned earlier, if we get some consolidation that will relieve that overbought condition.
Edison Intl, Inc. (EIX)
EARNINGS: 7/27/2021 (AMC)
Edison International is a renewable energy company, which through its subsidiaries, generates and distributes electric power, and invests in energy services and technologies. The company was founded on July 4, 1886 and is headquartered in Rosemead, CA.
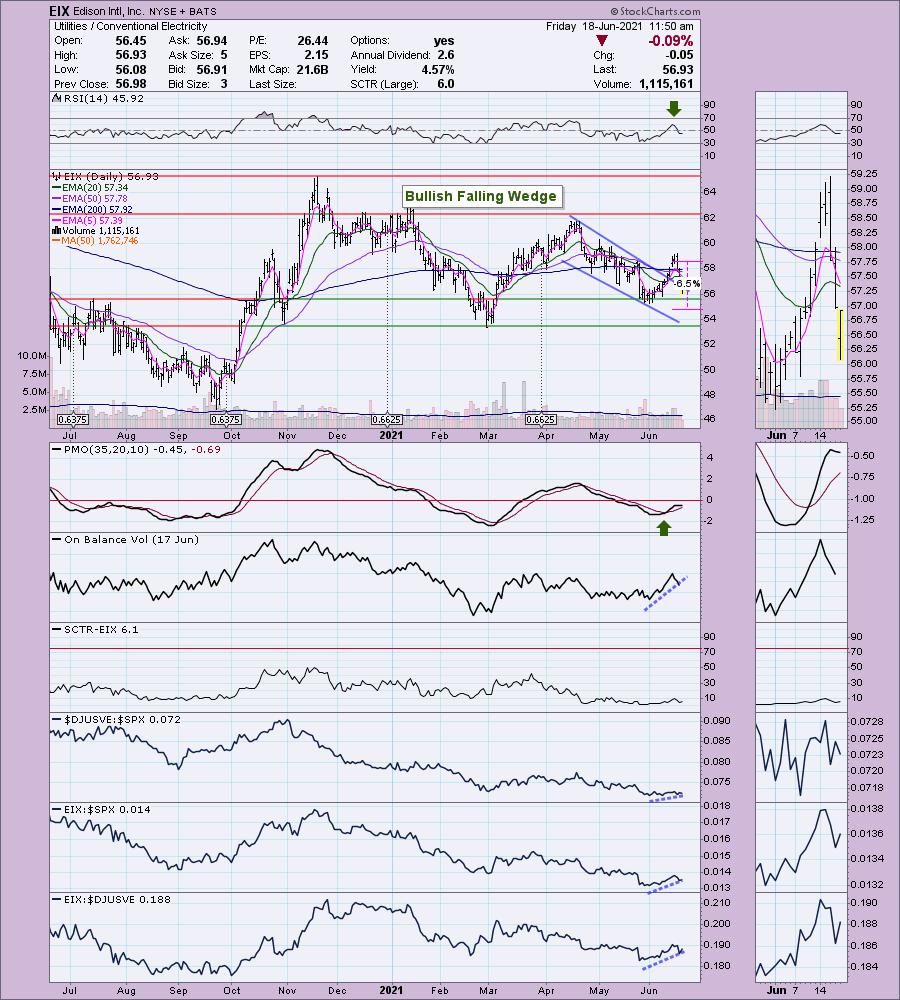
EIX is down -0.15% in after hours trading. I covered EIX in the March 4th 2021 Diamonds Report. The stop was never hit, but after enduring the extended decline in April and May, it is only up 2.75% since then. At the April top, the position was us a modest 8%+. It has now broken out from a bullish falling wedge. Additionally it has broken above all four EMAs. The PMO is on a strong crossover BUY signal and the RSI is positive. The OBV is confirming the current rally. It is outperforming the SPX and its industry group which is beginning to wake up. You can set a tight stop and still be well below the May support.
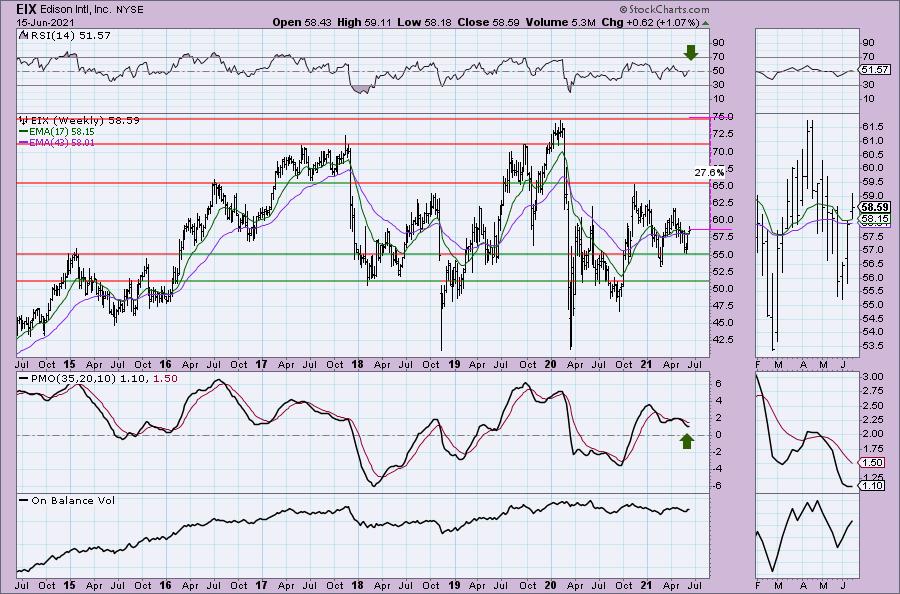
The weekly chart shows a stock that is reversing. The weekly RSI is now positive and the weekly PMO is turning back up. Upside potential is pretty good for a Utility stock.
NRG Energy Inc. (NRG)
EARNINGS: 8/5/2021 (BMO)
NRG Energy, Inc. engages in the production, sale, and distribution of energy and energy services. It operates through the following segments: Generation, Retail, and Corporate. The Generation segment includes all power plant activities, domestic and international, as well as renewables. The Retail segment includes mass customers and business solutions, and other distributed and reliability products. The Corporate segment includes residential solar and electric vehicle services. The company was founded in 1989 and is headquartered in Princeton, NJ.
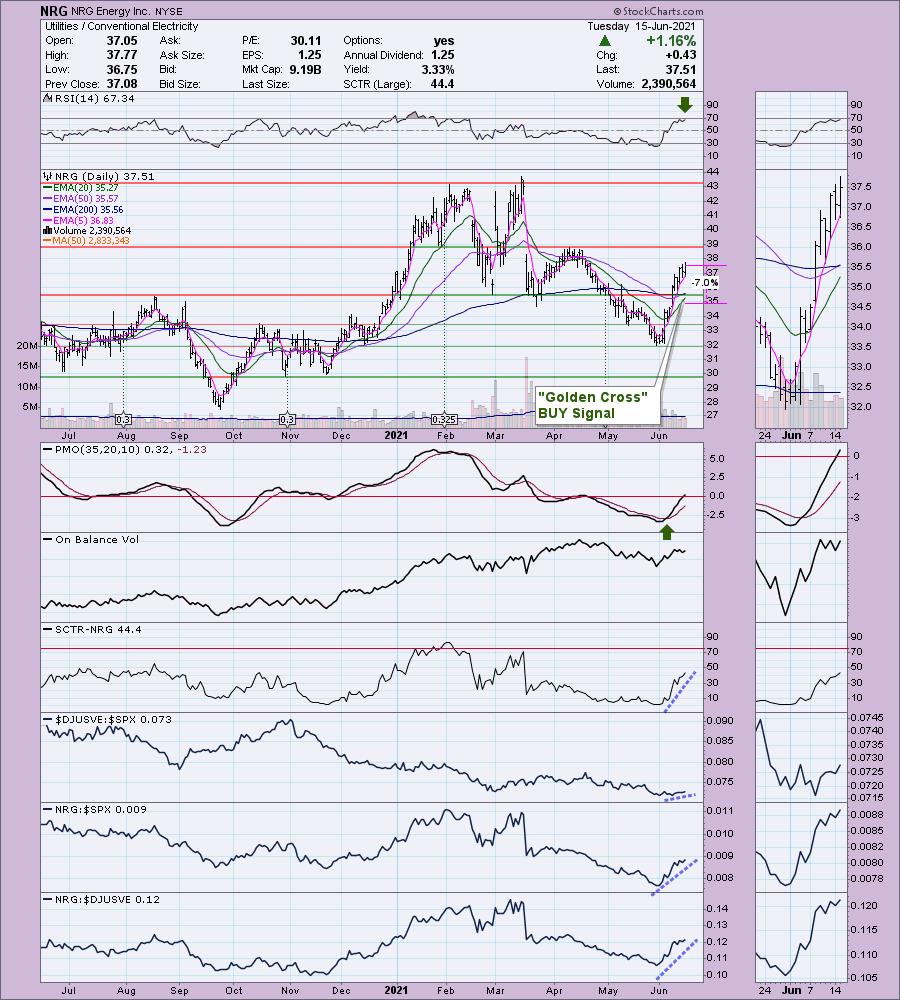
NRG is down -0.67% in after hours trading which means a good entry is likely tomorrow. I would've liked to have presented this one earlier, but at this point it is really looking good for a continuation of the already powerful rally. The RSI is positive and is avoiding overbought territory. The PMO is on a BUY signal and has just moved into positive territory. The SCTR is jumping higher. It is a clear out-performer in every way. There is a LT Trend Model "Golden Cross" BUY signal that just triggered when the 50-EMA crossed above the 200-EMA and there is an IT Trend Model "Silver Cross" BUY signal that is setting up as the 20-EMA strides toward the 50-EMA for a positive crossover or "Silver Cross". The stop is reasonable and is lined up with the March low.
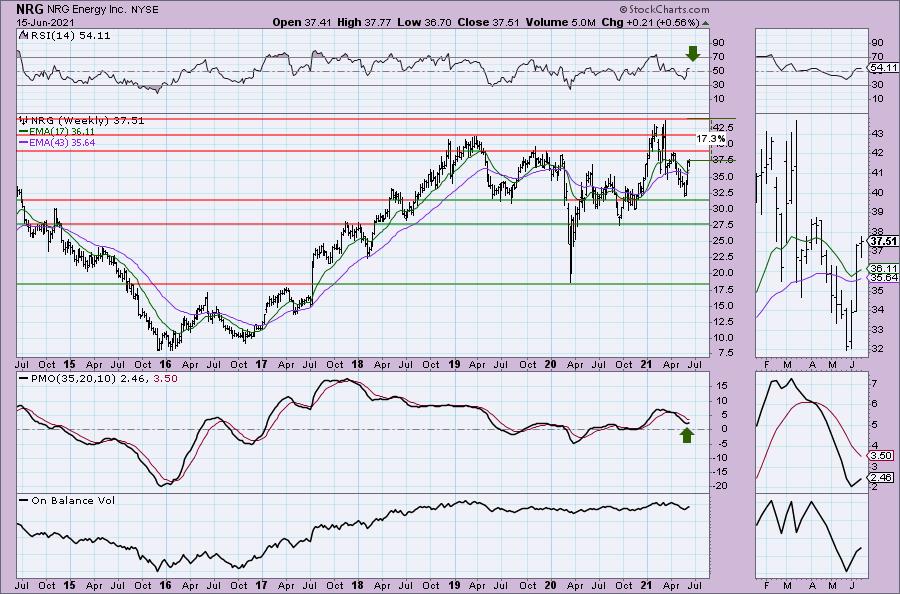
The weekly chart shows a sharply rising weekly PMO and a newly positive weekly RSI. The upside potential is good at 17%.
Vistra Energy Corp. (VST)
EARNINGS: 8/5/2021 (BMO)
Vistra Corp. is an energy company, which engages in the provision of electricity and power generation. It operates through the following segments: Retail, Texas, East, West, Sunset and Asset Closure. The Retail segment sells electricity and natural gas to residential, commercial and industrial customers. The Texas and East segments engages in electricity generation, wholesale energy sales and purchases, commodity risk management activities, fuel production and fuel logistics management. The West segment represents Vistra's electricity generation operations in CAISO. The Sunset segment consists of generation plants with announced retirement plans. The Asset Closure segment is engaged in the decommissioning and reclamation of retired plants and mines. The company was founded in 1882 and is headquartered in Irving, TX.
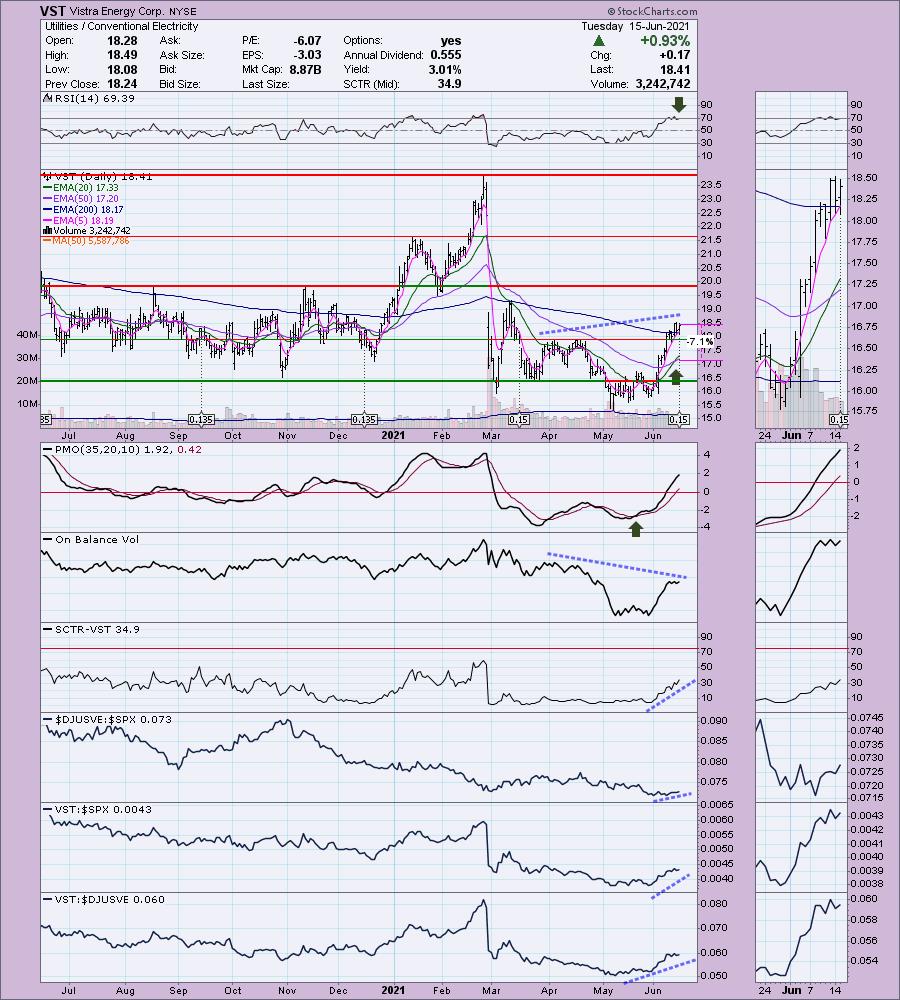
VST is unchanged in after hours trading. The RSI is moving out of overbought territory with little to no price damage. The PMO is rising strongly on a crossover BUY signal and is far from being overbought. The SCTR is improving. There is a negative divergence with the OBV, so the chart isn't perfect. It is performing well. I set the stop at the December low at a reasonable 7%.
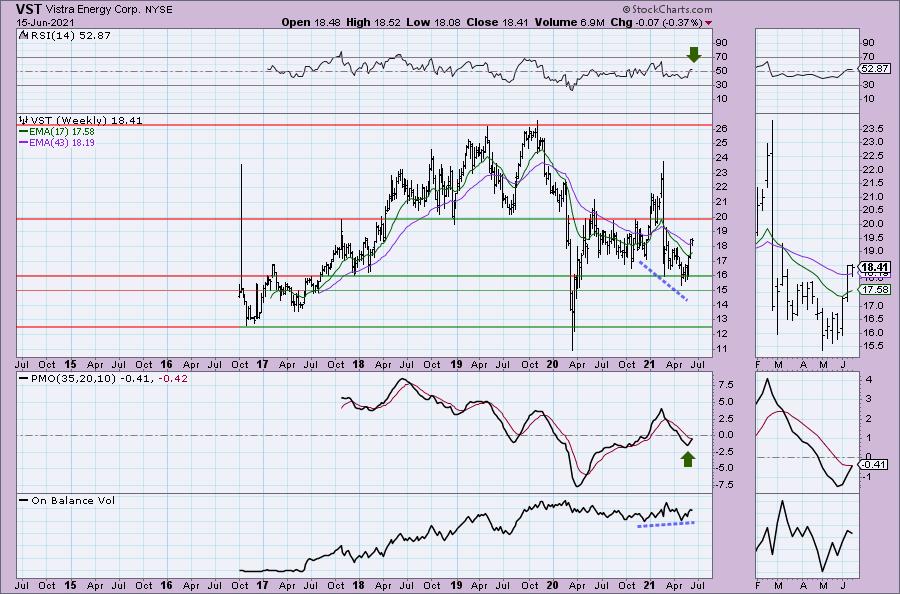
The weekly chart looks good and it actually has a positive OBV divergence. The weekly PMO has just given us a crossover BUY signal and the weekly RSI just hit positive territory.
Don't forget, on Thursdays I look at reader-requested symbols, so shoot me an email at erin@decisionpoint.com. I read every email I receive and try to answer them all!
Current Market Outlook:
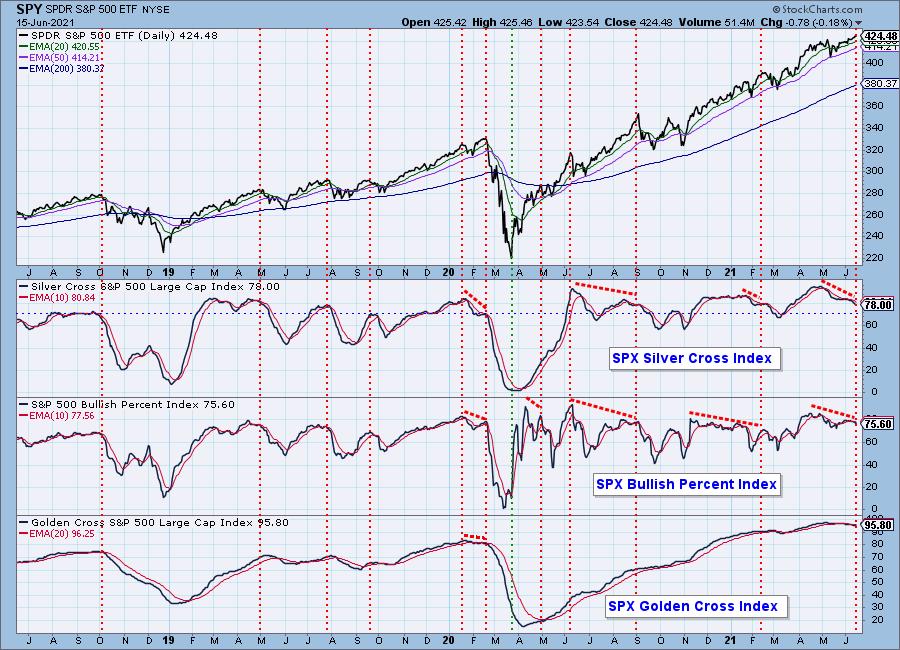
Market Environment: It is important to consider the odds for success by assessing the market tides. The following chart uses different methodologies for objectively showing the depth and trend of participation for intermediate- and long-term time frames.
- The Silver Cross Index (SCI) shows the percentage of SPX stocks on IT Trend Model BUY signals (20-EMA > 50-EMA)
- The Golden Cross Index (GCI) shows the percentage of SPX stocks on LT Trend Model BUY signals (50-EMA > 200-EMA)
- The Bullish Percent Index (BPI) shows the percentage of SPX stocks on Point & Figure BUY signals.
Don't forget that as a "Diamonds" member, you have access to our GCI/SCI curated ChartList on DecisionPoint.com. You'll find it under "Members Only" links on the left side on the Blogs and Links Page.
Here is the current chart:
Diamond Index:
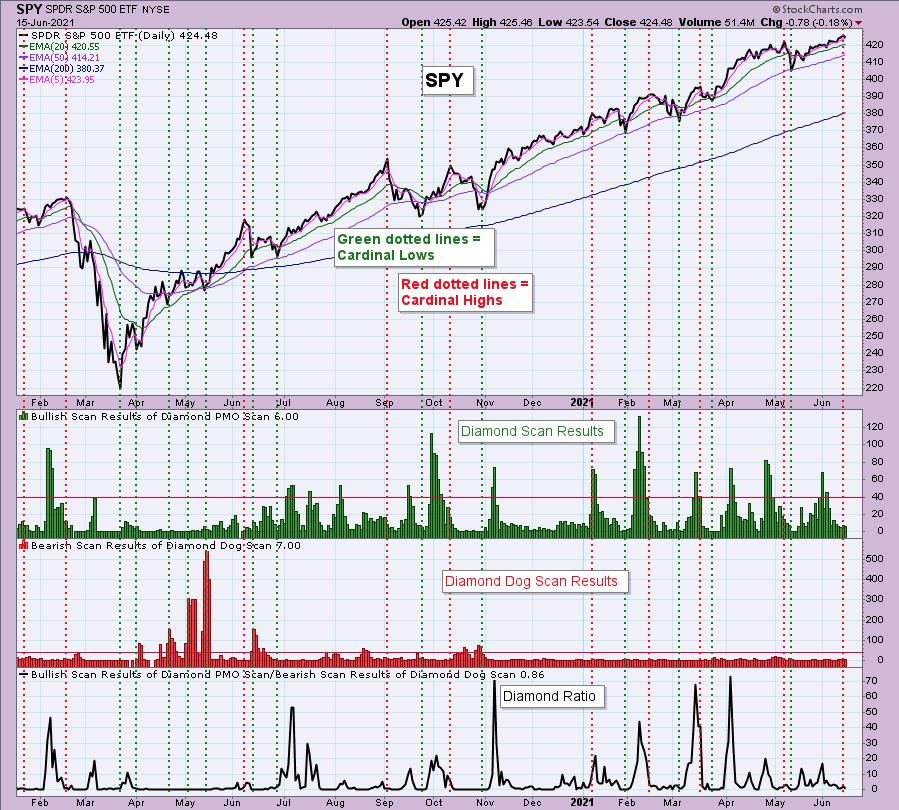
The Diamond Index chart looks at the number of scan results from my bullish Diamond PMO Scan and the number of scan results from the inverse Diamond Dog Scan. The Diamond Ratio divides the bullish results by the bearish results.
I only have data going back to October 2019 so I won't make any sweeping conclusions about the Diamond Index chart. I have marked cardinal tops with red dotted vertical lines and cardinal price bottoms with green dotted vertical lines. I believe that when the Diamond Dog results spike, it usually comes at a price bottom, or marks a strong continuation of the rising trend.
Unfortunately, the Diamond PMO Scan result numbers aren't providing much insight. The Diamond Ratio has promise, but again I don't see a clear correlation to the market tops/bottoms right now. I need to study and manipulate the data some more. Keep you posted!
Full Disclosure: I'm about 60% invested and 40% is in 'cash', meaning in money markets and readily available to trade with. Added KMX to my portfolio and looking to add one or two of the recent Utility Diamonds in the Rough.
Technical Analysis is a windsock, not a crystal ball.
Happy Charting!
- Erin
erin@decisionpoint.com
Watch the latest episode of DecisionPoint with Carl & Erin Swenlin on Mondays 7:00p EST or on the DecisionPoint playlist on the StockCharts TV YouTube channel here!
NOTE: The stocks reported herein are from mechanical trading model scans that are based upon moving average relationships, momentum and volume. DecisionPoint analysis is then applied to get five selections from the scans. The selections given should prompt readers to do a chart review using their own analysis process. This letter is not a call for a specific action to buy, sell or short any of the stocks provided. There are NO sure things or guaranteed returns on the daily selection of "diamonds in the rough."
Helpful DecisionPoint Links:
DecisionPoint Shared ChartList and DecisionPoint Chart Gallery
Price Momentum Oscillator (PMO)
Swenlin Trading Oscillators (STO-B and STO-V)
For more links, go to DecisionPoint.com
