
The chat was lively in the Diamond Mine this morning with plenty of interesting symbol requests. The recording is below. Our "Diamonds in the Rough" performed better than the SPY which is always nice, especially when the SPY is higher on the week!
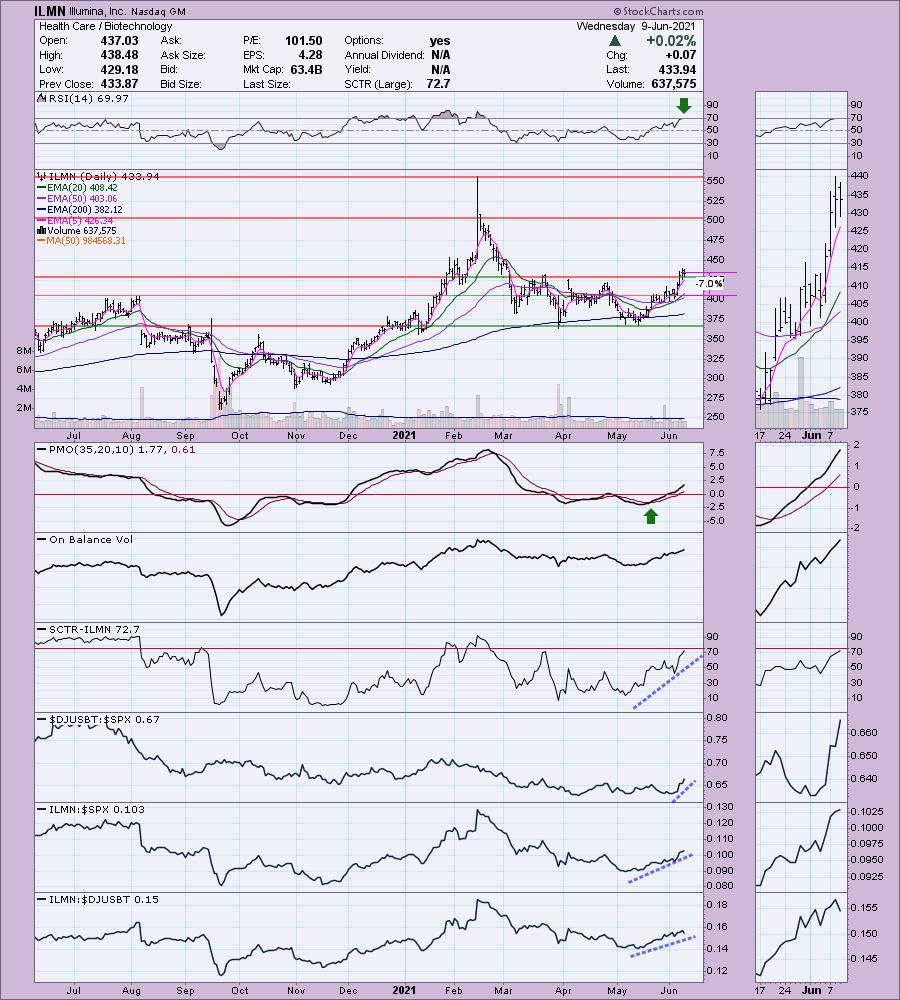
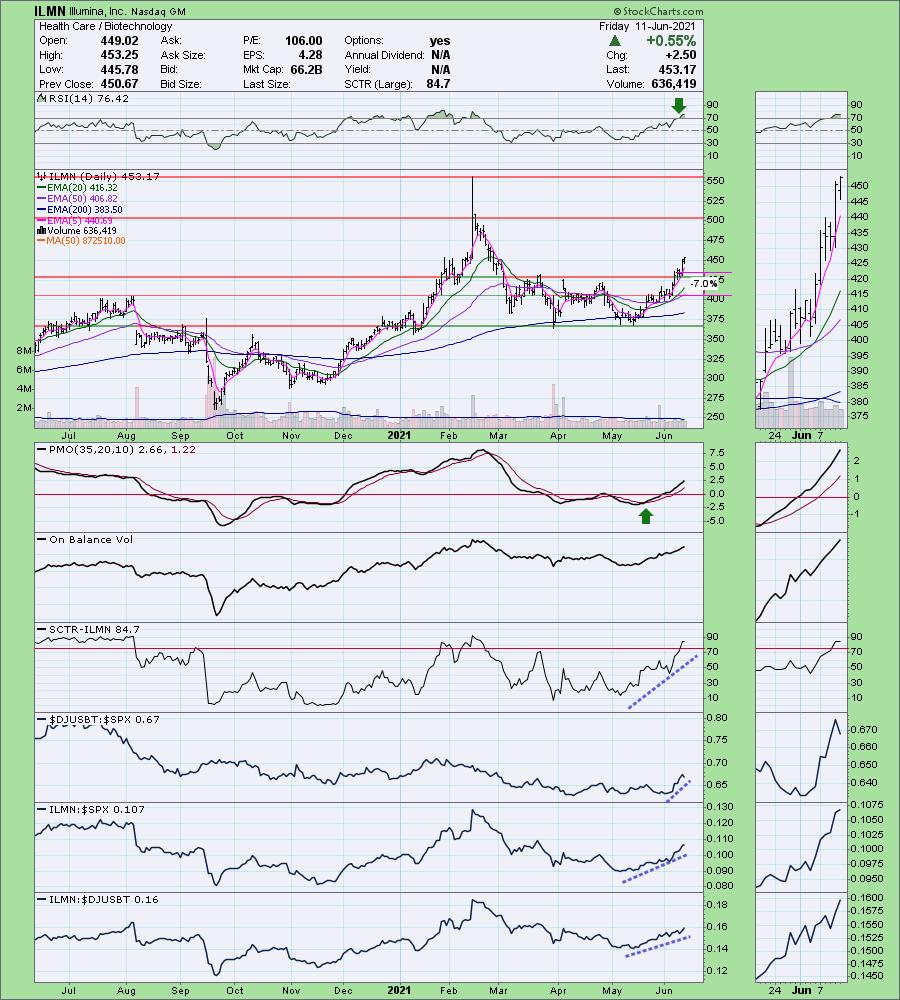
Biotechs shined bright this week so it wasn't a surprise to see our "Darling" or best "Diamond in the Rough" come from that industry group. Illumina (ILMN) performed quite well, up +4.43% since I picked it on Tuesday. I also brought two Biotechs to the table yesterday, one a reader request and one of my own. Both CERT and NVAX look very good moving forward.
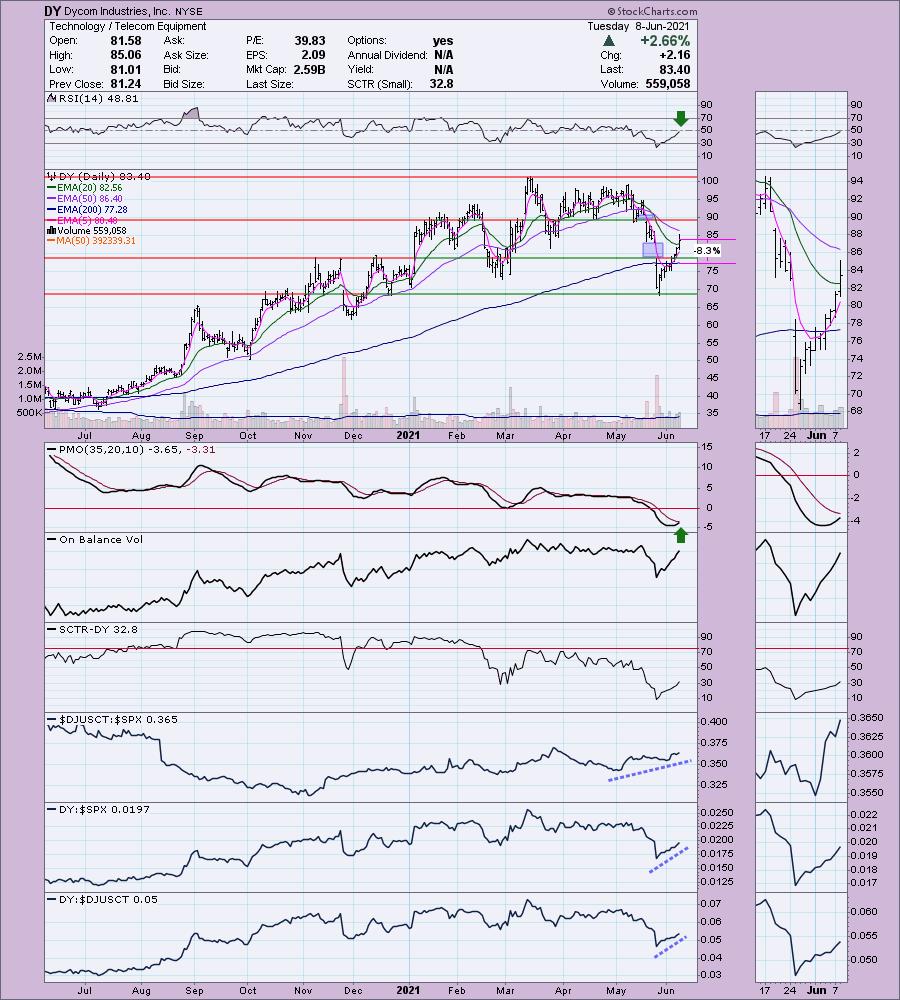
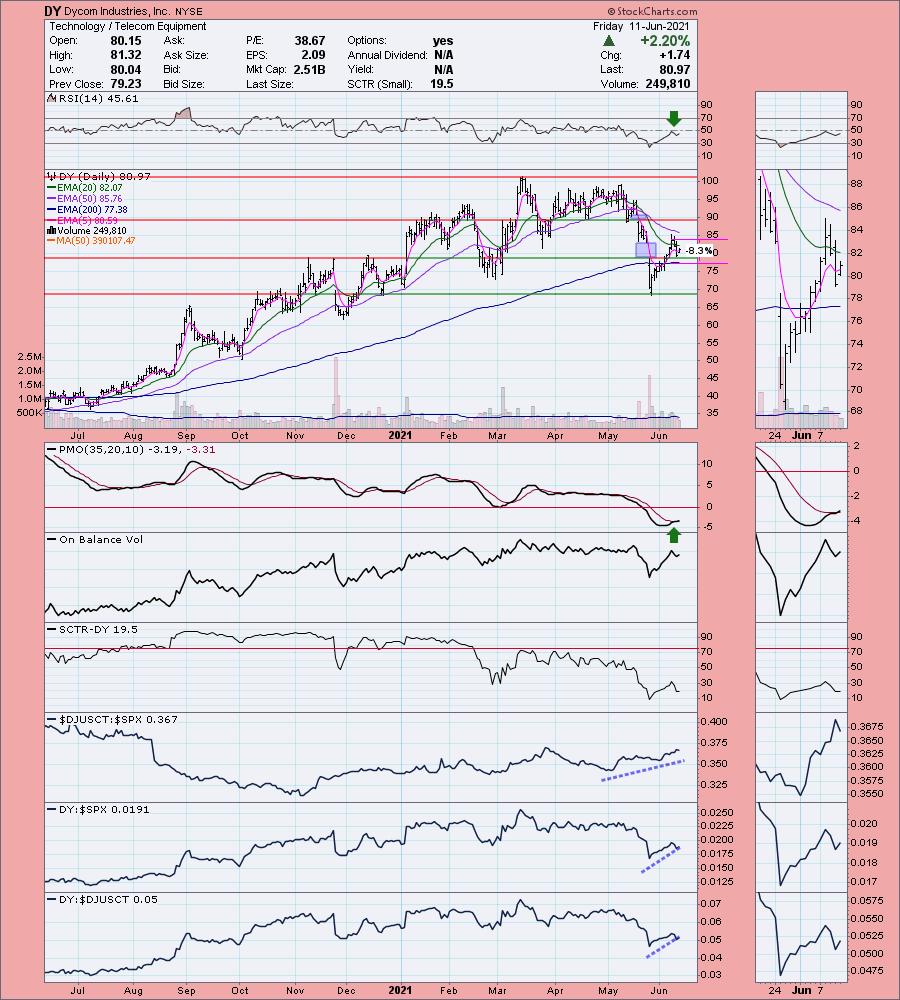
The biggest loser, Dycom (DY) decided to digest its recent rally after I picked it. The chart still has merit.
I talked up FOSL on Tuesday and while it is down for the week, if you'd bought like I did on the buy point Wednesday, you'd be up at least 1.5%.
Register now for next week's Diamond Mine trading room on June 18th at this link or below.
(Full Disclosure: Of this week's Diamonds, I own FOSL)
** UPCOMING VACATION - June 28th to July 9th **
It's that time of year again! Last year it was a road trip to Alabama and back, this year it is a road trip to Utah and back! We plan on dropping in Las Vegas, Zion, Spanish Fork, Bryce Canyon, back to the Grand Canyon, Bull Head City and finally back home. I'll include my travel diary and pictures just like last year for Diamonds readers!
I plan on writing, but trading rooms will be postponed until I return home. Blog articles may be delayed depending on WIFI service and/or our travel for the day. You'll miss two Diamond Mines (I'll make them up in the coming weeks).
Diamond Mine Information:
RECORDING LINK:
Topic: DecisionPoint Diamond Mine (6/11/2021) LIVE Trading Room
Start Time : Jun 11, 2021 08:59 AM
Meeting Recording Link.
Access Passcode: June-11th
REGISTRATION:
When: Jun 18, 2021 09:00 AM Pacific Time (US and Canada)
Topic: DecisionPoint Diamond Mine (06/18/2021) LIVE Trading Room
Register in advance for this webinar HERE.
Save the registration confirmation email with login instructions in case Zoom doesn't notify you in time.
A few items about the spreadsheet: I decided it only fair to denote "reader requests" as I shouldn't get to take credit if they turn out great! I've put on the spreadsheet whether the RSI is positive (green) or negative (red). The PMO column tells you if it is rising (green) or falling (red). Finally I've added my own "Sparkle Factor" that gives you my assessment going forward, bullish (green), bearish (red) or neutral (gray). The Sparkle Factor is basically my thoughts on whether I expect it to rise or fall. A neutral means it could really go either way so it could be added to a watch list. If you're in a stock I consider "neutral" going forward, the ball is in your court.
Free DP Trading Room RECORDING LINK:
Topic: DecisionPoint Trading Room
Start Time : Jun 7, 2021 09:00 AM
Meeting Free Trading Room Recording Link.
Access Passcode: June-7th
For best results, copy and paste the access code to avoid typos.
Darling:
Illumina, Inc. (ILMN)
EARNINGS: 8/5/2021 (AMC)
Illumina, Inc. engages in the development, manufacturing, and marketing of life science tools and integrated systems for large-scale analysis of genetic variation and function. It operates through Core Illumina segment, which serves customers in the research, clinical and applied markets, and enable the adoption of a variety of genomic solutions. The firm's products include instruments, kits and reagents, selection tools, and software and analysis. Its services include sequencing and microarray services; proactive instrument monitoring; and instrument services, training, and consulting. The company was founded by David R. Walt, John R. Stuelpnagel, Anthony W. Czarnik, Lawrence A. Bock, and Mark S. Chee in April 1998 and is headquartered in San Diego, CA.
Below is the chart and commentary from Wednesday (6/9):
"ILMN is down -0.01% in after hours trading. I was surprised I hadn't covered this one before. It's not as volatile as many of the biotechs out there. We have a nice breakout from a trading range. The breakout occurred Monday and price has held above support today and yesterday. The RSI is on the overbought side so we should be aware of that. The PMO is on an oversold BUY signal and has now reached positive territory. There was a recent IT Trend Model "Silver Cross" BUY signal when the 20-EMA crossed above the 50-EMA. The OBV is confirming the rally and the SCTR is almost in the "hot zone" above 75, meaning it is in the upper quartile among all large-cap stocks. Outperformance is clear. I like that you can set a reasonable 7% stop."
Here is today's chart:
The biggest flaw is the overbought RSI which is flattening out. ILMN needs to consolidate Thursday's breakout. It began to today, I still love this Biotech and you can tighten the stop more too. The SCTR is now in the "hot zone" above 75, meaning it is in the top quartile among its peers in the large-cap "universe". Also regarding the SCTR, the calculations are heavily based on intermediate- and long-term indicators.
Don't forget, on Thursdays I look at reader-requested symbols, so shoot me an email at erin@decisionpoint.com. I read every email I receive and try to answer them all!
Dud:
Dycom Industries, Inc. (DY)
EARNINGS: 8/25/2021 (BMO)
Dycom Industries, Inc. provides contracting services throughout the United States. Its services include engineering, construction, maintenance and installation services to telecommunications providers, underground facility locating services to various utilities, including other construction and maintenance services to electric and gas utilities, and others. The company was founded in 1969 and is headquartered in Palm Beach Gardens, FL.
Below is the chart and commentary from Tuesday (6/8):
"DY is up +0.72% in after hours trading. I covered DY in the October 14th 2020 Diamonds Report. I didn't put a stop on the chart, but an 8% stop wouldn't have triggered even on the big gap down in November. This means that the position is up +26.7%. The end of May was killer for DY, but it is retracing the decline rapidly. The first of two gaps has now been covered. Today's rally pushed DY above the 20-EMA. The PMO had already begun to curl upward. The RSI isn't positive yet, but it is on its way. The industry group is outperforming the SPX and DY is outperforming both. The stop is set below the gap, right around the 200-EMA at $77.28."
Below is today's chart:
While a lot of things went wrong on this chart, but everything still looks bullish, especially after today's strong rally. A short-term flag has formed. The PMO had a positive crossover today. The RSI is still negative, but it is rising again. The timing was just off for it to look good this week. However, if we revisit this chart later, I expect that flag will have resolved upward and we'll be challenging the highs from April and May.
THIS WEEK's Sector Performance: 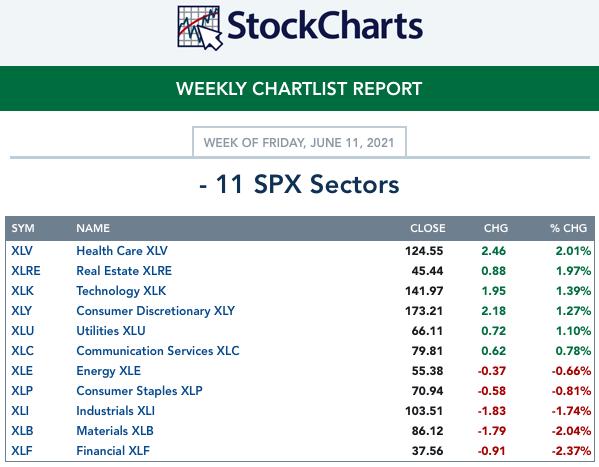
DecisionPoint Sector Scoreboard (Mechanical Trend Model Signals):
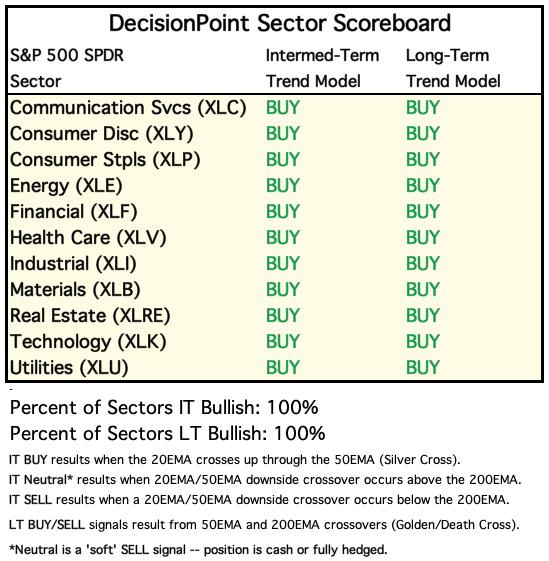
Click Here to view Carl's annotated Sector ChartList!
CONCLUSION:
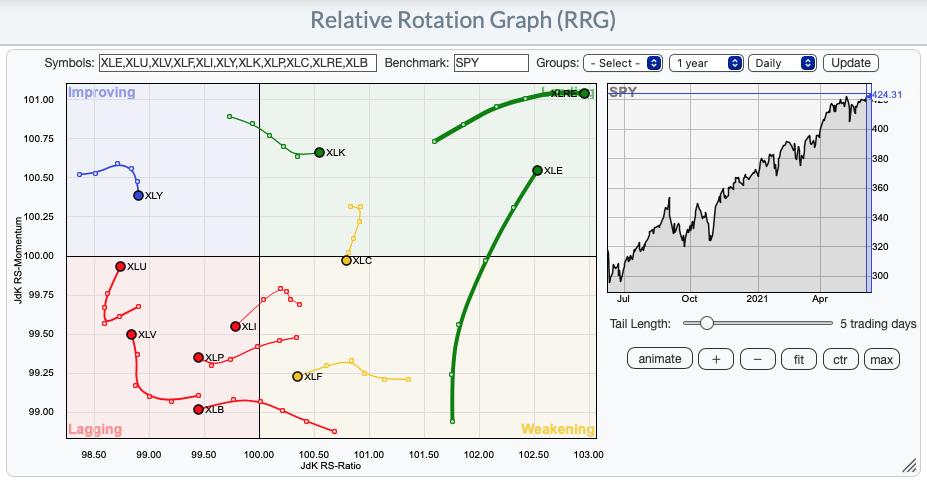
Love this RRG this week. We did our "homework" during the Diamond Mine to determine which sector and industry group to watch next weekd. We never looked at the RRG. In fact, I'm only now looking at the RRG. XLRE and XLE are overbought, but still showing strength. XLK is improving, but not to the degree I'd like.
As I said in the Diamond Mine today, I'm looking for improving sectors, sectors that are just beginning to show strength. This morning we narrowed it down to XLY and XLU. When we compared the "under the hood" indicators between the two, XLU was the clear winner. This group is only beginning to outperform and as one trader mentioned in the room, Utilities tend to perform well into the summer.
XLY on the RRG tells me we were right on going with Utilities. XLY is moving in the negative southeast direction while XLU is moving in the best direction, northeast.
Short-term RRG:
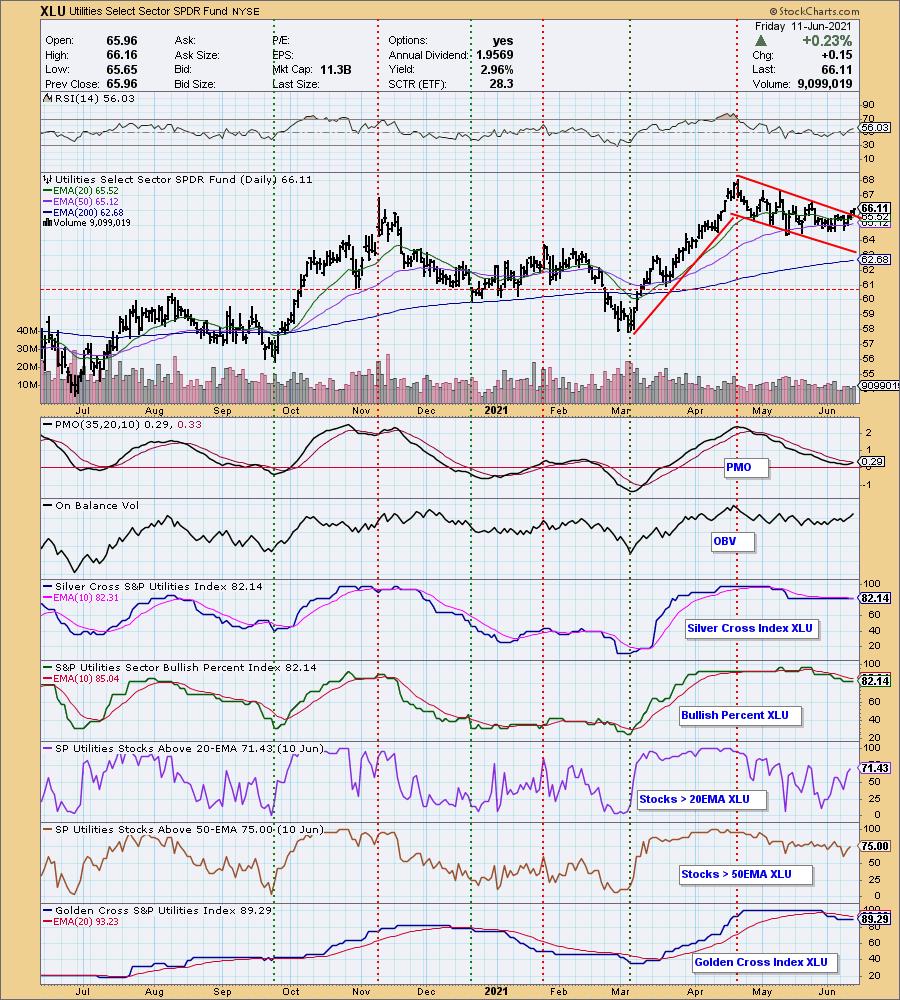
Sector to Watch: Utilities (XLU)
Price is just now breaking out of a declining trend channel. The RSI is now positive and rising. The PMO is nearing a crossover BUY signal. Participation is far better than XLY's (view the DP Sector ChartList HERE). XLU's participation is not overbought and is rising. The GCI has turned back up and the SCI is on the verge of a positive crossover on its reversal. The BPI needs a little work. Notice the pop on the OBV, telling us that volume is coming in.
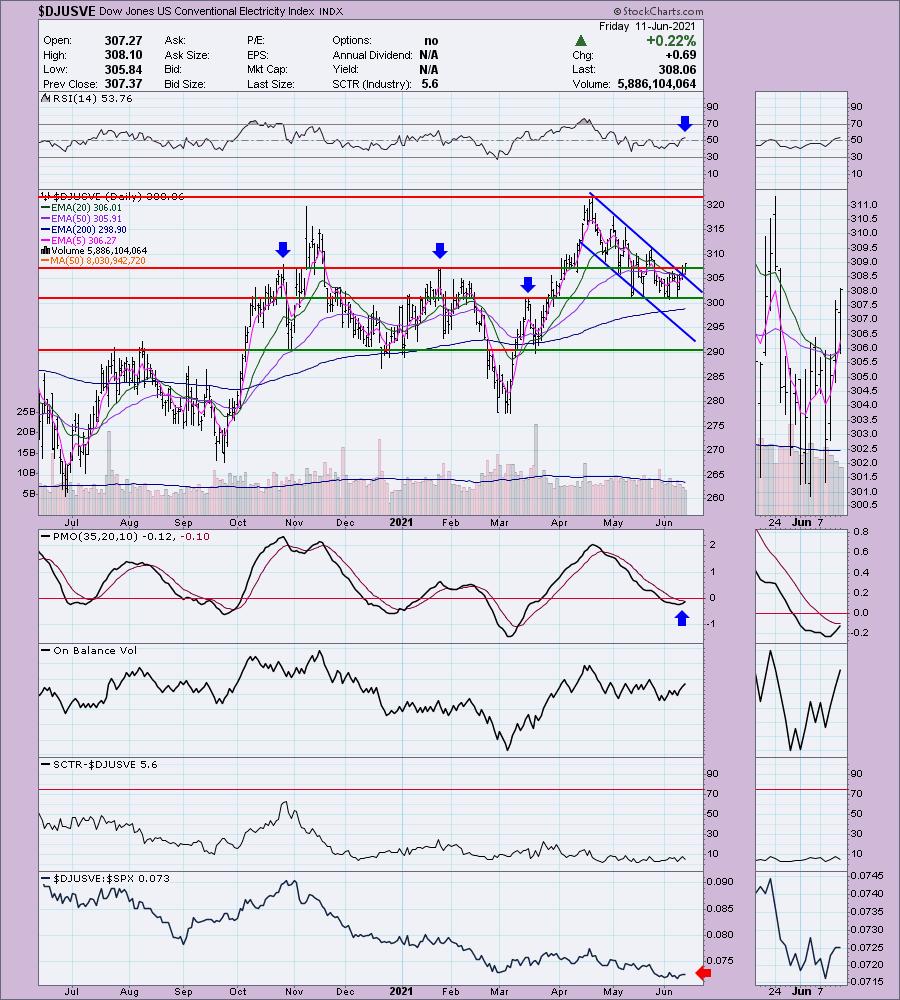
Industry Group to Watch: Conventional Electricity ($DJUSVE)
This chart looks a lot like XLU with its breakout from a declining trend channel. Also of note, the support level it bounced off is strong and today's break above a strong area of overhead resistance along October and January tops. It also finished near the top of the trading range today. The RSI just moved positive and the PMO is rising toward an oversold crossover BUY signal.
Go to our Sector ChartList on DecisionPoint.com to get an in depth view of all the sectors.
Technical Analysis is a windsock, not a crystal ball.
Have a great weekend & Happy Charting!
- Erin
erin@decisionpoint.com
Full Disclosure: I'm about 70% invested right now and 30% is in 'cash', meaning in money markets and readily available to trade with. Diamonds purchased this week: FOSL.
Watch the latest episode of DecisionPoint with Carl & Erin Swenlin on Mondays 7:00p EST or on the DecisionPoint playlist on the StockCharts TV YouTube channel here!
NOTE: The stocks reported herein are from mechanical trading model scans that are based upon moving average relationships, momentum and volume. DecisionPoint analysis is then applied to get five selections from the scans. The selections given should prompt readers to do a chart review using their own analysis process. This letter is not a call for a specific action to buy, sell or short any of the stocks provided. There are NO sure things or guaranteed returns on the daily selection of "diamonds in the rough."
Helpful DecisionPoint Links:
DecisionPoint Shared ChartList and DecisionPoint Chart Gallery
Price Momentum Oscillator (PMO)
Swenlin Trading Oscillators (STO-B and STO-V)
