
The market continues to show high volatility and is topping. With this in mind, I would consider paring back your exposure, not increasing it. However, I did see an interesting shorting opportunity arrive in my Diamond Dog scan results.
I personally prefer not to short unless I believe the market is on my side. Right now, the market is topping and that makes every investment tenuous, except for shorts. Remember that a short offers only limited gains whereas a long has no boundary to the upside. Short positions require attention, so if you're not ready to pay close attention daily, I would avoid shorting.
The two longs I'm presenting still might be best suited for a watch list. However, one is in the recreational area where we are seeing some new strength and the other is a Financial stock. I have noticed a few cruise lines popping up in my scans, but the charts aren't very favorable. Of the "stocks to review" I nearly presented DBX and LYV so I definitely recommend that you take a look at them.
Today's "Diamonds in the Rough" are: QFIN, TCOM and TIMB (Short).
Stocks/ETFs to Review (no order): BPY, DBX, ELAN, LYV, MITK, UAL and VRT.
 Diamond Mine REGISTRATION Information:
When: May 21, 2021 09:00 AM Pacific Time (US and Canada)
Topic: DecisionPoint Diamond Mine (5/21/2021) LIVE Trading Room
Register in advance for this webinar HERE.
After registering, you will receive a confirmation email containing information about joining the webinar, including the password. SAVE IT! Zoom doesn't always send out the reminders.
=======================================================================
Diamond Mine RECORDING Link **:
Topic: DecisionPoint Diamond Mine (5/14/2021) LIVE Trading Room
Start Time : May 14, 2021 08:53 AM
Meeting Recording LINK **
Access Passcode: May-14-21
** You'll have to wait briefly to be given approval to view the recording.
***Click here to register for this recurring free DecisionPoint Trading Room on Mondays at Noon ET!***
+++++++++++++++++++++++++++++++++++++++++++++++++++++++++++++++++++++++++++++++
Free DP Trading Room RECORDING LINK:
Topic: DecisionPoint Trading Room
Start Time : May 17, 2021 09:00 AM
Meeting Recording LINK.
Access Passcode: May-17th
For best results, copy and paste the access code to avoid typos.
Welcome to DecisionPoint Daily Diamonds, wherein I highlight five "diamonds in the rough." These are selected from the results of my DecisionPoint scans, which search for stocks that could benefit from the trend and condition of the market. Remember, these are not recommendations to buy or sell, but are the most interesting of the stocks that surfaced in my scans. My objective is to save you the work of the initial, tedious culling process, but you need to apply your own analysis to see if these stocks pique your interest as well. There are no guaranteed winners here!
360 Finance Inc. (QFIN)
EARNINGS: 5/27/2021 (AMC)
360 DigiTech, Inc. is a holding company, which engages in the provision of digital consumer finance platform. It provides tailored online consumer finance products to prime, underserved borrowers funded primarily by its funding partners. The company proprietary technology platform supports full transaction lifecycle from credit application through settlement. 360 Finance was founded on July 25, 2016 and is headquartered in Shanghai, China.
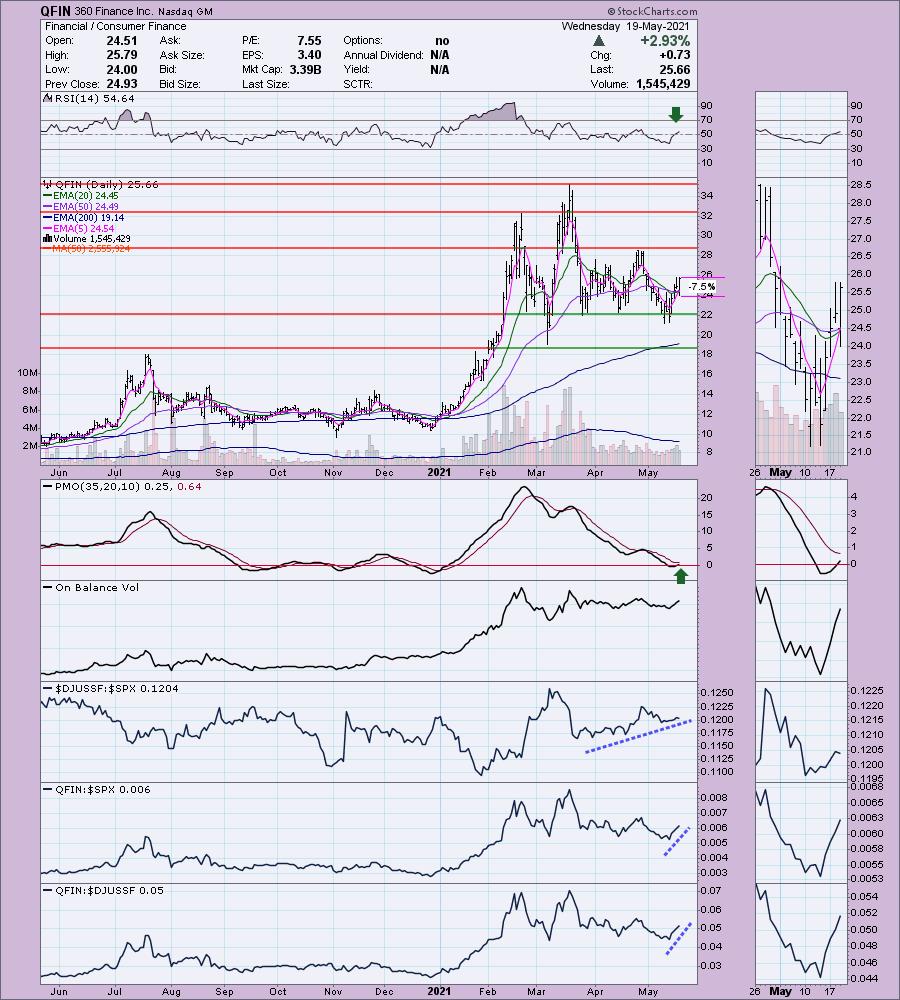
QFIN is down -0.08% in after hours trading. This one is pretty volatile right now, but it looks ready to at least test overhead resistance at the April top. It's performing very well. The industry group overall has been outperforming the SPX and now this one is beginning to outperform not only its industry group, but the SPX as well. The RSI just moved into positive territory and the PMO has turned up in oversold territory. I have the stop set below the 20/50-EMAs. Notice that the 20-EMA is about to cross above the 50-EMA. That would be an IT Trend Model "Silver Cross" BUY signal.
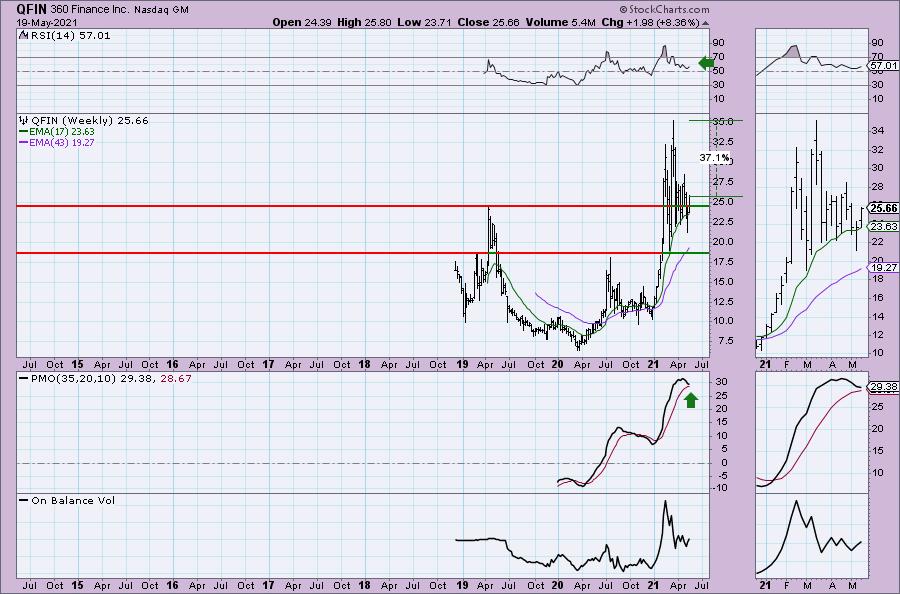
The weekly chart at first glance may not be that appealing, but notice in the thumbnail that the weekly PMO is bottoming above its signal line. That is usually an especially bullish signal. The weekly RSI is also positive. Upside potential is at the 2021 top for a 37% gain.
Ctrip.com Intl Ltd. (TCOM)
EARNINGS: 9/2/2021 (AMC) ** Reported Today **
Trip.com Group Ltd. engages in the provision of travel-related services. It provides hotel accommodations, airline tickets, packaged tours, corporate travel management services, property management systems and advertising services. The company was founded by Jian Zhang Liang, Min Fan, Nan Peng Shen and Qi Ji in June 1999 and is headquartered in Shanghai, China.
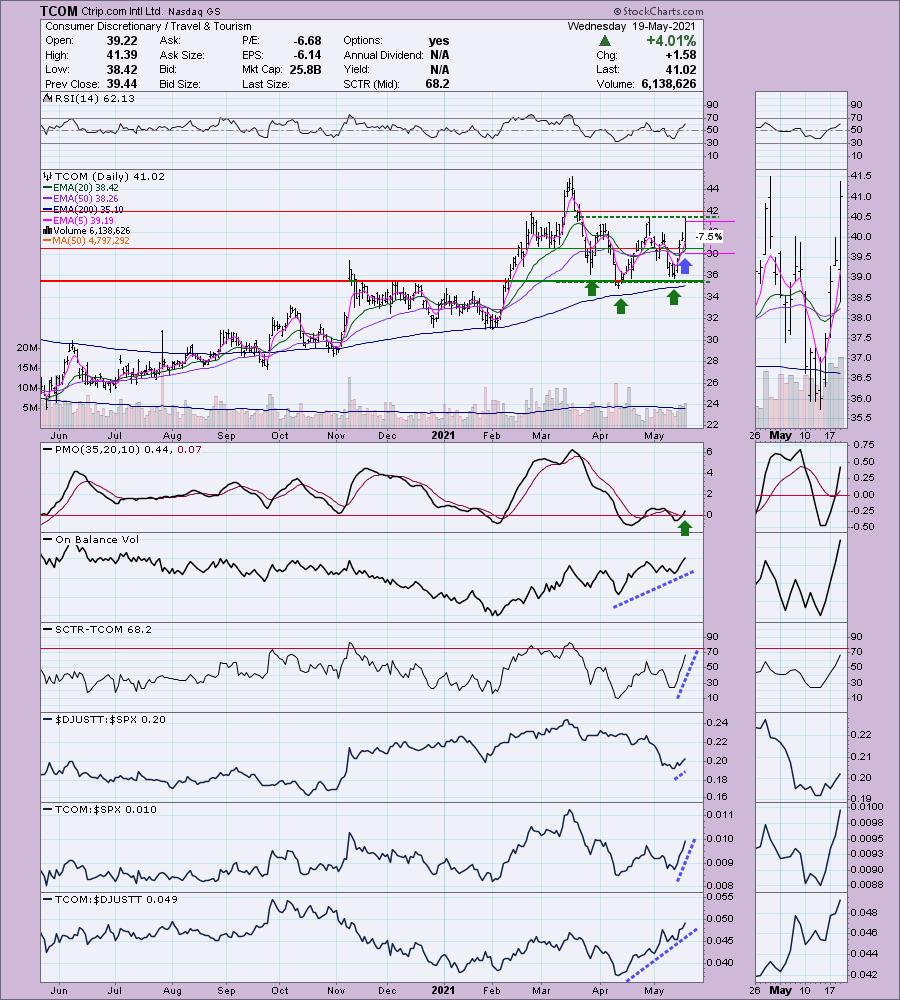
TCOM is unchanged in after hours trading. Today it reported positive earnings and was up over 4%. This puts our spreadsheet on Friday at a disadvantage, but I see a breakout in the making. The PMO just triggered a BUY signal and it just had a "Silver Cross" BUY signal trigger on the 20/50-EMA positive crossover (IT Trend Model BUY). Additionally, the 5-EMA crossed above the 20-EMA which is a ST Trend Model BUY signal. I like this one on the oversold PMO BUY signal and what appears to be a triple-bottom. The stop is set below the early March lows, but if it doesn't breakout quickly, no need to hold onto it.
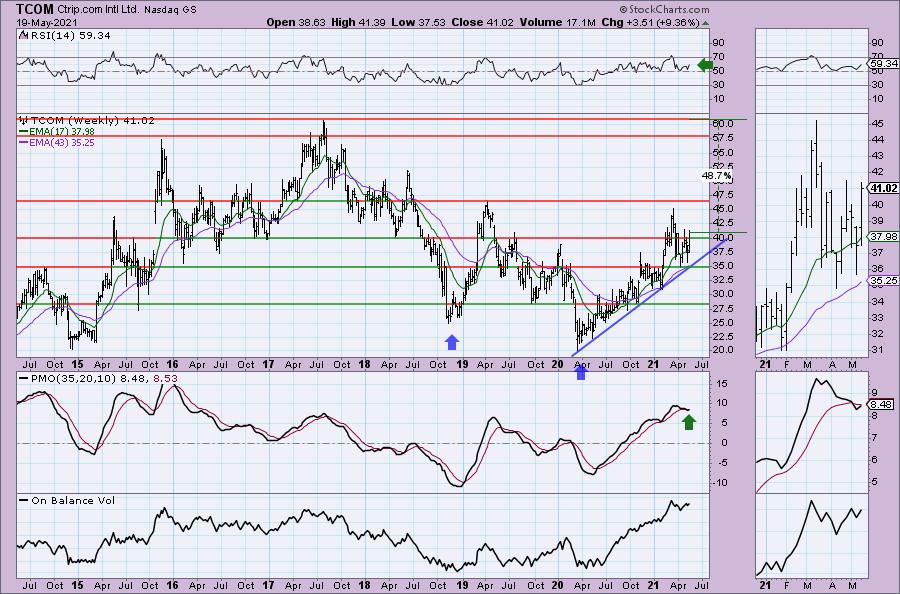
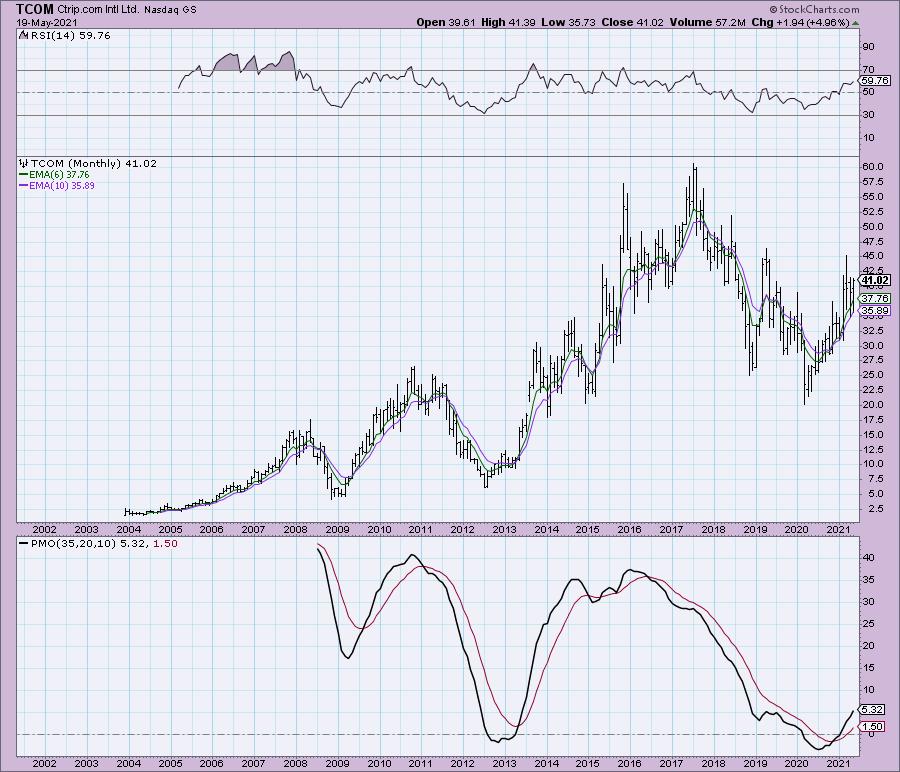
The weekly PMO is about to trigger a whipsaw BUY signal. You can see that TCOM has been on a steady rising trend since the bear market low. I've also annotated what looks like a double-bottom. I've put the monthly chart below the weekly chart so you can see it better. The weekly RSI is positive and you can see on the monthly chart that the PMO is rising and on a BUY signal.
TIM S.A (TIMB) - Short
EARNINGS: 7/27/2021 (BMO)
TIM SA (Brazil) engages in providing mobile telephony, internet, and media telecommunication services. It offers modem, tablet, cell phone, and ultra fixed broadband. The company was founded on March 9, 1998 and is headquartered in Rio de Janeiro, Brazil.
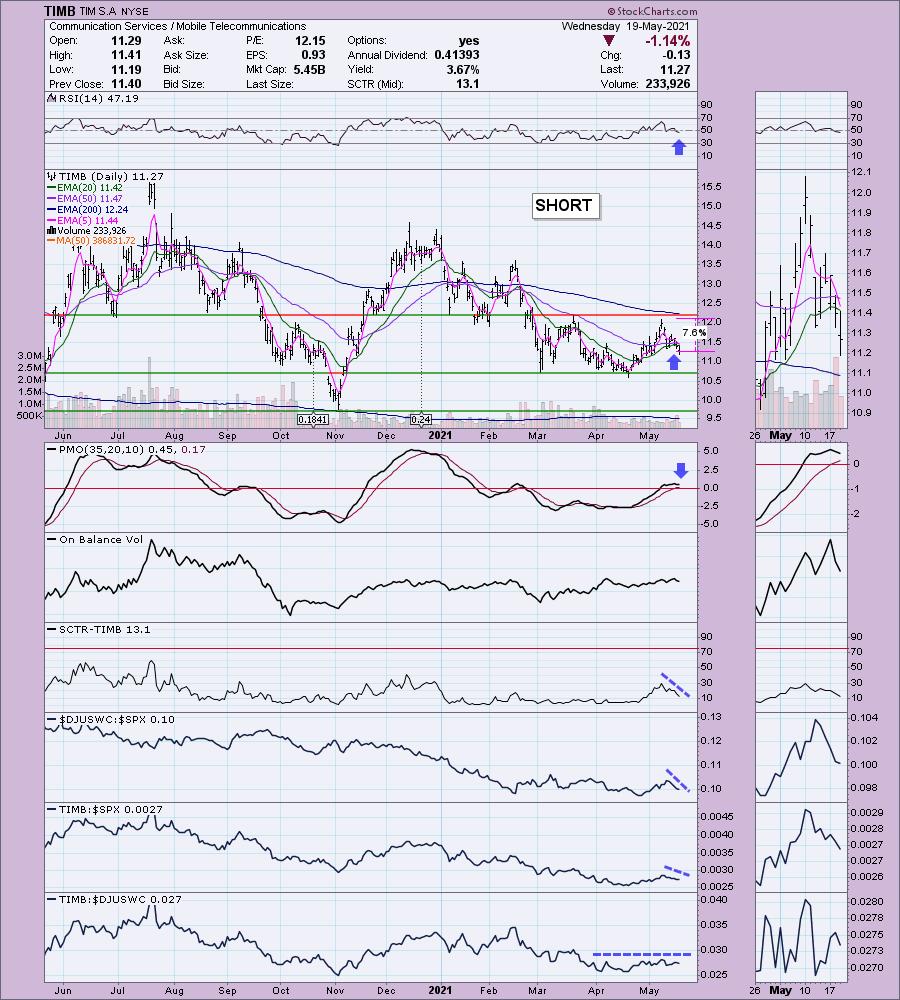
TIMB is unchanged in after hours trading. This is a possible shorting opportunity so the chart should be read a bit differently. We want negative attributes. This one has plenty. The RSI just moved into negative territory. Price has broken down below the 20/50-EMAs which has caused the 20-EMA to reverse direction and begin declining away from the 50-EMA. This means it will keep its IT Trend Model SELL signal (triggered on negative 20/50-EMA crossover while 50-EMA was below the 200-EMA). The PMO is topping very close to the zero line. The SCTR is abysmal at 13.1 and we can see it is an underperformer. Since it is a short, the stop is actually set higher than where price is. In this case I've set it at the May top.
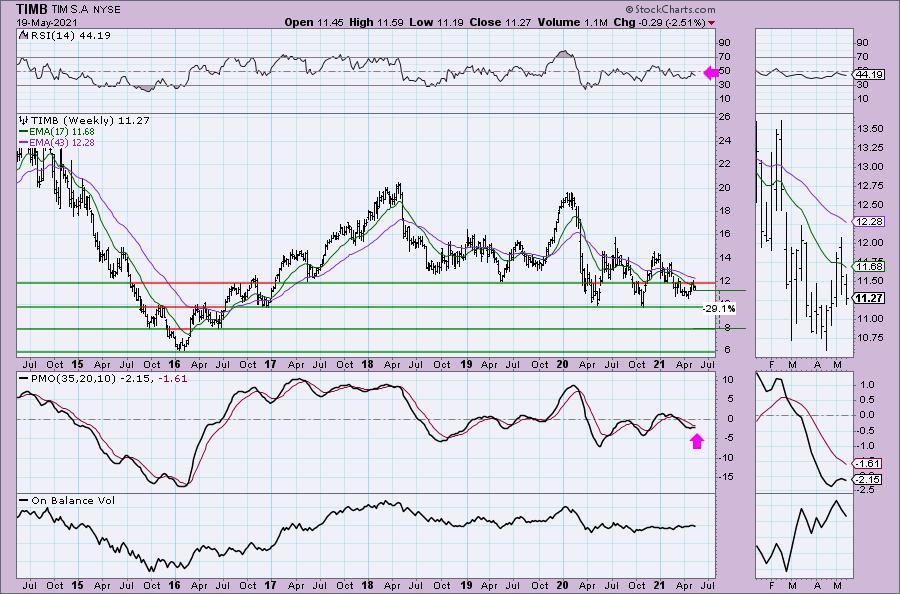
Notice on the weekly chart that price failed to overcome resistance at the 2017 - 2019 troughs. The weekly RSI is negative and declining and the weekly PMO has topped below its signal line which is especially bearish. Upside potential is actually measured downward. I have support at $8 listed as the target for the short which would provide a 29% gain.
Don't forget, on Thursdays I look at reader-requested symbols, so shoot me an email at erin@decisionpoint.com. I read every email I receive and try to answer them all!
Current Market Outlook:
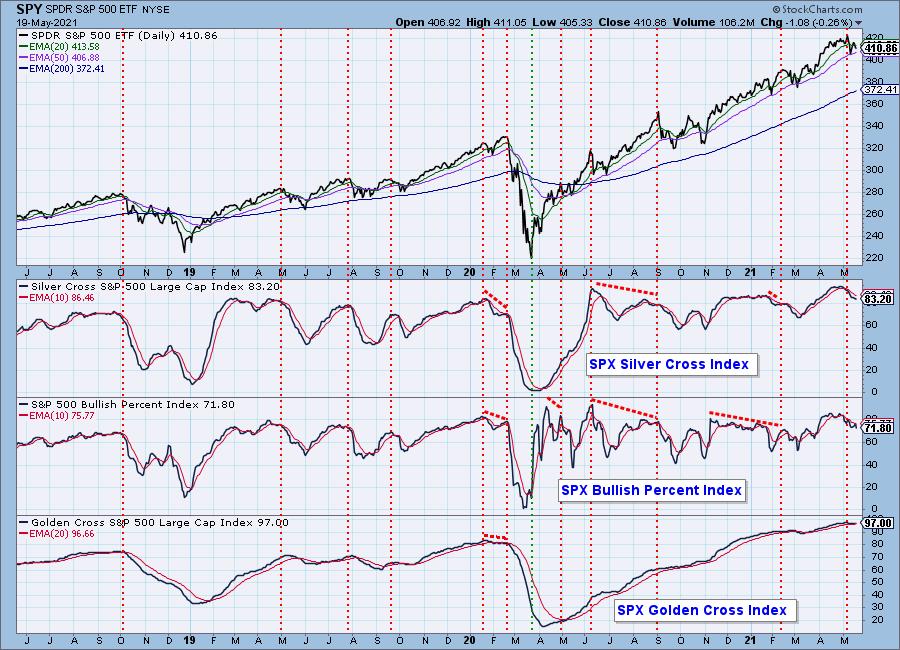
Market Environment: It is important to consider the odds for success by assessing the market tides. The following chart uses different methodologies for objectively showing the depth and trend of participation for intermediate- and long-term time frames.
- The Silver Cross Index (SCI) shows the percentage of SPX stocks on IT Trend Model BUY signals (20-EMA > 50-EMA)
- The Golden Cross Index (GCI) shows the percentage of SPX stocks on LT Trend Model BUY signals (50-EMA > 200-EMA)
- The Bullish Percent Index (BPI) shows the percentage of SPX stocks on Point & Figure BUY signals.
Don't forget that as a "Diamonds" member, you have access to our GCI/SCI curated ChartList on DecisionPoint.com. You'll find it under "Members Only" links on the left side on the Blogs and Links Page.
Here is the current chart:
Diamond Index:
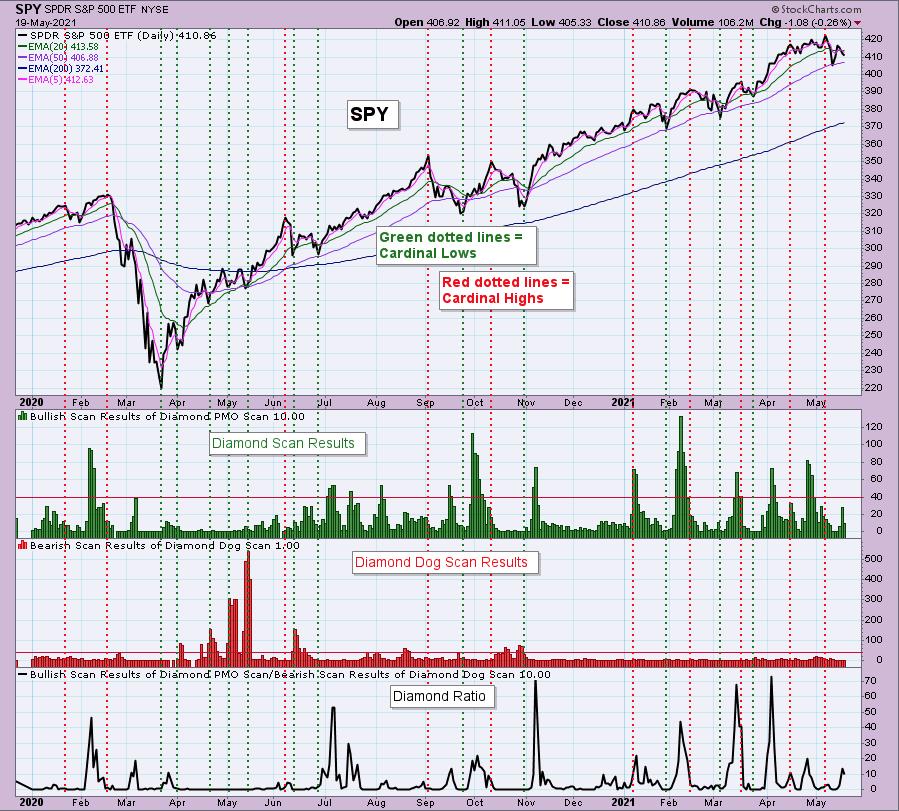
The Diamond Index chart looks at the number of scan results from my bullish Diamond PMO Scan and the number of scan results from the inverse Diamond Dog Scan. The Diamond Ratio divides the bullish results by the bearish results.
I only have data going back to October 2019 so I won't make any sweeping conclusions about the Diamond Index chart. I have marked cardinal tops with red dotted vertical lines and cardinal price bottoms with green dotted vertical lines. I believe that when the Diamond Dog results spike, it usually comes at a price bottom, or marks a strong continuation of the rising trend.
Unfortunately, the Diamond PMO Scan result numbers aren't providing much insight. The Diamond Ratio has promise, but again I don't see a clear correlation to the market tops/bottoms right now. I need to study and manipulate the data some more. Keep you posted!
Full Disclosure: I'm about 60% invested and 40% is in 'cash', meaning in money markets and readily available to trade with. Opted not to increase my exposure.
Technical Analysis is a windsock, not a crystal ball.
Happy Charting!
- Erin
erin@decisionpoint.com
Watch the latest episode of DecisionPoint with Carl & Erin Swenlin on Mondays 7:00p EST or on the DecisionPoint playlist on the StockCharts TV YouTube channel here!
NOTE: The stocks reported herein are from mechanical trading model scans that are based upon moving average relationships, momentum and volume. DecisionPoint analysis is then applied to get five selections from the scans. The selections given should prompt readers to do a chart review using their own analysis process. This letter is not a call for a specific action to buy, sell or short any of the stocks provided. There are NO sure things or guaranteed returns on the daily selection of "diamonds in the rough."
Helpful DecisionPoint Links:
DecisionPoint Shared ChartList and DecisionPoint Chart Gallery
Price Momentum Oscillator (PMO)
Swenlin Trading Oscillators (STO-B and STO-V)
For more links, go to DecisionPoint.com!
