
I don't want to give away which industry group that will be revealed further down in this article. The first few sentences appear on our Blogs and Links page so I usually don't get to the point in DP Diamonds until I'm sure that no one will get the information.
Remember to send me your symbol requests for Thursday's report!
This particular industry group came in among Diamond scan results and the charts look fantastic in the short term. The weekly charts are decidedly bearish as you'll see. Based on after hours trading, most are lower, but this could offer some interesting entries.
And the industry group is: AIRLINES!
Three airlines arrived in the results and that is quite significant given there were only 28 results today from the Diamond PMO Scan. I opted to present an additional airline that is a clear out-performer amongst the industry group as well as the Airline ETF (JETS).
Today's "Diamonds in the Rough" are: AAL, ALK, JBLU, JETS and SAVE.
Stocks/ETFs to Review (no order): CCL, GPMT, HGV, JCOM and WH.
 Diamond Mine REGISTRATION Information:
When: May 21, 2021 09:00 AM Pacific Time (US and Canada)
Topic: DecisionPoint Diamond Mine (5/21/2021) LIVE Trading Room
Register in advance for this webinar HERE.
After registering, you will receive a confirmation email containing information about joining the webinar, including the password. SAVE IT! Zoom doesn't always send out the reminders.
=======================================================================
Diamond Mine RECORDING Link **:
Topic: DecisionPoint Diamond Mine (5/14/2021) LIVE Trading Room
Start Time : May 14, 2021 08:53 AM
Meeting Recording LINK **
Access Passcode: May-14-21
** You'll have to wait briefly to be given approval to view the recording.
***Click here to register for this recurring free DecisionPoint Trading Room on Mondays at Noon ET!***
+++++++++++++++++++++++++++++++++++++++++++++++++++++++++++++++++++++++++++++++
Free DP Trading Room RECORDING LINK:
Topic: DecisionPoint Trading Room
Start Time : May 17, 2021 09:00 AM
Meeting Recording LINK.
Access Passcode: May-17th
For best results, copy and paste the access code to avoid typos.
Welcome to DecisionPoint Daily Diamonds, wherein I highlight five "diamonds in the rough." These are selected from the results of my DecisionPoint scans, which search for stocks that could benefit from the trend and condition of the market. Remember, these are not recommendations to buy or sell, but are the most interesting of the stocks that surfaced in my scans. My objective is to save you the work of the initial, tedious culling process, but you need to apply your own analysis to see if these stocks pique your interest as well. There are no guaranteed winners here!
American Airlines Group Inc. (AAL)
EARNINGS: 7/22/2021 (BMO)
American Airlines Group, Inc. is a holding company, which engages in the operation of a network carrier through its principal wholly-owned mainline operating subsidiary, American. The firm offers air transportation for passengers and cargo. It operates through the following geographical segments: Department of Transportation Domestic; Department of Transportation Latin America; Department of Transportation Atlantic; and Department of Transportation Pacific. The company was founded on December 9, 2013 and is headquartered in Fort Worth, TX.
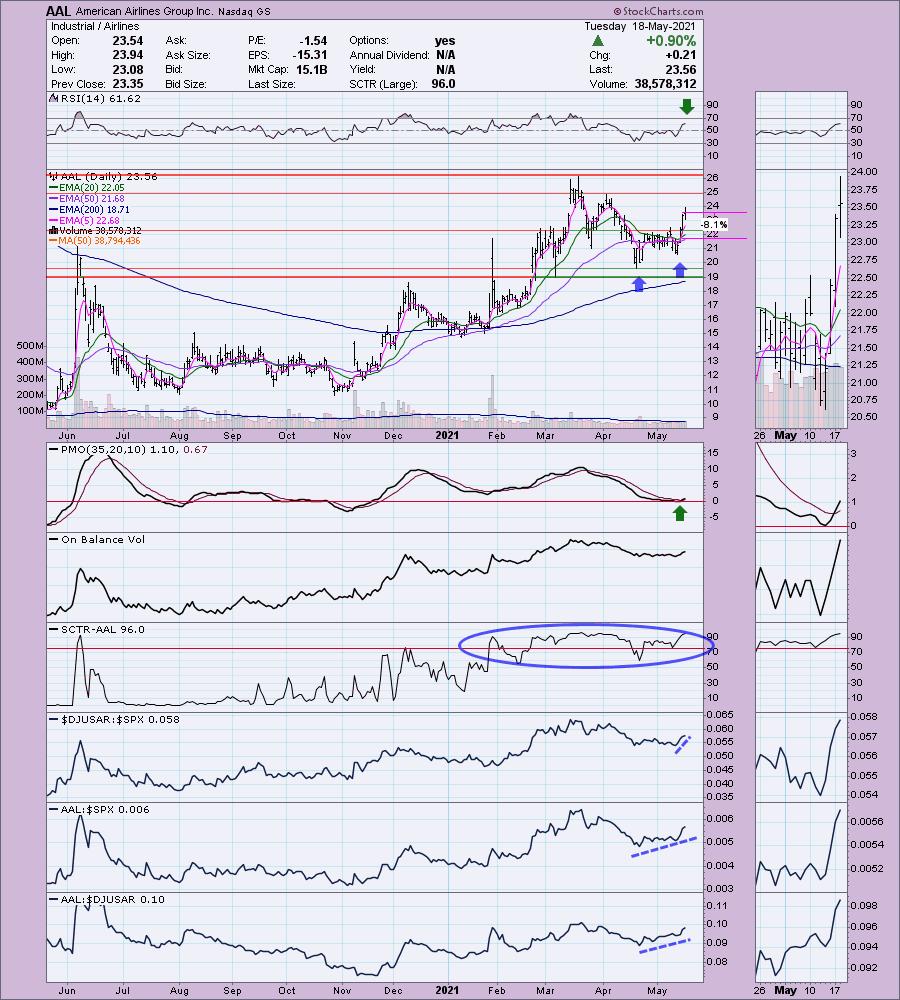
AAL is down -0.25% in after hours trading. I've never covered AAL before which surprised me. This one didn't come up in the scan results but clearly outperforms its group so I had to include it. We have a double-bottom pattern. Yesterday the pattern resolved as expected to the upside. Today there was excellent follow-through. The PMO is on a new crossover BUY signal and the RSI is positive and not overbought. The SCTR has been healthy most of 2021. Notice the outperformance of Airlines as a whole. The stop is set around the 50-EMA.
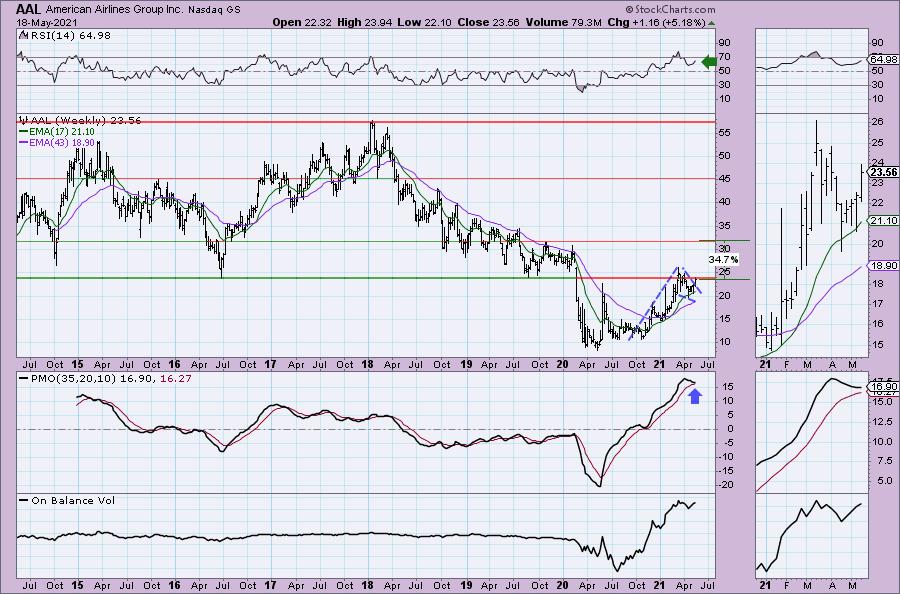
The problem for AAL is that it was unable to break through strong overhead resistance earlier this year. It is currently right up against it. The weekly RSI is positive and for AAL, the weekly PMO is beginning to bottom above the signal line which is especially bullish. Even if it can just get to the 2020 high, we would have a 34%+ gain.
Alaska Air Group, Inc. (ALK)
EARNINGS: 7/22/2021 (BMO)
Alaska Air Group, Inc. is a holding company, which engages in the provision of air transportation services. It operates through the following segments: Mainline, Regional and Horizon. The Mainline segment includes Alaska's Boeing or Airbus jet aircraft for passengers and cargo throughout the U.S., and in parts of Canada, Mexico, and Costa Rica. The Regional segment consists of Horizon's and other third-party carriers' scheduled air transportation for passengers across a shorter distance network within the U.S. and Canada under capacity purchase agreements (CPAs). The Horizon segment comprises of the the capacity sold to Alaska under CPA. The company was founded in 1985 and is headquartered in Seattle, WA.
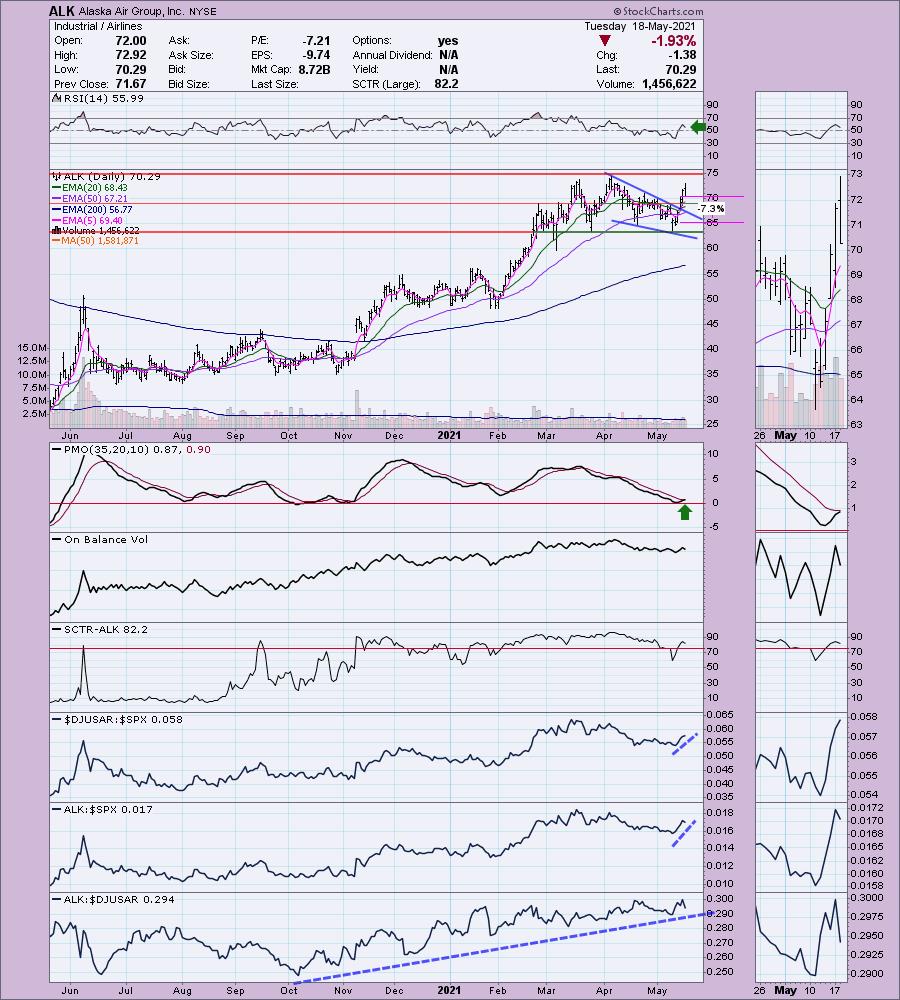
ALK is down -0.41% in after hours trading. I like this one on today's pullback. Based on after hours trading, it may move further toward the 20-EMA which would give us a better entry. The PMO is nearing a crossover BUY signal and was barely bothered by today's -1.93% decline. The RSI is positive and the SCTR is strong. ALK has been a long-time out-performer against its group and it is beginning to outperform the SPX right now. the stop is set at the mid-April low, but you could tighten that up to the 50-EMA if you wish.
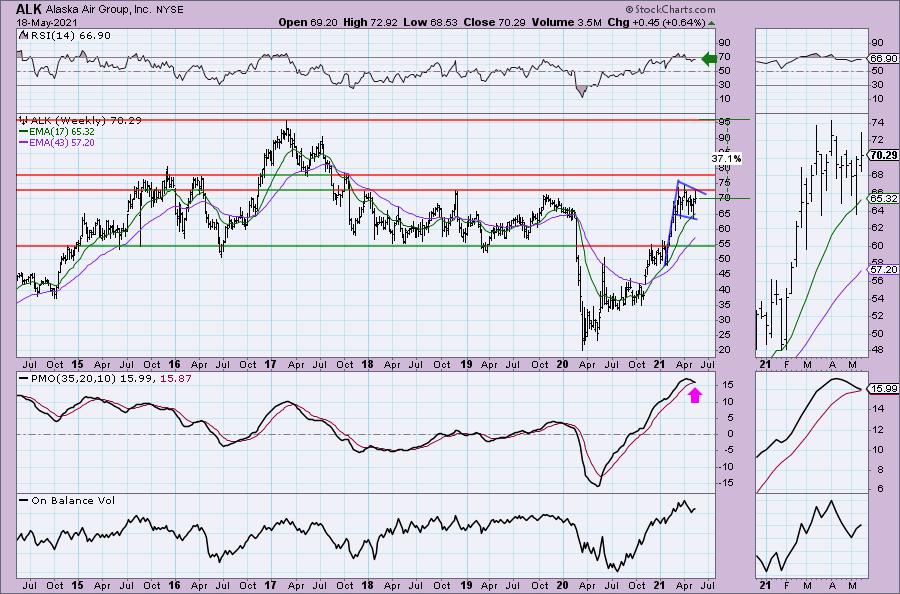
The weekly RSI is positive and not overbought. The weekly PMO is nearing a crossover SELL signal, but we do have a bullish flag formation. ALK is in the same position AAL is, strong overhead resistance is right here. Given the bullishness of the daily charts, I'm expecting these areas of overhead resistance to be broken.
JetBlue Airways Corp. (JBLU)
EARNINGS: 7/27/2021 (BMO)
JetBlue Airways Corp. provides air transportation services. It carries more than 30 million customers a year to 86 cities in the U.S., Caribbean, and Latin America with an average of 850 daily flights. The firm offers flights and tickets to more than 82 destinations, with accommodations such as free TV, free snacks, and most legroom. The company was founded by David Gary Neeleman in August, 1998 and is headquartered in Long Island City, NY.
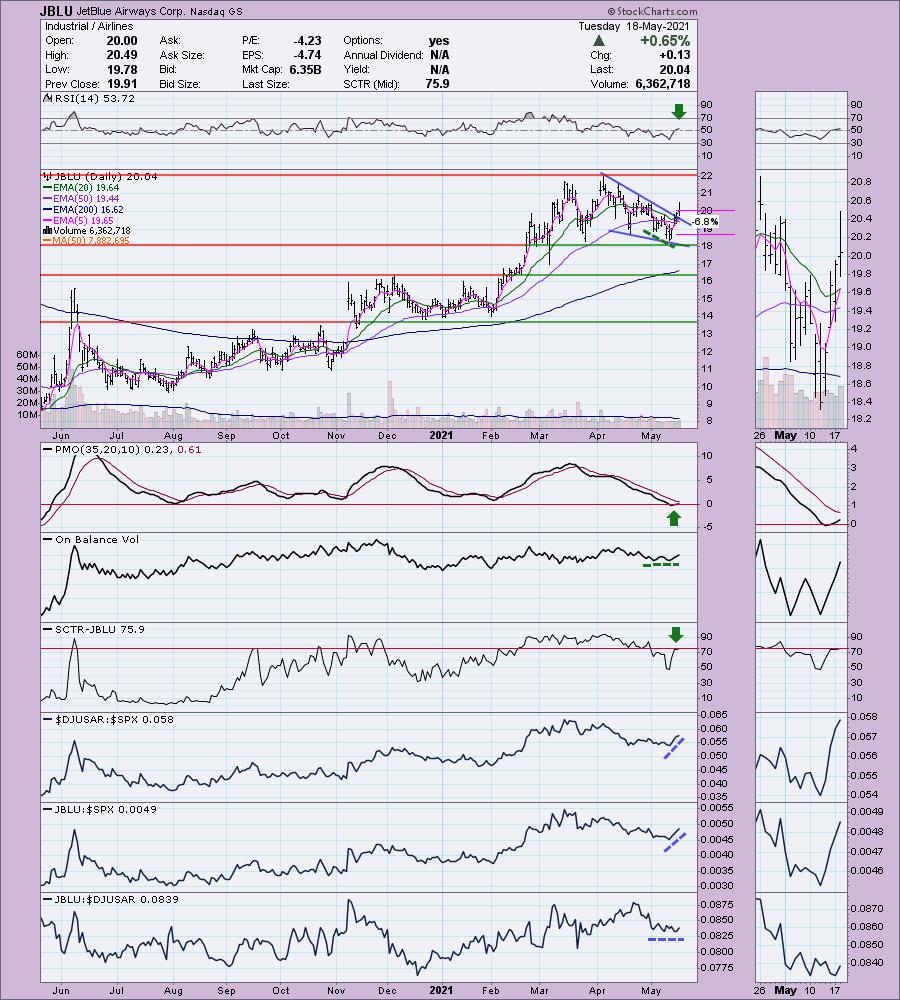
JBLU is down -0.60% in after hours trading. JBLU has a bullish falling wedge that was executed with yesterday's close. Today we saw nice follow-through. The 5-EMA just crossed above the 20-EMA which triggers a ST Trend Model BUY signal. The PMO turned up in oversold territory just above the zero line and is nearing a crossover BUY signal. The RSI is positive. There is a slight positive OBV divergence as well. It's performing with the industry group. That's okay since the group itself is breaking out relatively against the SPX. The stop is set near the mid-April low.
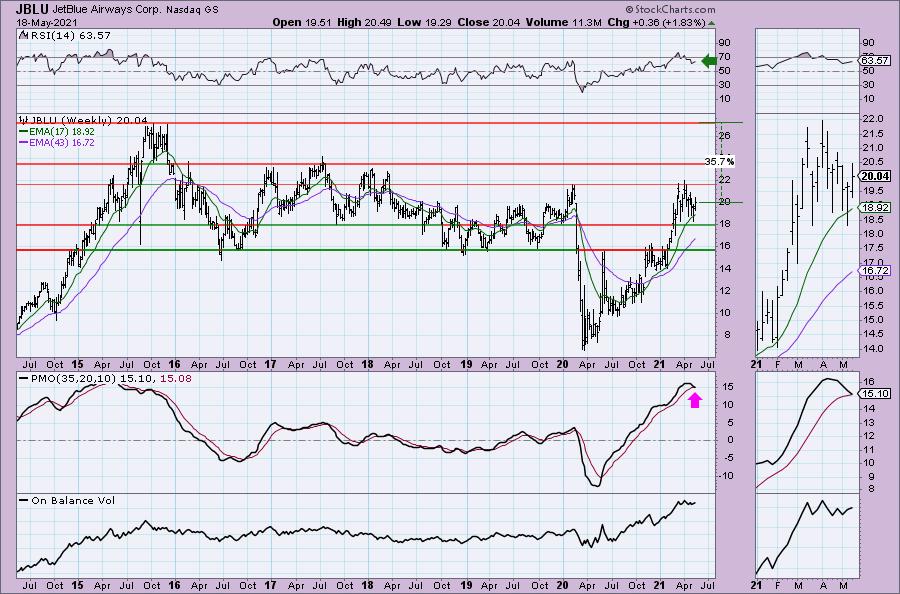
This is one of the more bearish of the weekly charts today. The PMO is likely to trigger a crossover SELL signal this week and you can see price's failure to get above strong overhead resistance. It has a bull "flag-ish" appearance which is positive and the weekly RSI is positive and not overbought.
US Global Jets ETF (JETS)
EARNINGS: N/A
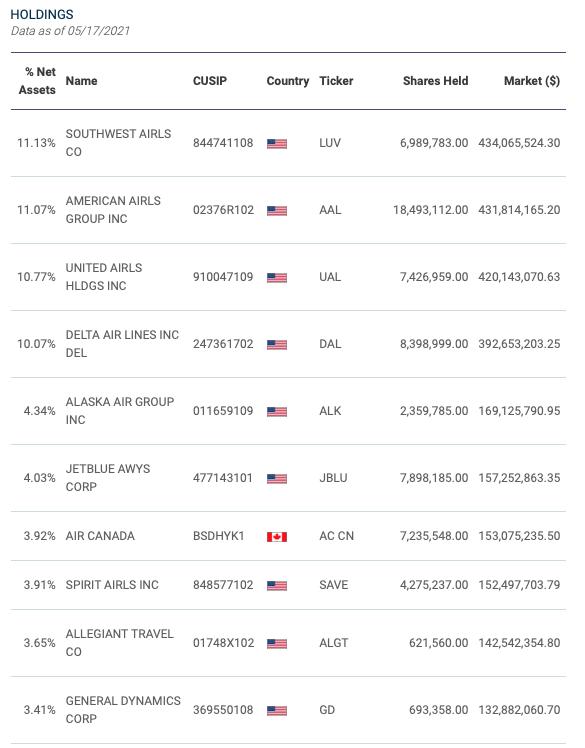
JETS invests in both US and non-US airline companies. This concentrated portfolio is weighted towards domestic passenger airlines.
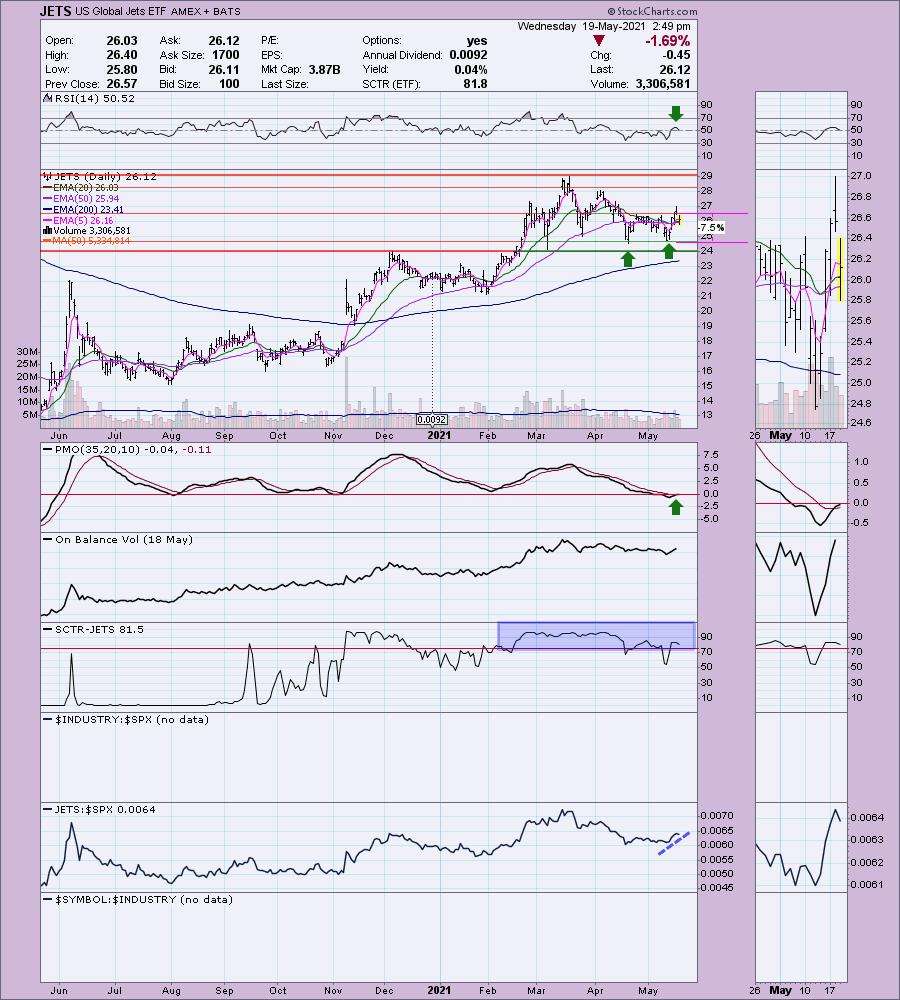
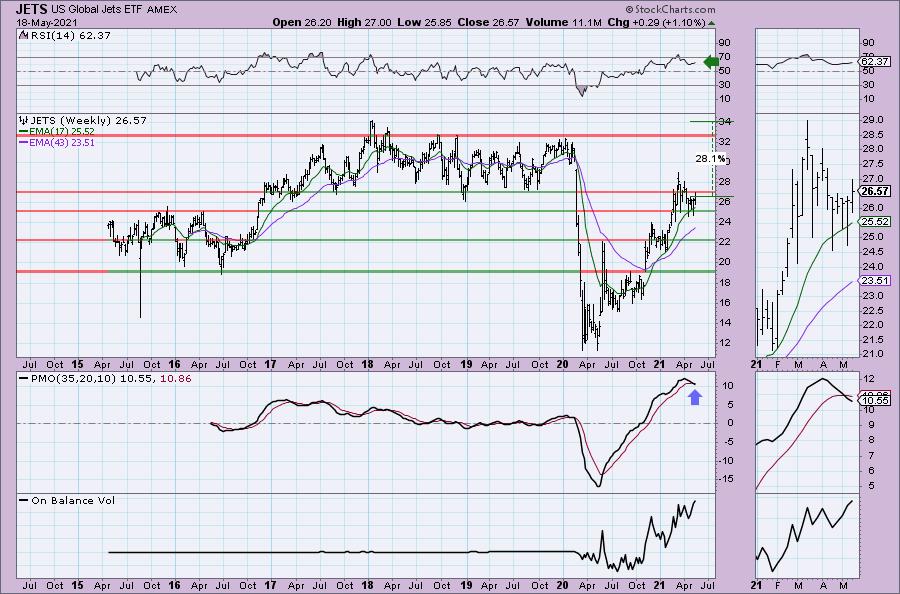
JETS is down -0.26% in after hours trading. I covered JETS back on September 10th 2020. I didn't state the stop, but looking at the chart, I would've set it at $16.25. While the stop came close to triggering, it never closed below this price. That makes this position up +48.1% since being picked. It is positioned well again. There is a double-bottom that executed today. Price did slide back to close right on the confirmation line. The PMO just triggered a crossover BUY signal. This one also has a ST Trend Model BUY signal today. The RSI is positive and the SCTR has remained strong amongst all ETFs. The stop is set below the double-bottom.
JETS already had a negative weekly PMO crossover SELL signal, but the RSI is still positive. It managed to break above resistance earlier in the year, but pulled back. It appears to me that the 2021 rally has now been digested and we should see price breakout again.
Spirit Airlines, Inc. (SAVE)
EARNINGS: 7/21/2021 (AMC)
Spirit Airlines, Inc. is an airline that offers travel to price-conscious customers. Its customers start with an unbundled base fares that remove components included in the price of an airline ticket. The company was founded by Ned Homfeld in 1964 and is headquartered in Miramar, FL.
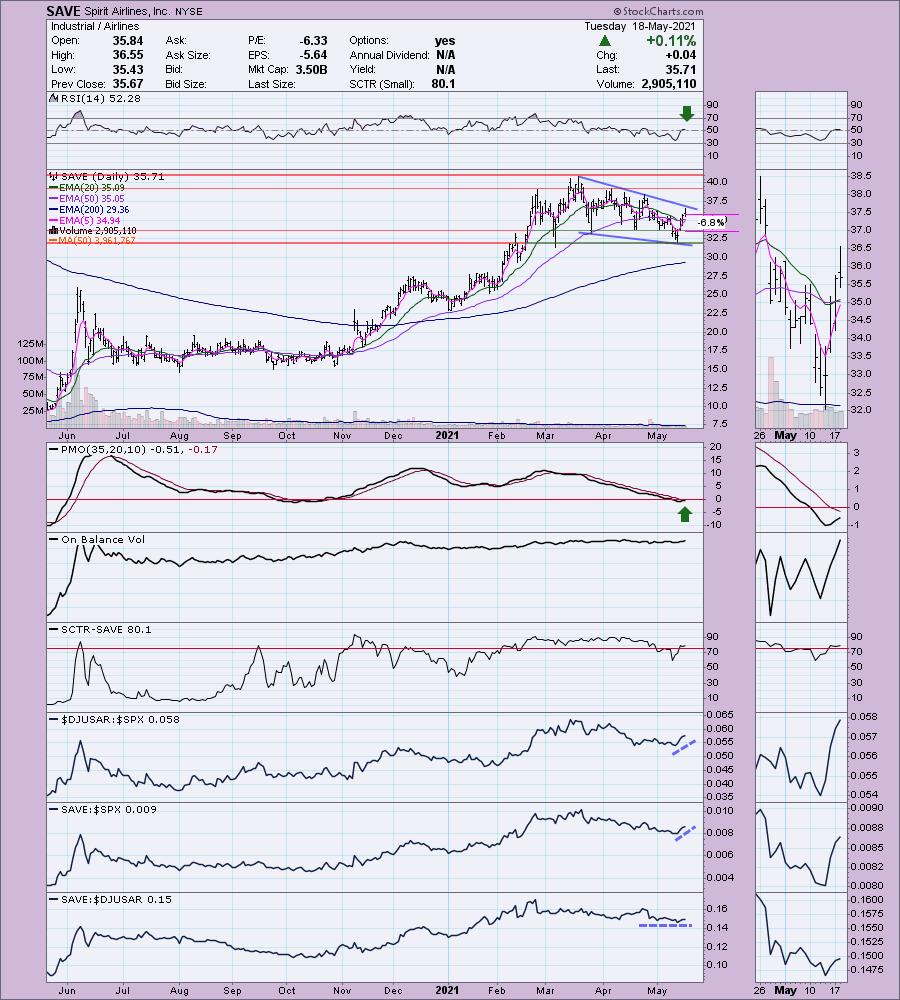
SAVE is down -0.28% in after hours trading. I covered SAVE on February 18th 2021. The stop was never hit so it is up a modest +2.9%. Here we have another falling wedge, but this one hasn't executed yet. The 20-EMA just crossed above the 50-EMA for an IT Trend Model "Silver Cross" BUY signal. The RSI just entered positive territory and the PMO has turned up in oversold territory. The SCTR is now in the "hot zone" above 75 (stock is in the upper quartile of all small-cap stocks). It's performing about as well as the industry group which is fine since the group is outperforming. I would expect to see a breakout here, but the stop is set at $33.50.
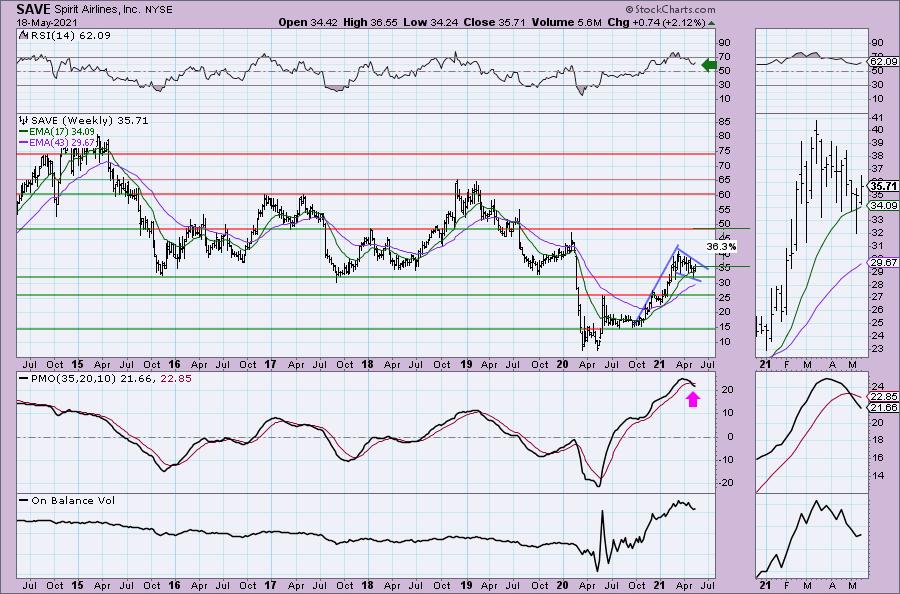
Very nice bull flag on SAVE. Unlike the others, it is holding above support, not trying to clear overhead resistance like the others. The weekly PMO is on a SELL signal which is unfortunate, but the weekly RSI is positive and not overbought.
Don't forget, on Thursdays I look at reader-requested symbols, so shoot me an email at erin@decisionpoint.com. I read every email I receive and try to answer them all!
Current Market Outlook:
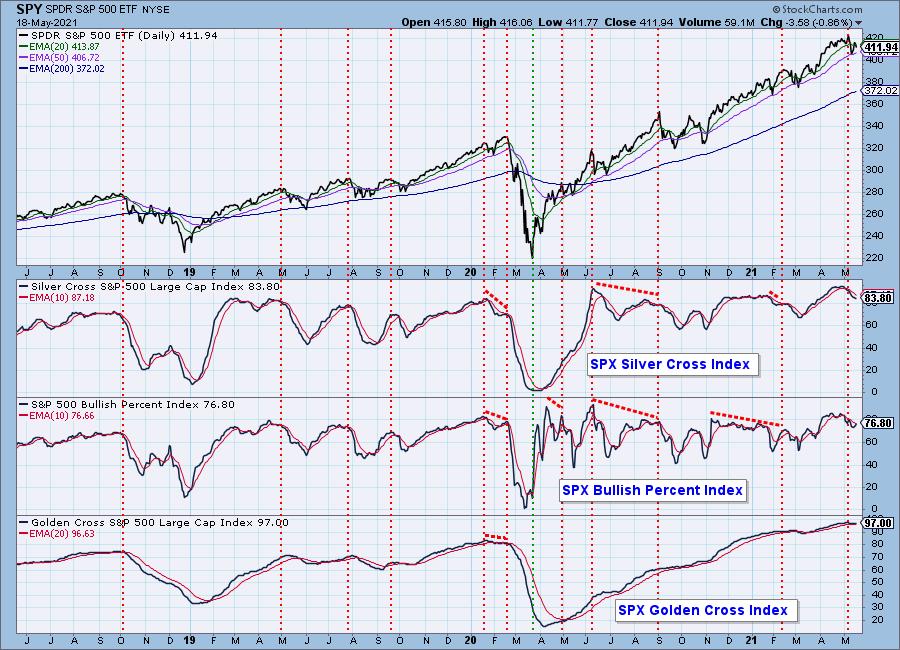
Market Environment: It is important to consider the odds for success by assessing the market tides. The following chart uses different methodologies for objectively showing the depth and trend of participation for intermediate- and long-term time frames.
- The Silver Cross Index (SCI) shows the percentage of SPX stocks on IT Trend Model BUY signals (20-EMA > 50-EMA)
- The Golden Cross Index (GCI) shows the percentage of SPX stocks on LT Trend Model BUY signals (50-EMA > 200-EMA)
- The Bullish Percent Index (BPI) shows the percentage of SPX stocks on Point & Figure BUY signals.
Don't forget that as a "Diamonds" member, you have access to our GCI/SCI curated ChartList on DecisionPoint.com. You'll find it under "Members Only" links on the left side on the Blogs and Links Page.
Here is the current chart:
Diamond Index:
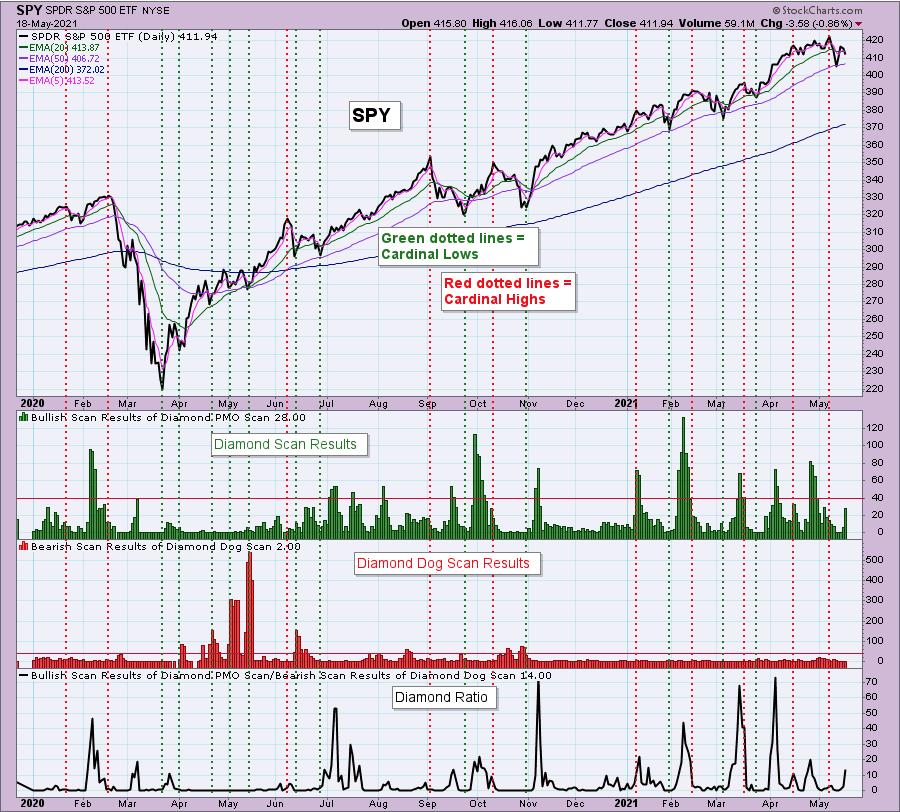
The Diamond Index chart looks at the number of scan results from my bullish Diamond PMO Scan and the number of scan results from the inverse Diamond Dog Scan. The Diamond Ratio divides the bullish results by the bearish results.
I only have data going back to October 2019 so I won't make any sweeping conclusions about the Diamond Index chart. I have marked cardinal tops with red dotted vertical lines and cardinal price bottoms with green dotted vertical lines. I believe that when the Diamond Dog results spike, it usually comes at a price bottom, or marks a strong continuation of the rising trend.
Unfortunately, the Diamond PMO Scan result numbers aren't providing much insight. The Diamond Ratio has promise, but again I don't see a clear correlation to the market tops/bottoms right now. I need to study and manipulate the data some more. Keep you posted!
Full Disclosure: I'm about 60% invested and 40% is in 'cash', meaning in money markets and readily available to trade with. Contemplating getting in on an airline tomorrow depending on 5-min candlestick and if these after hours declines become more serious.
Technical Analysis is a windsock, not a crystal ball.
Happy Charting!
- Erin
erin@decisionpoint.com
Watch the latest episode of DecisionPoint with Carl & Erin Swenlin on Mondays 7:00p EST or on the DecisionPoint playlist on the StockCharts TV YouTube channel here!
NOTE: The stocks reported herein are from mechanical trading model scans that are based upon moving average relationships, momentum and volume. DecisionPoint analysis is then applied to get five selections from the scans. The selections given should prompt readers to do a chart review using their own analysis process. This letter is not a call for a specific action to buy, sell or short any of the stocks provided. There are NO sure things or guaranteed returns on the daily selection of "diamonds in the rough."
Helpful DecisionPoint Links:
DecisionPoint Shared ChartList and DecisionPoint Chart Gallery
Price Momentum Oscillator (PMO)
Swenlin Trading Oscillators (STO-B and STO-V)
For more links, go to DecisionPoint.com!
