
Reader Request Day! I have five stocks from five areas that are beginning to outperform after serious corrections or pullbacks. Money is rotating into some of the beat down areas of the market. Don't miss today's Chartwise Women show! We covered many stocks that are experiencing downside reversals and discussed how best to determine if rallies can be sustained or how to determine when the trade isn't going well. You'll find the link here.
Yesterday I was reviewing the Renewable Energy sector and it looked like we were getting a nice reversal at beat down lows, but being picky, I wanted to see breakouts above the 20- and 200-EMAs. I had planned on presenting a Renewable Energy stock today as we got the breakouts, but one of my subscribers beat me to it with his request. The overall industry group is heating up (no pun intended) and could offer us a good place to park some funds while the market goes through its volatile gyrations.
All of the charts today look very enticing, but if you're not prepared to be a babysitter right now, I suggest waiting it out on the sidelines until the general market settles down a bit. I sold two more positions and my exposure is down to 50/50. Since I can babysit my positions, I may look for an entry on a few of these stocks presented today.
Tomorrow is the Diamond Mine trading room! Be sure to sign up here.
Today's "Diamonds in the Rough" are: BEP, CRWD, DQ, ENPH and VEEV.
Stocks/ETFs to Review (no order): TAN, LLY, JAZZ, NEM, VRT, WFH, PTON, MELI, NET, SKLZ and SHOP.
 Diamond Mine REGISTRATION Information:
When: May 21, 2021 09:00 AM Pacific Time (US and Canada)
Topic: DecisionPoint Diamond Mine (5/21/2021) LIVE Trading Room
Register in advance for this webinar HERE.
After registering, you will receive a confirmation email containing information about joining the webinar, including the password. SAVE IT! Zoom doesn't always send out the reminders.
=======================================================================
Diamond Mine RECORDING Link **:
Topic: DecisionPoint Diamond Mine (5/14/2021) LIVE Trading Room
Start Time : May 14, 2021 08:53 AM
Meeting Recording LINK **
Access Passcode: May-14-21
** You'll have to wait briefly to be given approval to view the recording.
***Click here to register for this recurring free DecisionPoint Trading Room on Mondays at Noon ET!***
+++++++++++++++++++++++++++++++++++++++++++++++++++++++++++++++++++++++++++++++
Free DP Trading Room RECORDING LINK:
Topic: DecisionPoint Trading Room
Start Time : May 17, 2021 09:00 AM
Meeting Recording LINK.
Access Passcode: May-17th
For best results, copy and paste the access code to avoid typos.
Welcome to DecisionPoint Daily Diamonds, wherein I highlight five "diamonds in the rough." These are selected from the results of my DecisionPoint scans, which search for stocks that could benefit from the trend and condition of the market. Remember, these are not recommendations to buy or sell, but are the most interesting of the stocks that surfaced in my scans. My objective is to save you the work of the initial, tedious culling process, but you need to apply your own analysis to see if these stocks pique your interest as well. There are no guaranteed winners here!
Brookfield Renewable Partners LP (BEP)
EARNINGS: 8/3/2021 (BMO)
Brookfield Renewable Partners LP engages in owning a portfolio of renewable power generating facilities primarily in North America, Colombia, Brazil, Europe, India, and China.. It operates through following segments: Hydroelectric, Wind, Solar, Energy Transition, and Corporate. The Energy Transition segment distributes generation, pumped storage, cogeneration, and biomass. The company was founded on June 27, 2011 and is headquartered in Hamilton, Bermuda.
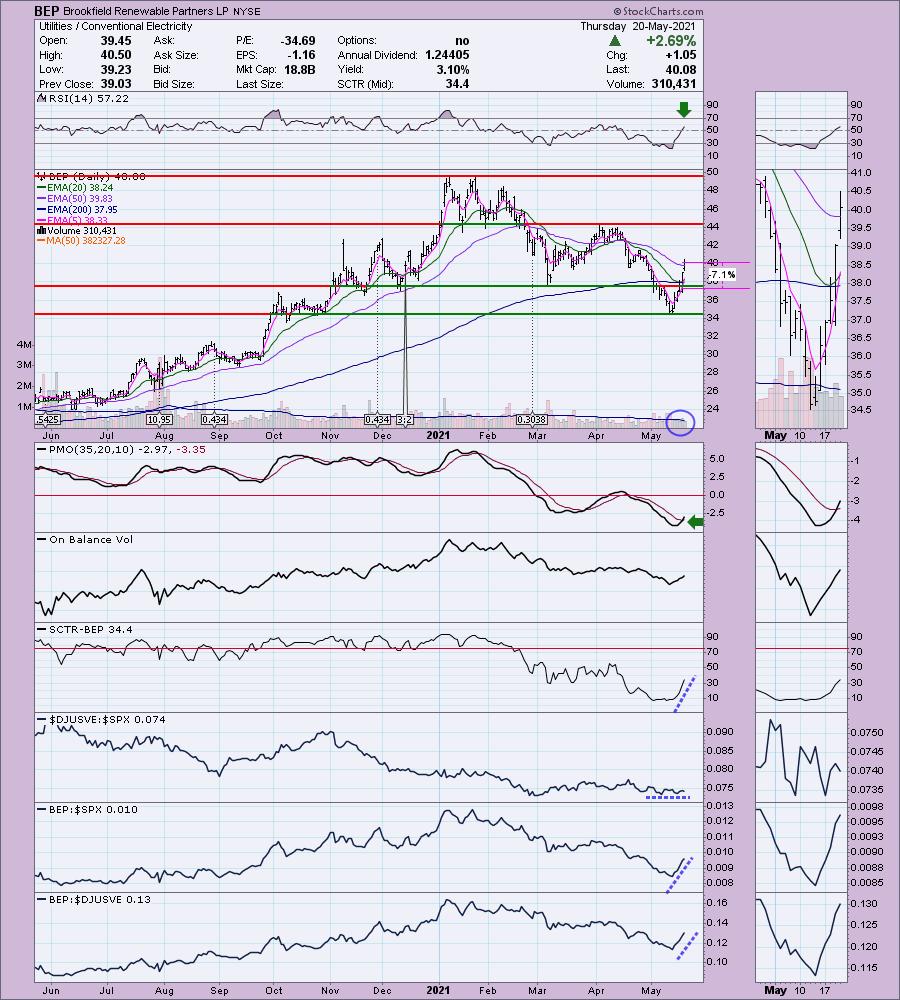
BEP is down -0.70% in after hours trading. I covered BEP in the December 28th 2020 issue of Diamonds. The stop of $37.65 was hit this month, but it was up over 19% at the January highs. There were many clues that a profit should be booked on this one, but the biggest was the failure of the February top to reach overhead resistance and the subsequent PMO crossover SELL signal. We probably should talk more about selling in the trading rooms so that one can tell when it might be time to book profits.
BEP has admittedly already rallied quite a bit. I did see this one yesterday and nearly picked it after its break above the 20-EMA. It is down in after hours trading, so better entry than today's close is likely going to be available. The RSI just moved into positive territory and price broke above the 50-EMA today. The PMO generated a crossover BUY signal today and we can see volume is coming in on this rally. While the industry group may not be outperforming, BEP is outperforming the SPX and its industry group. The SCTR is improving very quickly as well. The stop is set just below the 200-EMA.
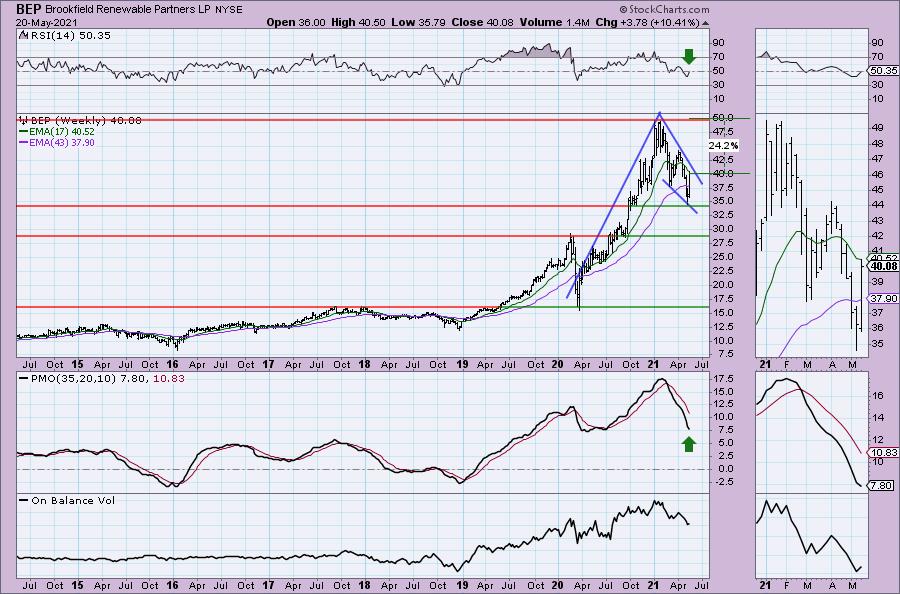
Many of these stocks are in the process of reversing so we shouldn't be surprised to see fairly ugly weekly charts today. However, there are bright spots among them all. BEP has a newly positive weekly RSI and the weekly PMO is beginning to slow its descent. There is a bullish falling wedge. Upside potential is about 24%.
CrowdStrike Holdings, Inc. (CRWD)
EARNINGS: 6/3/2021 (AMC)
CrowdStrike Holdings, Inc. is a holding company, which engages in the provision of cloud-delivered solution for next-generation endpoint protection that offers cloud modules on its Falcon platform through SaaS subscription-based model. It operates through Domestic and International geographical segments. The firm's services include incident response services; proactive services, tabletop exercises, adversary emulation, clod security assessment, and blue team exercises. The company was founded by George P. Kurtz, Marston Gregg, and Dmitri Alperovitch on November 7, 2011 and is headquartered in Sunnyvale, CA.
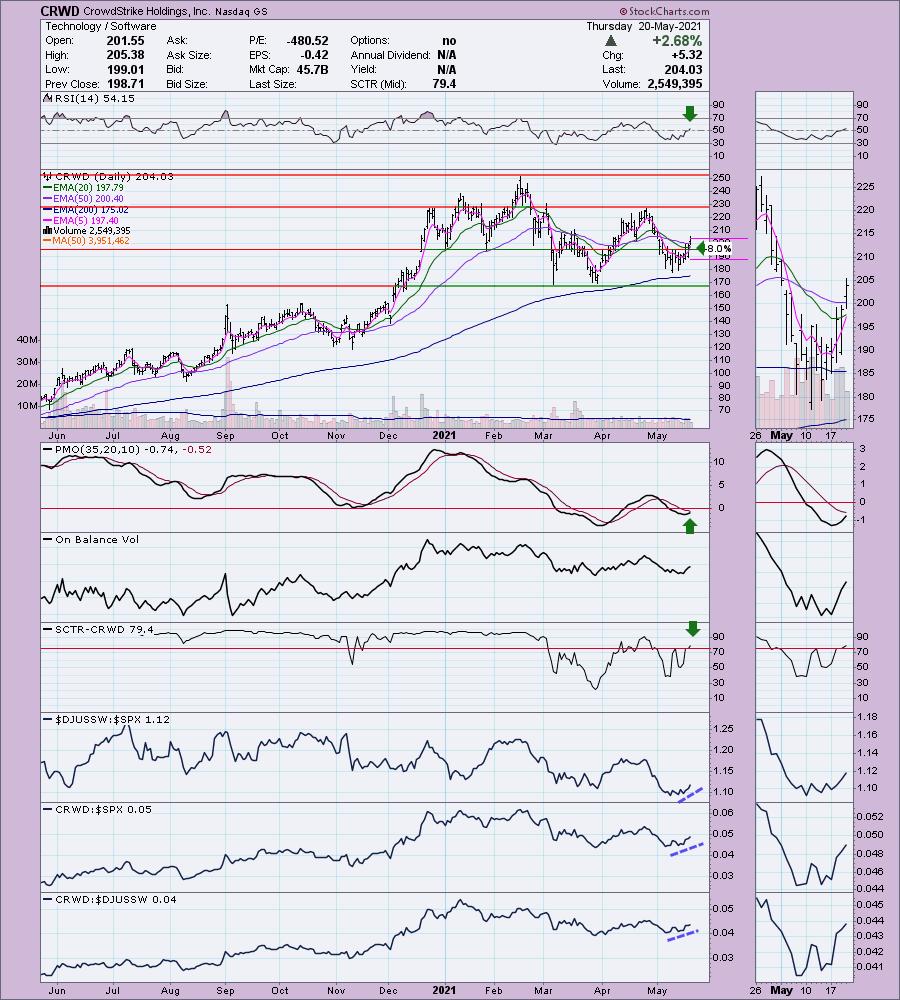
CRWD is up +0.23% in after hours trading. I covered CRWD on August 3rd 2020. Unfortunately right after picking it, it pulled back and triggered the stop. However, if I had picked it just a few days later, it would not have hit the stop and would be up over 76.7% right now. I hate it when that happens!
It looks good right now after reversing off the 200-EMA and now pushing past resistance at the 20/50-EMAs. Notice that the 5-EMA is about to cross above the 20-EMA for a ST Trend Model BUY signal. The RSI just reached positive territory and the PMO has turned up and is closing in on a crossover BUY signal. The SCTR has just reached positive territory. The group is beginning to outperform and CRWD is outperforming it and the SPX. The is set at my typical percentage of 8%. It was too deep if I moved it close to this month's lows and too shallow if I lined it up with the January lows.
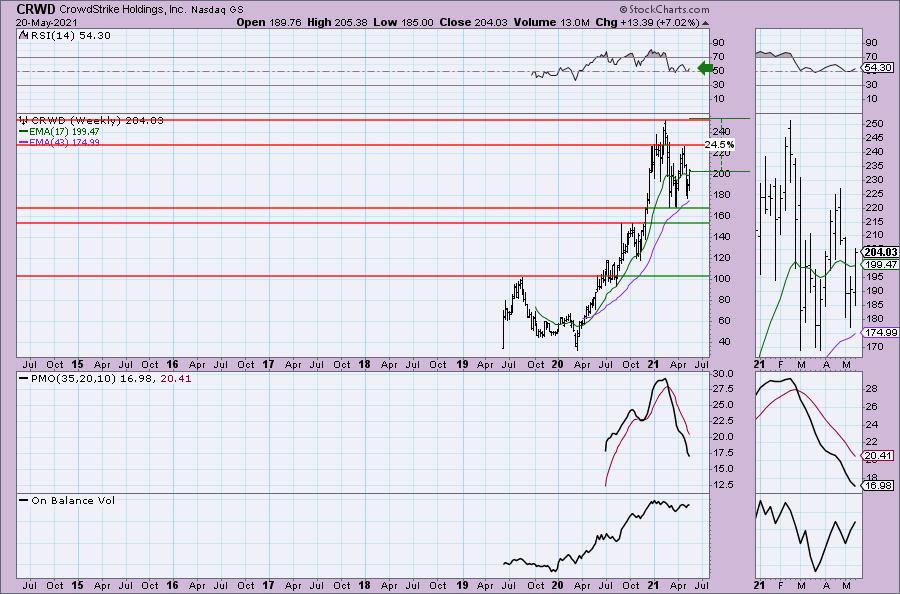
The weekly RSI is positive, but the weekly PMO is pretty ugly. I do like how price is holding above the 43-week EMA and has just moved past the 17-week EMA. Upside target gives us a 24.5% gain.
Daqo New Energy Corp. (DQ)
EARNINGS: 8/17/2021 (BMO)
Daqo New Energy Corp. is a holding company, which engages in the provision of polysilicon products. It involves in the manufacture and sale of polysilicon to photovoltaic product manufactures, who further process the polysilicon into ingots, wafers, cells, and modules for solar power solutions. The company was founded by Guang Fu Xu on November 22, 2007 and is headquartered in Shanghai, China.
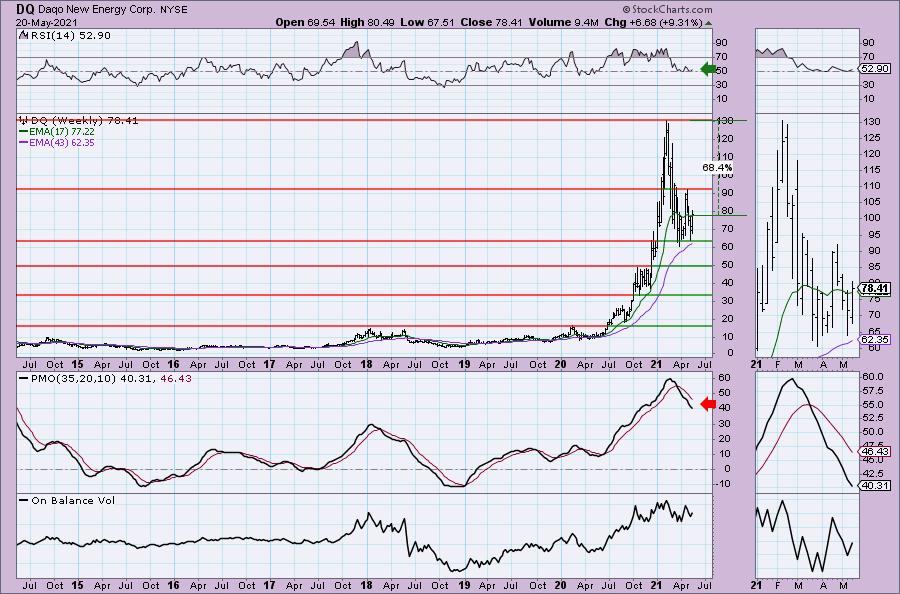
DQ is down a modest -0.01% in after hours trading. Every time I see "DQ" I think of Dairy Queen not a chemical company and now I'm hungry. Probably will get a Blizzard tonight or tomorrow now! DQ is in the process of forming a complex double-bottom (the left bottom is a little messy). The RSI is now positive and the PMO has nearly given us a positive crossover in oversold territory, just above the zero line. The 5-EMA is nearing a positive crossover the 20-EMA for a ST Trend Model BUY signal. Price pushed past the 50-EMA today. I'm not pleased to see the industry group faltering against the SPX, but I'll forgive that since it is, on its own, outperforming the SPX.
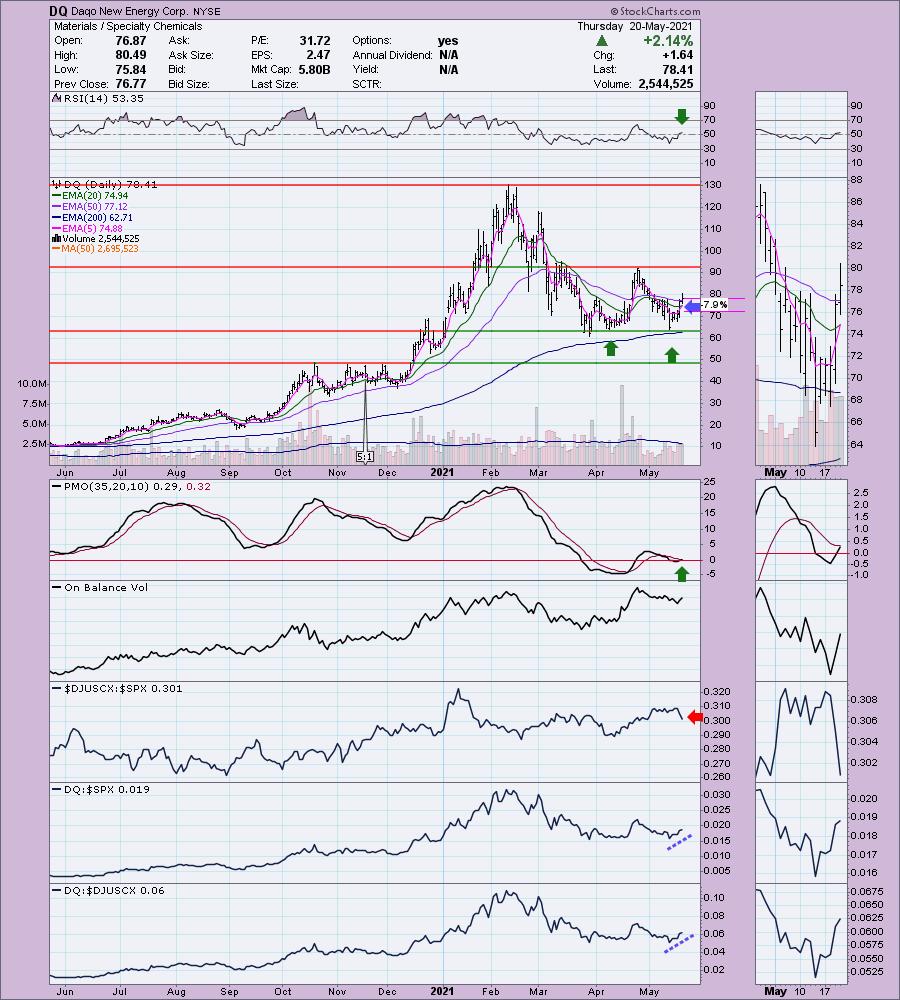
It's another rather weak weekly chart given the declining weekly PMO, but I like the bounce off the 43-week EMA. The weekly RSI is in positive territory, avoiding negative territory even after the sizable correction in the first quarter of this year. That does provide some interesting upside targets. If we go to the recent high that is about a 25% gain, but I'm greedy and want the 68.4% gain at all-time highs.
Enphase Energy Inc. (ENPH)
EARNINGS: 7/27/2021 (AMC)
Enphase Energy, Inc. engages in the design, development, manufacture and sale of micro inverter systems for the solar photovoltaic industry. Its products include IQ 7 Microinverter Series, IQ Battery, IQ Envoy, IQ Microinverter Accessories, IQ Envoy Accessories and Enlighten & Apps. The company was founded by Raghuveer R. Belur and Martin Fornage in March 2006 and is headquartered in Fremont, CA.
ENPH is down a modest -0.01% in after hours trading which doesn't offer us good entry just yet. I've covered ENPH numerous times. Here are the reports: May 4th 2020 (the 7.6% stop was hit), July 6th 2020 (Better timing here. The stop was never hit and it is up +306.7% since!) and April 27th 2020 (The 8.6% stop was hit).
Before I get into it, I was reminded by my cousin that Enphase sells the batteries, software and apps rather than actual panels like a Sunrun (RUN), but it is still considered an important part of the Renewable Energy group and is generally one of the top holdings in any solar ETF.
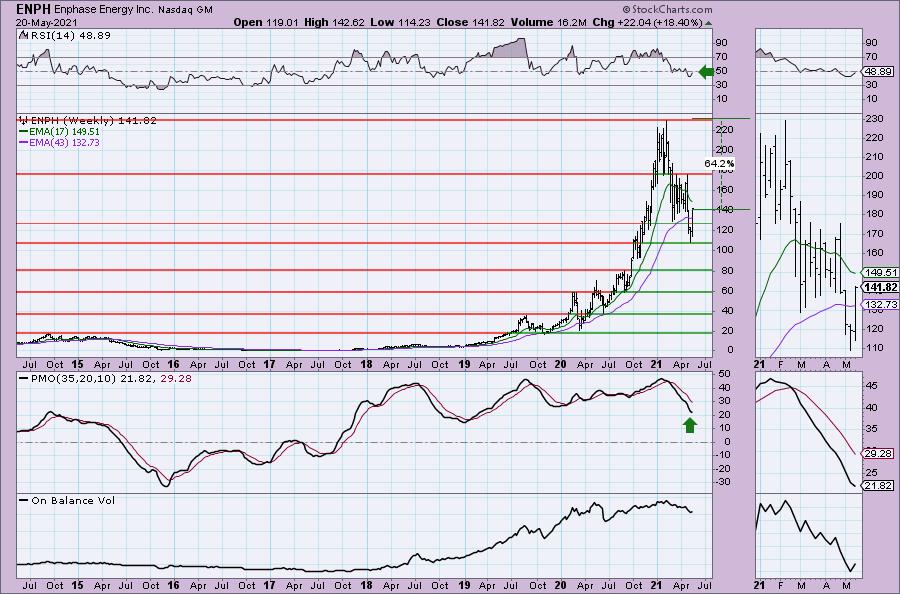
The reversal on the solar stocks right now is very convincing. Price lost support at the 200-EMA and looked like it was going to fall further. However it has turned itself around in a big way. Today big upside move put price squarely above the 20/200-EMAs and it is ready to pop through the 50-EMA. The RSI just turned positive and the PMO just gave us a crossover BUY signal. The SCTR shot up and we can see how this industry group is beginning to outperform the SPX. This is great since ENPH is outperforming the group and consequently the SPX.
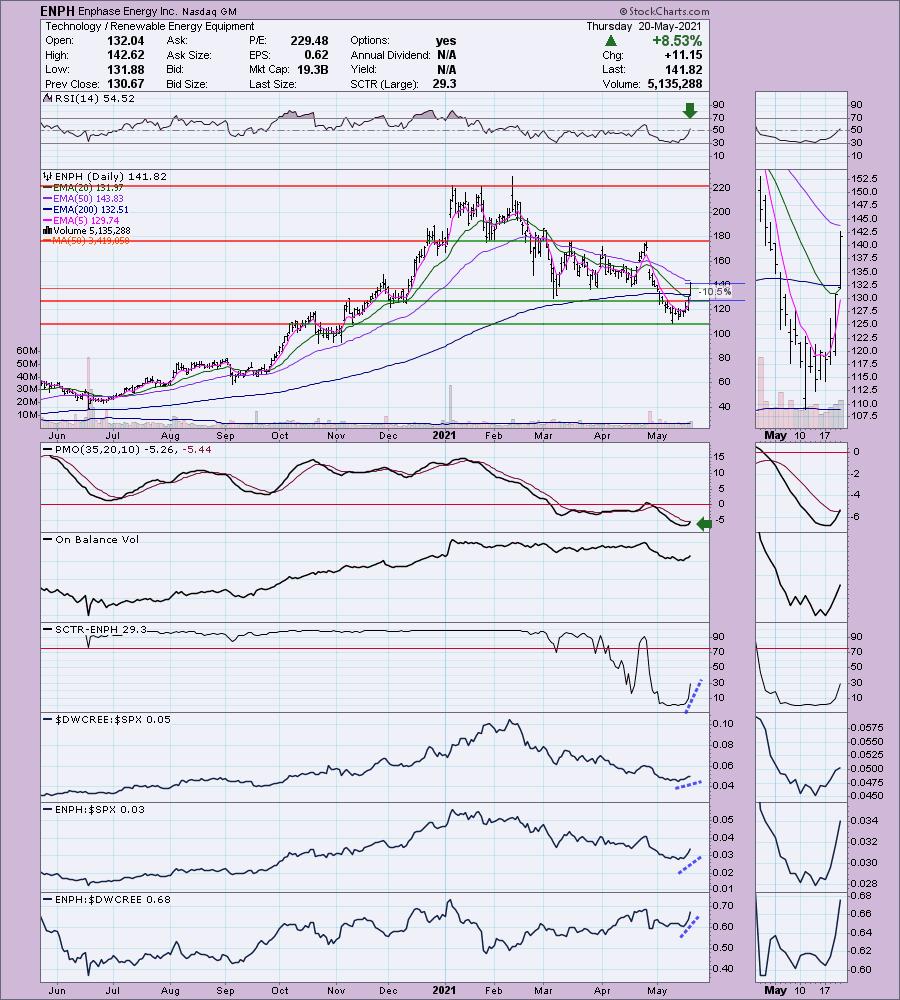
The weekly chart looks interesting. While the indicators aren't favorable, the breakout above the 43-week EMA is bullish. It may be time to give solar another try.
Veeva Systems Inc. (VEEV)
EARNINGS: 5/27/2021 (AMC)
Veeva Systems, Inc. engages in the provision of industry cloud solutions for the global life sciences industry. Its solutions enable pharmaceutical and other life sciences companies to realize the benefits of modern cloud-based architectures and mobile applications for their most critical business functions, without compromising industry-specific functionality or regulatory compliance. The firm's customer relationship management solutions enable its customers to increase the productivity and compliance of their sales and marketing functions. Its regulated content management and collaboration solutions enable its customers to more efficiently manage a regulated, content-centric processes across the enterprise. The company's customer master solution enables customers to more effectively manage complex healthcare provider and healthcare organization data. Veeva Systems was founded by Mark Armenante, Peter P. Gassner, Doug Ostler, Mitch Wallace and Matthew J. Wallach on January 12, 2007 and is headquartered in Pleasanton, CA.
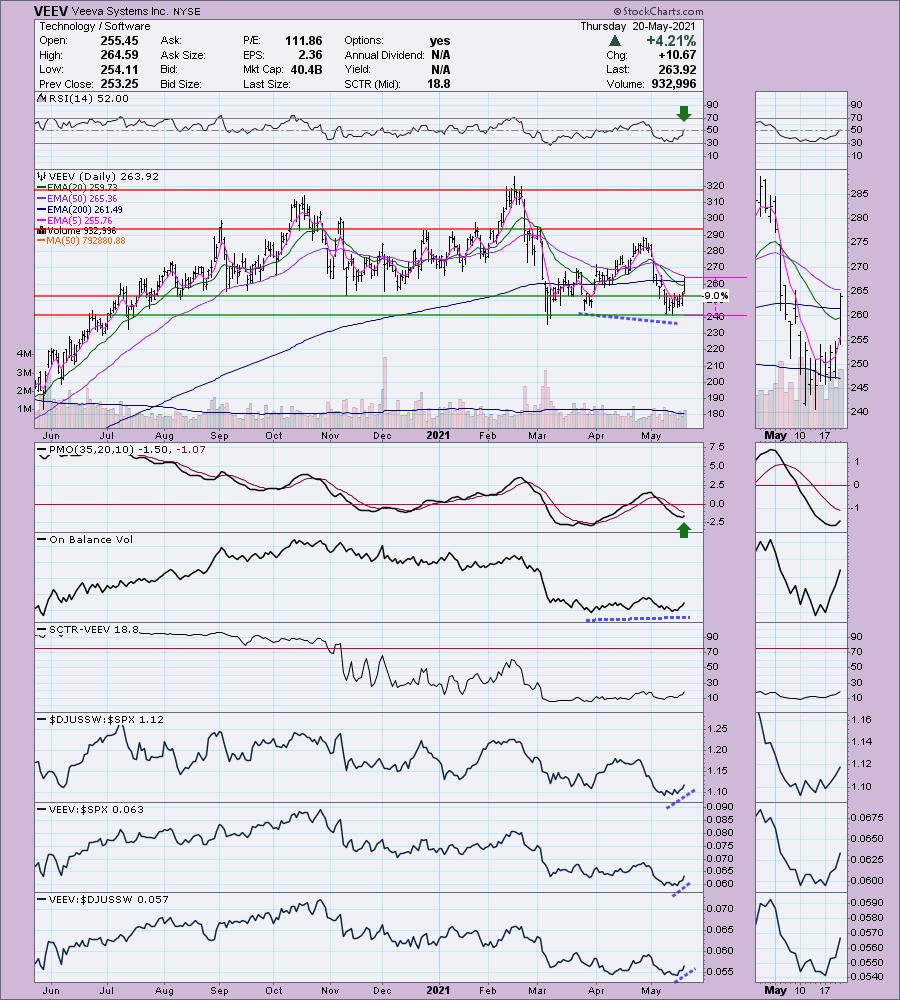
VEEV is up +0.03% in after hours trading. I covered VEEV back on April 23rd 2020. The stop was never hit so it is currently up 42.9%. The RSI has now moved into positive territory. Price is coming up against overhead resistance at the 50-EMA, but given the positive rise of the PMO and positive divergence with the OBV, I believe it won't have any trouble there. The Software group is beginning to recuperate and is starting to outperform the SPX. VEEV is outperforming both the group and the SPX. The stop is set right on supper at the May low.
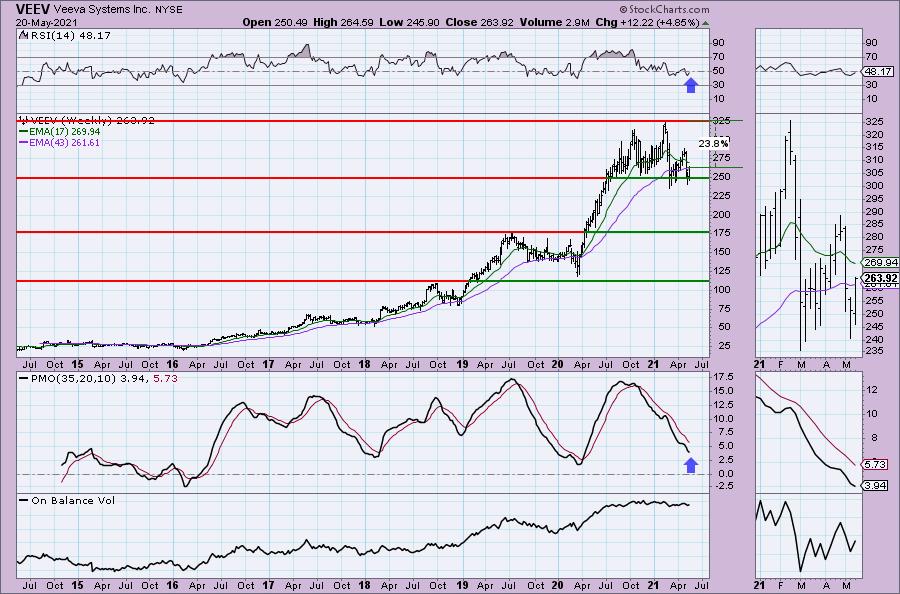
The weekly chart isn't great. The RSI is negative, albeit rising. The PMO is falling, but it does appear ready to decelerate in oversold territory. The bounce off support is encouraging and upside potential is nearly 24%.
Don't forget, on Thursdays I look at reader-requested symbols, so shoot me an email at erin@decisionpoint.com. I read every email I receive and try to answer them all!
Current Market Outlook:
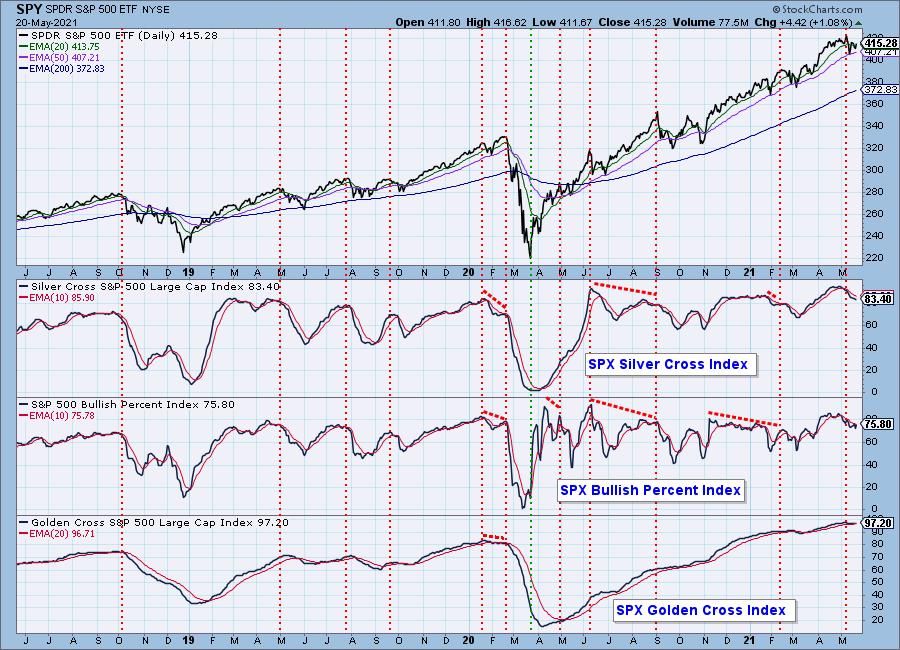
Market Environment: It is important to consider the odds for success by assessing the market tides. The following chart uses different methodologies for objectively showing the depth and trend of participation for intermediate- and long-term time frames.
- The Silver Cross Index (SCI) shows the percentage of SPX stocks on IT Trend Model BUY signals (20-EMA > 50-EMA)
- The Golden Cross Index (GCI) shows the percentage of SPX stocks on LT Trend Model BUY signals (50-EMA > 200-EMA)
- The Bullish Percent Index (BPI) shows the percentage of SPX stocks on Point & Figure BUY signals.
Don't forget that as a "Diamonds" member, you have access to our GCI/SCI curated ChartList on DecisionPoint.com. You'll find it under "Members Only" links on the left side on the Blogs and Links Page.
Here is the current chart:
Diamond Index:
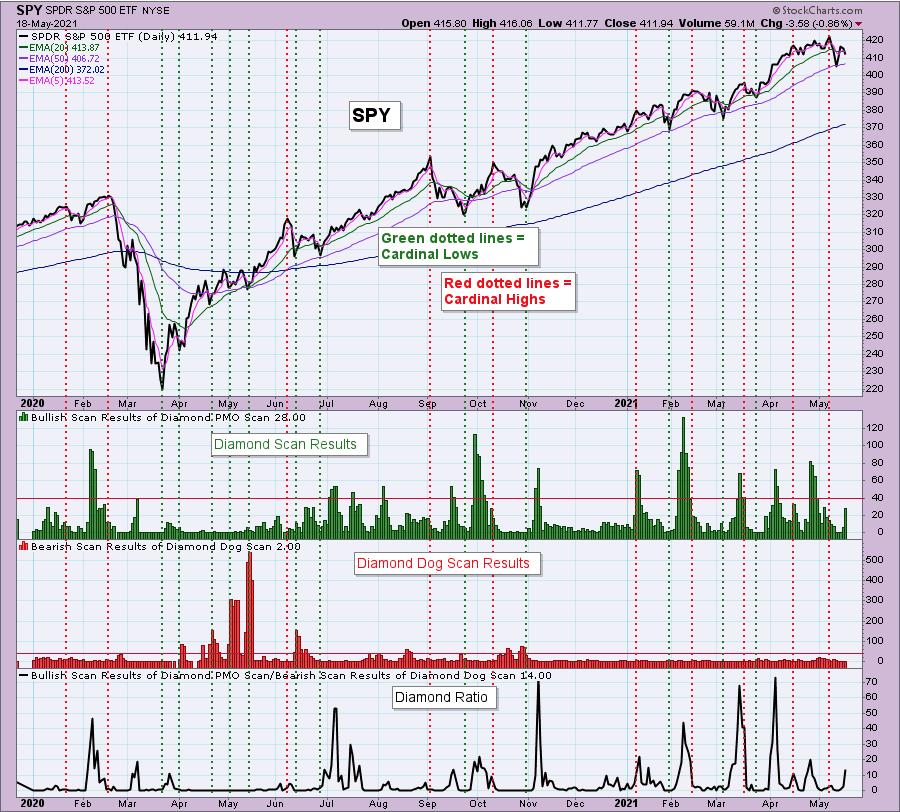
The Diamond Index chart looks at the number of scan results from my bullish Diamond PMO Scan and the number of scan results from the inverse Diamond Dog Scan. The Diamond Ratio divides the bullish results by the bearish results.
I only have data going back to October 2019 so I won't make any sweeping conclusions about the Diamond Index chart. I have marked cardinal tops with red dotted vertical lines and cardinal price bottoms with green dotted vertical lines. I believe that when the Diamond Dog results spike, it usually comes at a price bottom, or marks a strong continuation of the rising trend.
Unfortunately, the Diamond PMO Scan result numbers aren't providing much insight. The Diamond Ratio has promise, but again I don't see a clear correlation to the market tops/bottoms right now. I need to study and manipulate the data some more. Keep you posted!
Full Disclosure: I'm about 60% invested and 40% is in 'cash', meaning in money markets and readily available to trade with. Contemplating getting in on an airline tomorrow depending on 5-min candlestick and if these after hours declines become more serious.
Technical Analysis is a windsock, not a crystal ball.
Happy Charting!
- Erin
erin@decisionpoint.com
Watch the latest episode of DecisionPoint with Carl & Erin Swenlin on Mondays 7:00p EST or on the DecisionPoint playlist on the StockCharts TV YouTube channel here!
NOTE: The stocks reported herein are from mechanical trading model scans that are based upon moving average relationships, momentum and volume. DecisionPoint analysis is then applied to get five selections from the scans. The selections given should prompt readers to do a chart review using their own analysis process. This letter is not a call for a specific action to buy, sell or short any of the stocks provided. There are NO sure things or guaranteed returns on the daily selection of "diamonds in the rough."
Helpful DecisionPoint Links:
DecisionPoint Shared ChartList and DecisionPoint Chart Gallery
Price Momentum Oscillator (PMO)
Swenlin Trading Oscillators (STO-B and STO-V)
For more links, go to DecisionPoint.com
