
Yesterday I led the DecisionPoint Alert with a discussion of the Energy sector and its opportunity to begin rebounding this week. Well Energy (XLE) was up +2.78% on the day with the industry groups of Oil Services (XES) and Oil/Gas Exploration (IEO) topping our ETF Tracker list with rallies of +5.73% and +3.99% respectively.
So today I decided to do something new. I took one of my favorite scans and tailored it to look only in the Energy sector. I was pleased with the results. All three "Diamonds in the Rough" are poised to do well. One consequence is that most were up by huge percentage points and may need a pullback tomorrow.
Today's "Diamonds in the Rough" are: DCP, HAL and NBR.
Stocks/ETFs to Consider: IEO, RIG, UNG, XES and XLE.
 Diamond Mine REGISTRATION Information:
When: Apr 16, 2021 09:00 AM Pacific Time (US and Canada)
Topic: DecisionPoint Diamond Mine (04/16/2021) LIVE Trading Room
Register in advance for this webinar HERE.
After registering, you will receive a confirmation email containing information about joining the webinar, including the password.
=======================================================================
Diamond Mine RECORDING Link from 4/9/2021:
Topic: April 9th DecisionPoint Diamond Mine LIVE Trading Room
Start Time : Apr 9, 2021 08:58 AM
Meeting Recording HERE.
Access Passcode: TD6^5K^@
***Click here to register for this recurring free DecisionPoint Trading Room on Mondays at Noon ET!***
+++++++++++++++++++++++++++++++++++++++++++++++++++++++++++++++++++++++++++++++
Free DP Trading Room RECORDING LINK:
Topic: DecisionPoint Trading Room
Start Time : Apr 12, 2021 08:55 AM
Meeting Recording LINK HERE.
Access Passcode: April_12
For best results, copy and paste the access code to avoid typos.
Welcome to DecisionPoint Daily Diamonds, wherein I highlight five "diamonds in the rough." These are selected from the results of my DecisionPoint scans, which search for stocks that could benefit from the trend and condition of the market. Remember, these are not recommendations to buy or sell, but are the most interesting of the stocks that surfaced in my scans. My objective is to save you the work of the initial, tedious culling process, but you need to apply your own analysis to see if these stocks pique your interest as well. There are no guaranteed winners here!
DCP Midstream, LP (DCP)
EARNINGS: 5/5/2021 (AMC)
DCP Midstream LP engages in the business of gathering, compressing, treating, processing, transporting, storing and selling natural gas. It operates through the following segments: Logistics and Marketing and Gathering and Processing. The Logistics and Marketing segment includes transporting, trading, marketing and storing natural gas and NGLs and fractionating NGLs. The Gathering and Processing segment consists of gathering, compressing, treating and processing natural gas, producing and fractionating NGLs and recovering condensate. The company was founded in August 2005 and is headquartered in Denver, CO.
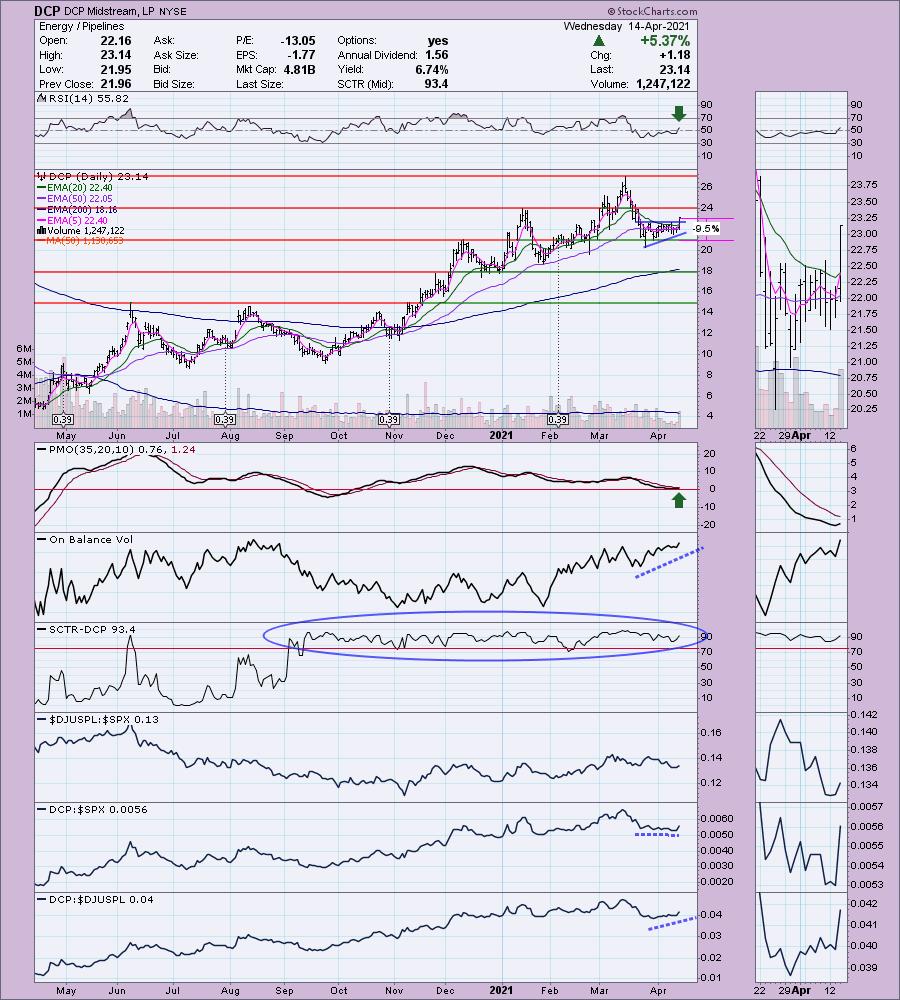
DCP is unchanged in after hours trading. This chart looks very much like USO which I review everyday in the DP Alert. I've liked the bullish ascending triangle that has been forming on Crude Oil and this chart looks very similar. Today's breakout was strong and price closed on its high for the day. The breakout executes the pattern which 'back of the napkin' has upside target around $25. If it reaches that level, it will have broken above the January high, so I would expect a continuation from there. The RSI just went positive and the PMO turned up today. We're in this one early. The OBV is confirming the breakout. DCP has a very strong SCTR. It hasn't been performing that well against the SPX, but neither has its industry group.
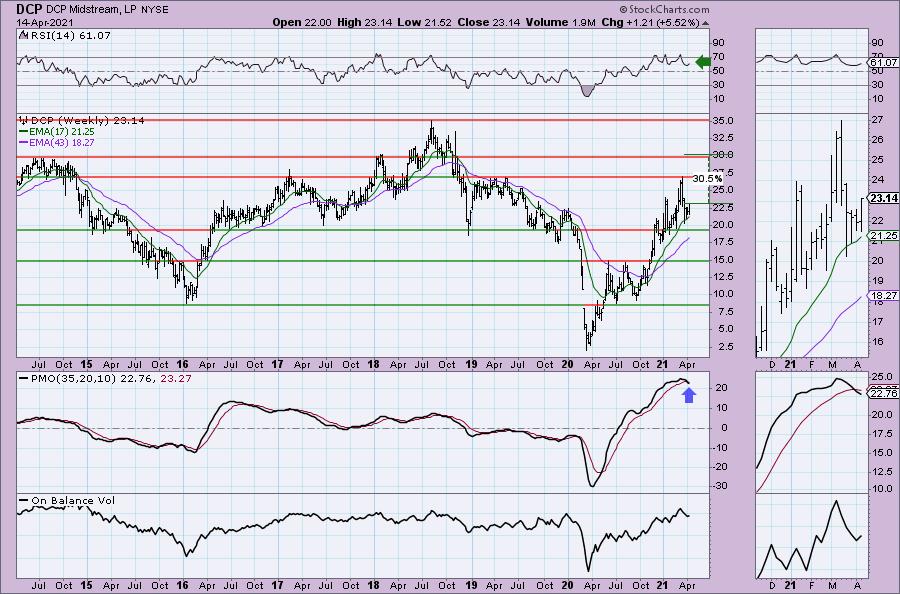
The weekly PMO did just trigger a crossover SELL signal, but it is already decelerating. The RSI is positive. Upside potential is at the 2014 high, but I see it as possibly going back and testing the 2018 high.
Halliburton Co. (HAL)
EARNINGS: 4/21/2021 (BMO)
Halliburton Co. engages in the provision of services and products to the energy industry related to the exploration, development and production of oil and natural gas. It operates through the following segments: Completion and Production and Drilling and Evaluation. The Completion and Production segment delivers cementing, stimulation, intervention, pressure control, specialty chemicals, artificial lift and completion services. The Drilling and Evaluation segment provides field and reservoir modeling, drilling, evaluation and wellbore placement solutions that enable customers to model, measure and optimize their well construction activities. The company was founded by Erle P. Halliburton in 1919 and is headquartered in Houston, TX.
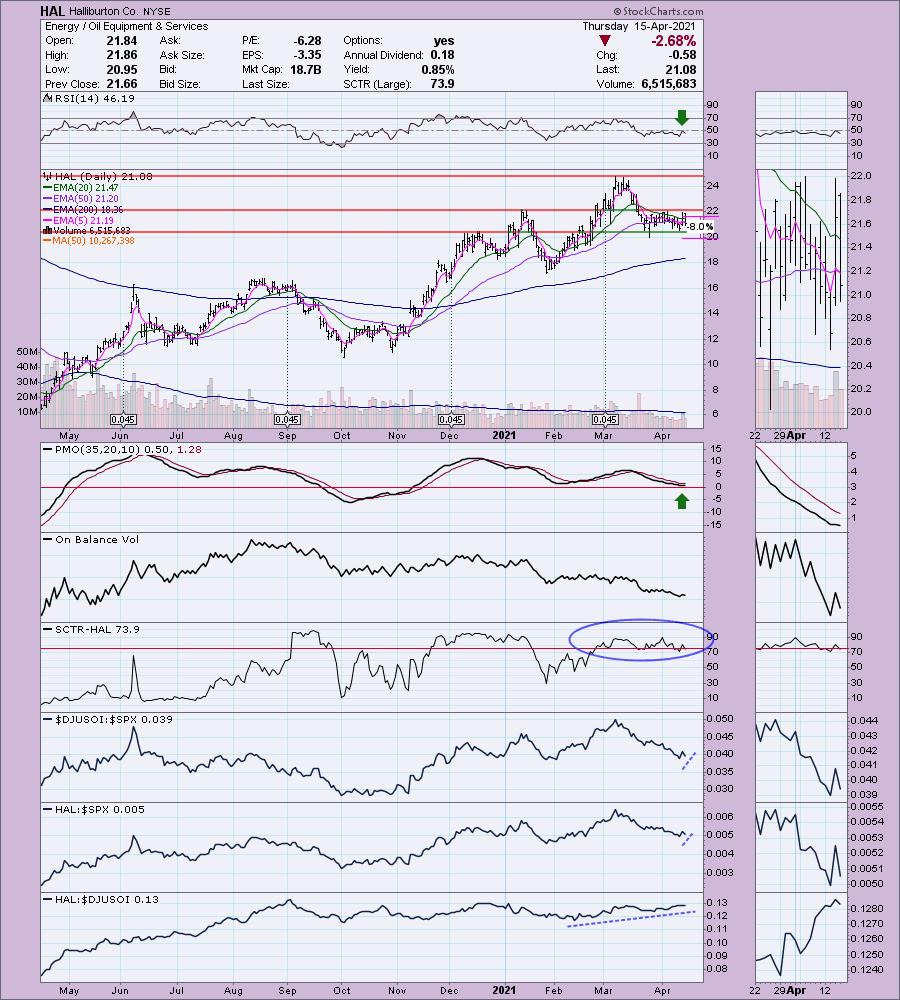
HAL is up +0.14% in after hours trading. I covered HAL in the January 6th 2021 Diamonds Report. It was up a little over 6% and then it crashed so the 9.5% stop at $19 was hit. Notice also that HAL reports earnings on 4/21. While we don't have a breakout from the trading range or January high, it's telling us it wants to. The RSI just turned positive, the PMO turned up today and it has a respectable SCTR ranking. It's one of the stronger stocks in its industry group and is now beginning to outperform the SPX. The stop level is just below $20 at the March low.
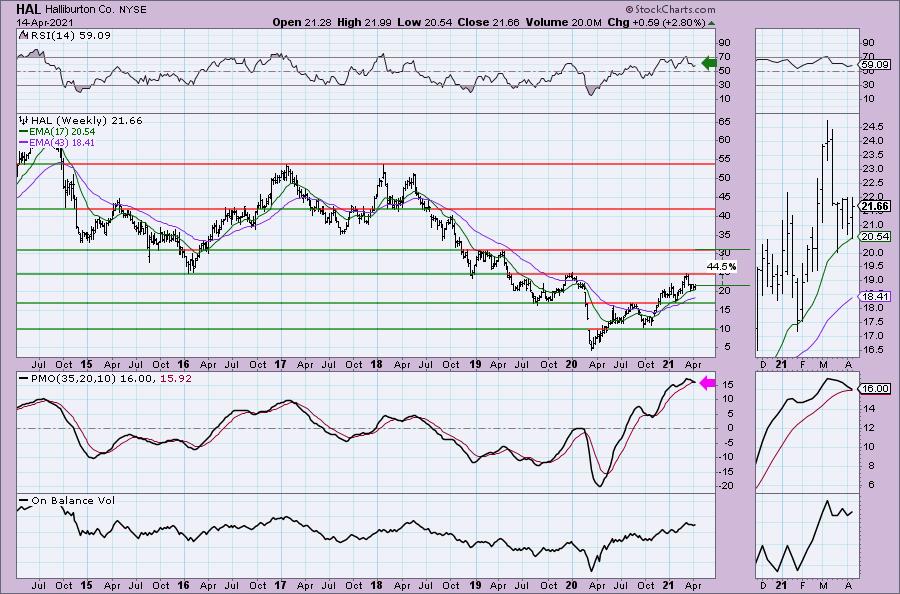
The weekly PMO has turned over, but hasn't actually triggered the crossover SELL signal. The RSI remains positive and price is staying above the 17-week EMA. Upside potential is about 45% if it reaches its 2019 high.
Nabors Industries, Inc. (NBR)
EARNINGS: 4/28/2021 (AMC)
Nabors Industries Ltd. engages in the provision of platform work over and drilling rigs. It operates through the following segments: U.S. Drilling, Canada Drilling, International Drilling, Drilling Solutions, and Rig Technologies. The U.S. Drilling segment includes land drilling activities in the lower 48 states and Alaska, as well as offshore operations in the Gulf of Mexico. The Canada segment consists of land-based drilling rigs in Canada. The International segment focuses in maintaining a footprint in the oil and gas market, most notably in Saudi Arabia, Algeria, Argentina, Colombia, Kazakhstan, and Venezuela. The Drilling Solutions segment offers drilling technologies, such as patented steering systems and rig instrumentation software systems that enhance drilling performance and wellbore placement. The Rig Technologies segment comprises Canrig, which manufactures and sells top drives, catwalks, wrenches, drawworks, and drilling related equipment, such as robotic systems and downhole tools. The company was founded by Clair Nabors in 1952 and is headquartered in Hamilton, Bermuda.
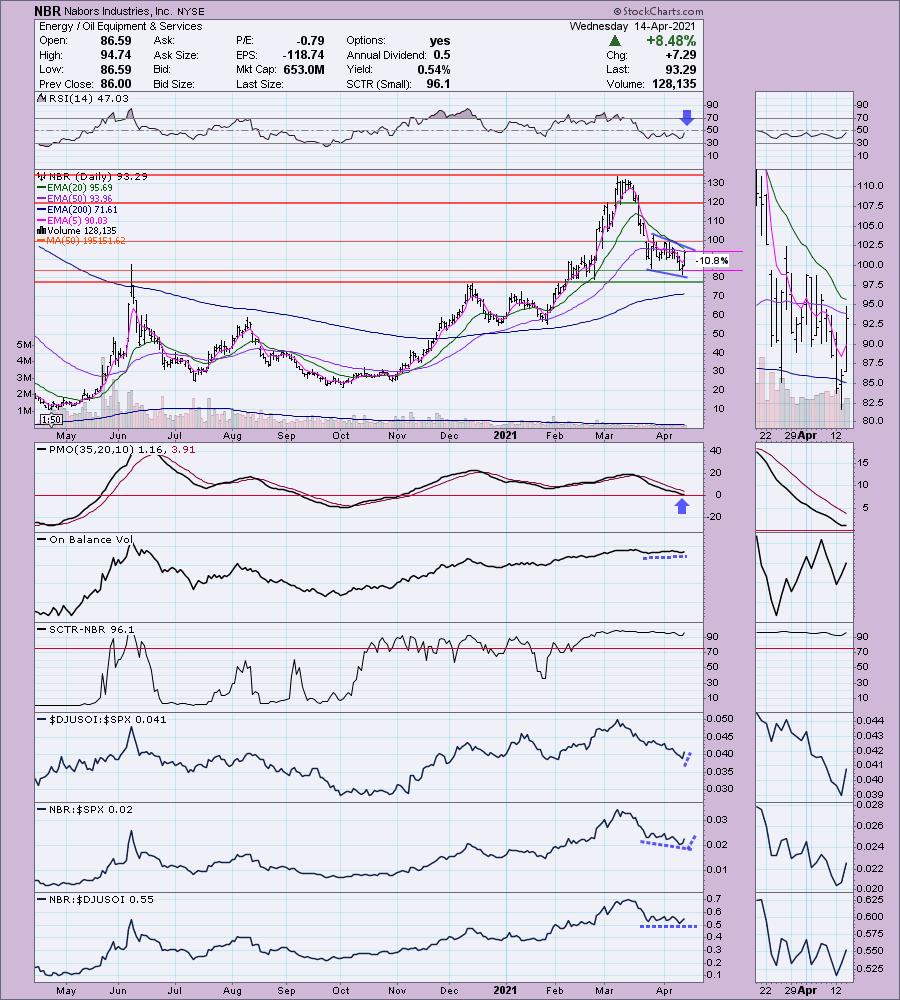
NBR is down -2.30% in after hours trading so a better entry will be available, just watch to make sure the PMO doesn't crash. This one is probably the weakest of the three today, but the upside potential was just too hard to pass up. We're bottom fishing as early birds. Consider a small position in case the chart goes south. I like the bullish falling wedge and the positive divergence on the OBV. The pattern has not actually resolved to the upside and the RSI is still negative (though rising). The PMO turned up on today's big rally. Performance hasn't been great, but it has been beat down. This week it is beginning to outperform.
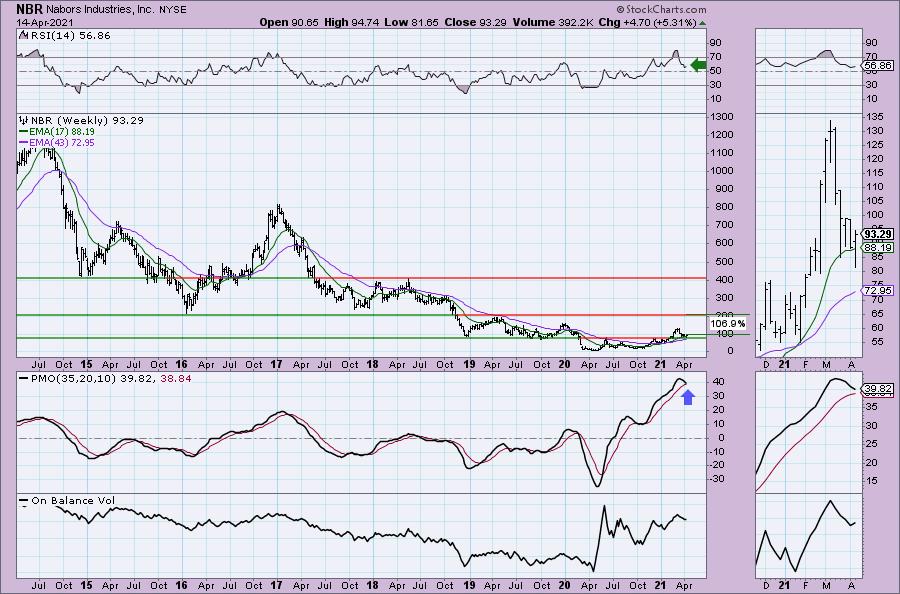
Here's what had me present this one. If it can reach its 2019 high, that would be over a 100% gain. The PMO has topped, but we can see that it is already trying to decelerate to avoid the signal. This bounce has also come off strong support.
United States Natural Gas Fund (UNG)
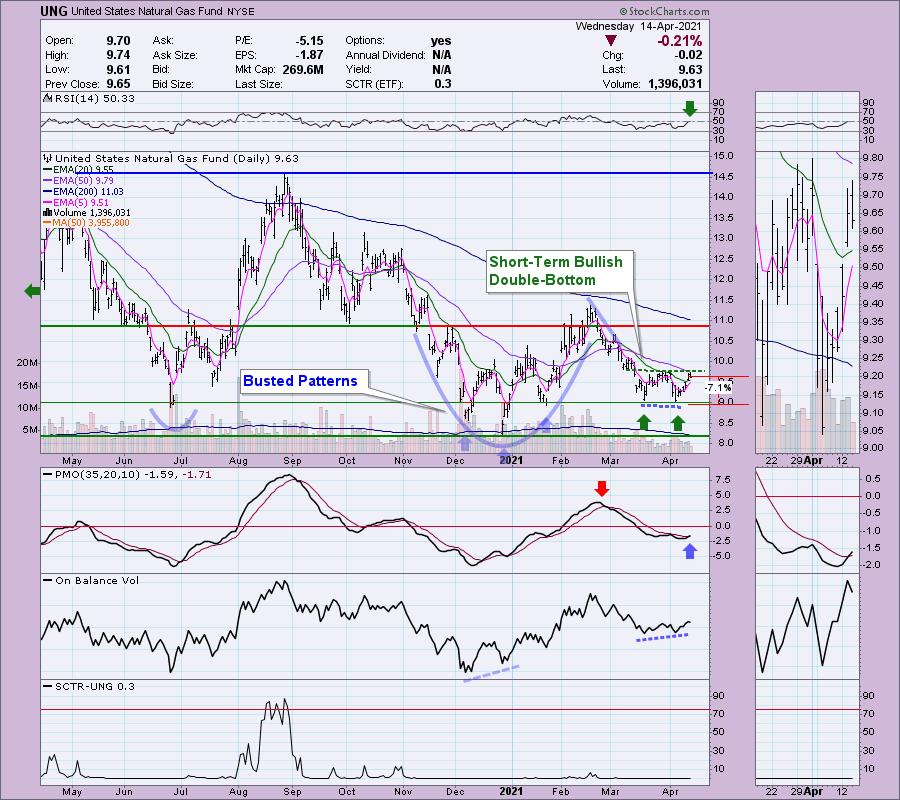
Here's a peek at the UNG chart I'll be looking at in the DP Alert. There is a new short-term double-bottom, PMO BUY signal and positive RSI.
Don't forget, on Thursdays I look at reader-requested symbols, so shoot me an email at erin@decisionpoint.com. I read every email I receive and try to answer them all!
Full Disclosure: I'm about 80% invested and 20% is in 'cash', meaning in money markets and readily available to trade with. I have limit orders in for DCP and UNG. Yeah, I'm going to punish myself again with UNG. I have NBR on my radar.
Current Market Outlook:
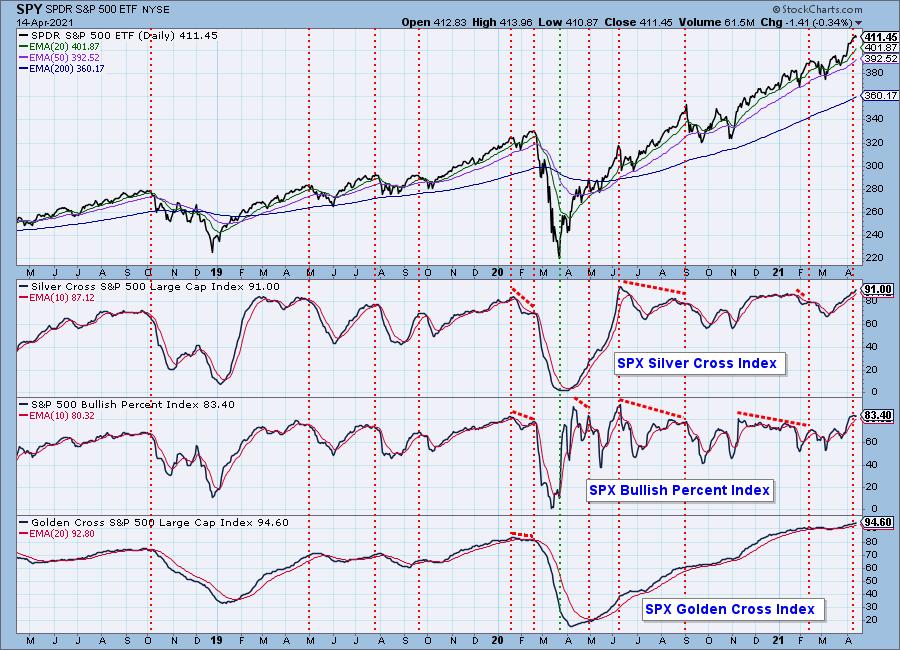
Market Environment: It is important to consider the odds for success by assessing the market tides. The following chart uses different methodologies for objectively showing the depth and trend of participation for intermediate- and long-term time frames.
- The Silver Cross Index (SCI) shows the percentage of SPX stocks on IT Trend Model BUY signals (20-EMA > 50-EMA)
- The Golden Cross Index (GCI) shows the percentage of SPX stocks on LT Trend Model BUY signals (50-EMA > 200-EMA)
- The Bullish Percent Index (BPI) shows the percentage of SPX stocks on Point & Figure BUY signals.
Don't forget that as a "Diamonds" member, you have access to our GCI/SCI curated ChartList on DecisionPoint.com. You'll find it under "Members Only" links on the left side on the Blogs and Links Page.
Here is the current chart:
Diamond Index:
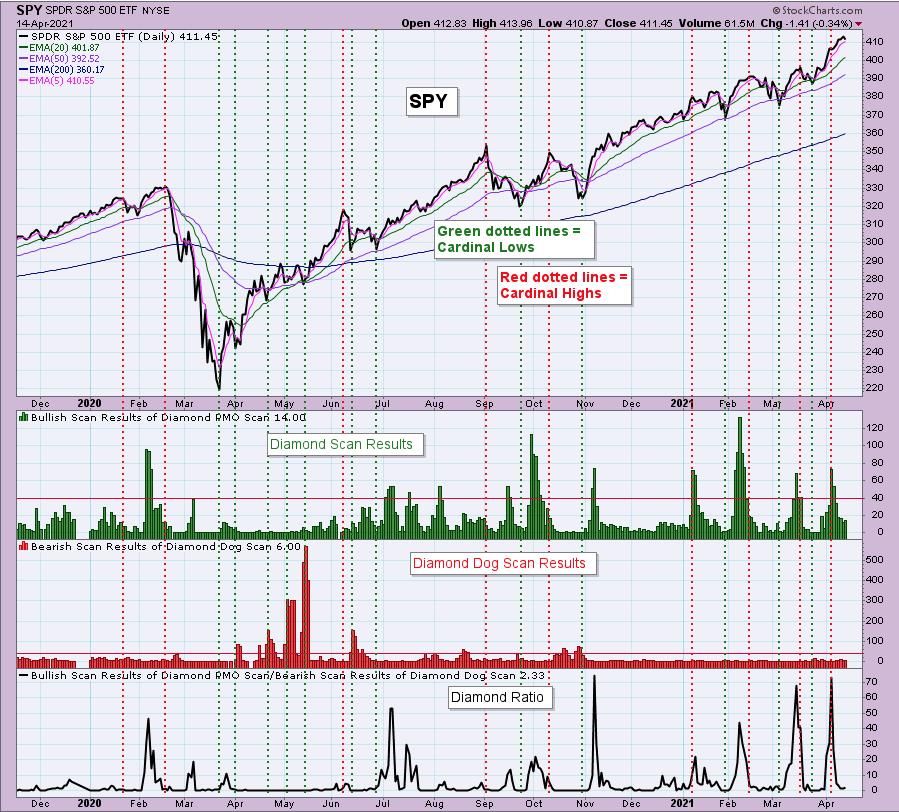
The Diamond Index chart looks at the number of scan results from my bullish Diamond PMO Scan and the number of scan results from the inverse Diamond Dog Scan. The Diamond Ratio divides the bullish results by the bearish results.
I only have data going back to October 2019 so I won't make any sweeping conclusions about the Diamond Index chart. I have marked cardinal tops with red dotted vertical lines and cardinal price bottoms with green dotted vertical lines. I believe that when the Diamond Dog results spike, it usually comes at a price bottom, or marks a strong continuation of the rising trend.
Unfortunately, the Diamond PMO Scan result numbers aren't providing much insight. The Diamond Ratio has promise, but again I don't see a clear correlation to the market tops/bottoms right now. I need to study and manipulate the data some more. Keep you posted!
Technical Analysis is a windsock, not a crystal ball.
Happy Charting!
- Erin
erin@decisionpoint.com
Watch the latest episode of DecisionPoint with Carl & Erin Swenlin on Mondays 7:00p EST or on the DecisionPoint playlist on the StockCharts TV YouTube channel here!
NOTE: The stocks reported herein are from mechanical trading model scans that are based upon moving average relationships, momentum and volume. DecisionPoint analysis is then applied to get five selections from the scans. The selections given should prompt readers to do a chart review using their own analysis process. This letter is not a call for a specific action to buy, sell or short any of the stocks provided. There are NO sure things or guaranteed returns on the daily selection of "diamonds in the rough."
Helpful DecisionPoint Links:
DecisionPoint Shared ChartList and DecisionPoint Chart Gallery
Price Momentum Oscillator (PMO)
Swenlin Trading Oscillators (STO-B and STO-V)
For more links, go to DecisionPoint.com!
