
I have some interesting "Diamonds in the Rough" today. First off I have an ETF that is breaking out of a consolidation zone with plenty of upside potential. Next, we have a low-priced stock with even more upside potential. Finally, you'll find a stock that is breaking out and in a group that is in the defensive Consumer Staples sector.
The market is continuing higher, but I have concerns in the short term--hence the pick from Consumer Staples. Be sure to read the DP Alert today or review our DPA ChartList on the website. Pay particular attention to the short-term Swenlin Trading Oscillators (STOs).
Today's "Diamonds in the Rough" are: IBUY, LUNA and MED.
Stocks to Consider: MCY, CALX and BC.
 Diamond Mine REGISTRATION Information:
When: Apr 16, 2021 09:00 AM Pacific Time (US and Canada)
Topic: DecisionPoint Diamond Mine (04/16/2021) LIVE Trading Room
Register in advance for this webinar HERE.
After registering, you will receive a confirmation email containing information about joining the webinar, including the password.
=======================================================================
Diamond Mine RECORDING Link from 4/9/2021:
Topic: April 9th DecisionPoint Diamond Mine LIVE Trading Room
Start Time : Apr 9, 2021 08:58 AM
Meeting Recording HERE.
Access Passcode: TD6^5K^@
***Click here to register for this recurring free DecisionPoint Trading Room on Mondays at Noon ET!***
+++++++++++++++++++++++++++++++++++++++++++++++++++++++++++++++++++++++++++++++
Free DP Trading Room RECORDING LINK:
Topic: DecisionPoint Trading Room
Start Time : Apr 12, 2021 08:55 AM
Meeting Recording LINK HERE.
Access Passcode: April_12
For best results, copy and paste the access code to avoid typos.
Welcome to DecisionPoint Daily Diamonds, wherein I highlight five "diamonds in the rough." These are selected from the results of my DecisionPoint scans, which search for stocks that could benefit from the trend and condition of the market. Remember, these are not recommendations to buy or sell, but are the most interesting of the stocks that surfaced in my scans. My objective is to save you the work of the initial, tedious culling process, but you need to apply your own analysis to see if these stocks pique your interest as well. There are no guaranteed winners here!
Amplify Online Retail ETF (IBUY)
EARNINGS: N/A
IBUY tracks an index of global stocks issued by firms with revenues dominated by online retail sales. Stocks are equally weighted within two geographic buckets.

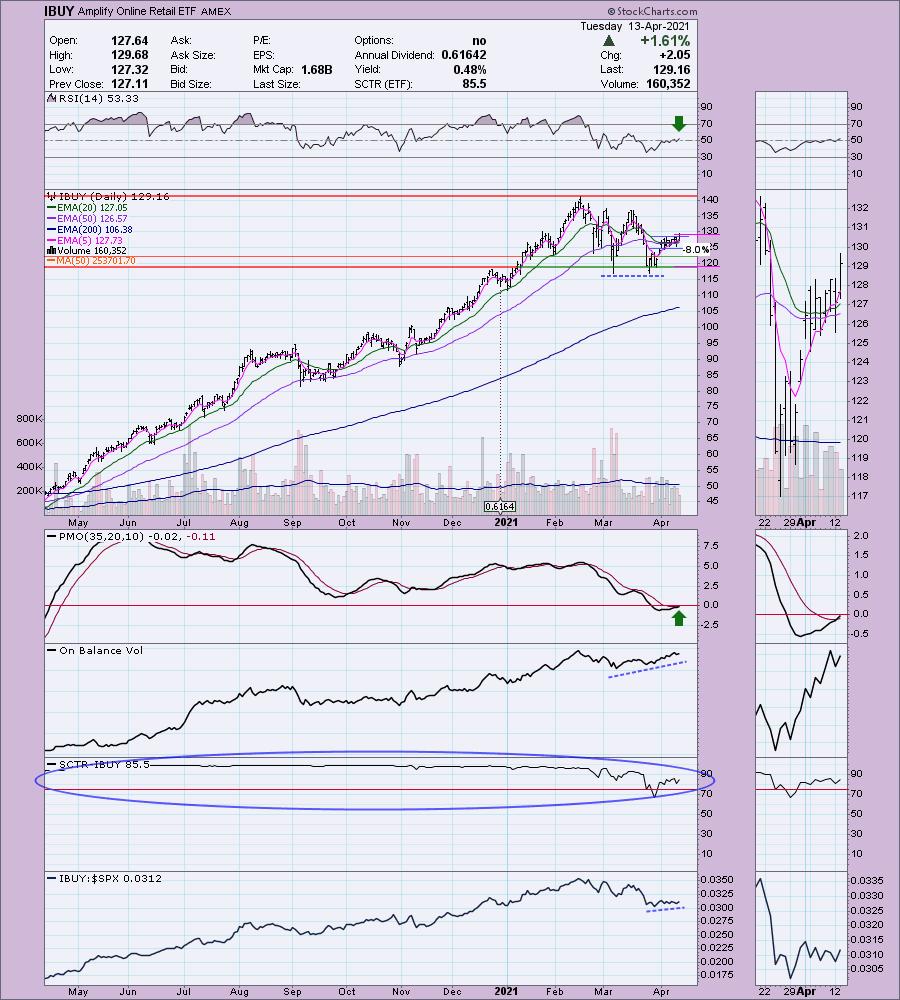
IBUY is down -0.50% in after hours trading. I like this ETF for a number of reasons. Looking at the holdings above, I like their exposure right now on the "reopening of America" theme. The price chart is enticing. We have a nice breakout today from a tight trading range. The 20-EMA avoided a negative crossover. The PMO just triggered a crossover BUY signal. The RSI has just entered positive territory. There is a slight positive divergence with the OBV (price lows are mostly even while OBV bottoms are rising). It's been performing satisfactorily against the SPX, but the SCTR has looked great all year. The stop is set at the December top, but you could go for a deeper 11% stop to bring you below strong support at the March lows.
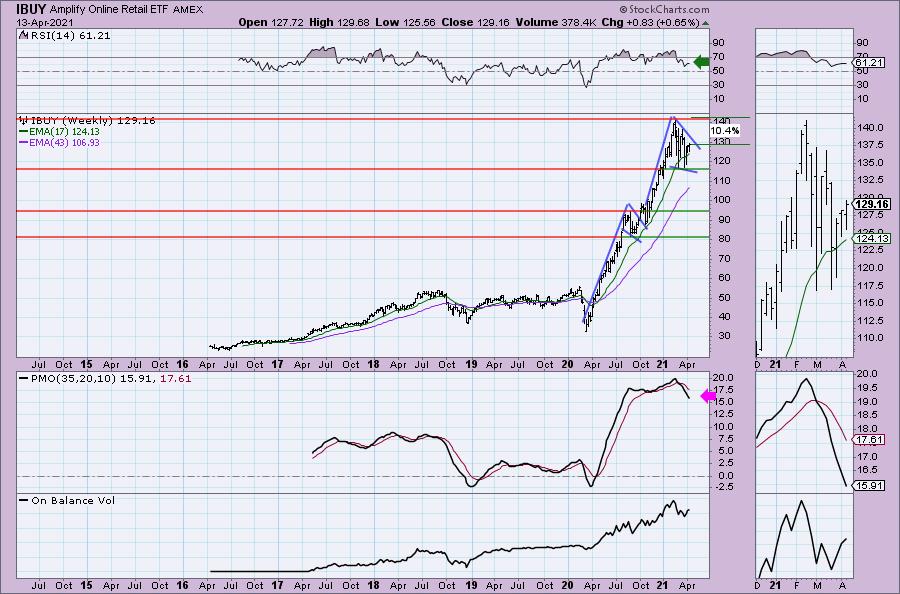
I am not a fan of the weekly PMO, but we do have a positive RSI. I've also annotated a second bull flag formation. The breakout hasn't quite occurred but it is close. Upside potential is far more than 10.4%, I am looking for all-time highs plus.
Luna Innovations Inc. (LUNA)
EARNINGS: 5/6/2021 (AMC)
Luna Innovations, Inc. engages in the development and manufacture of fiber optic test and measurement, sensing and instrumentation products for the automotive, aerospace, energy and infrastructure industries. It operates through the following segments: Lightwave and Luna Labs. The Lightwave segment develops, manufactures and markets distributed fiber optic sensing products and fiber optic communications test and control products. The Luna Labs segment performs applied research principally in the areas of sensing and instrumentation, advanced materials and health science. The company was founded by Kent A. Murphy in July 1990 and is headquartered in Roanoke, VA.
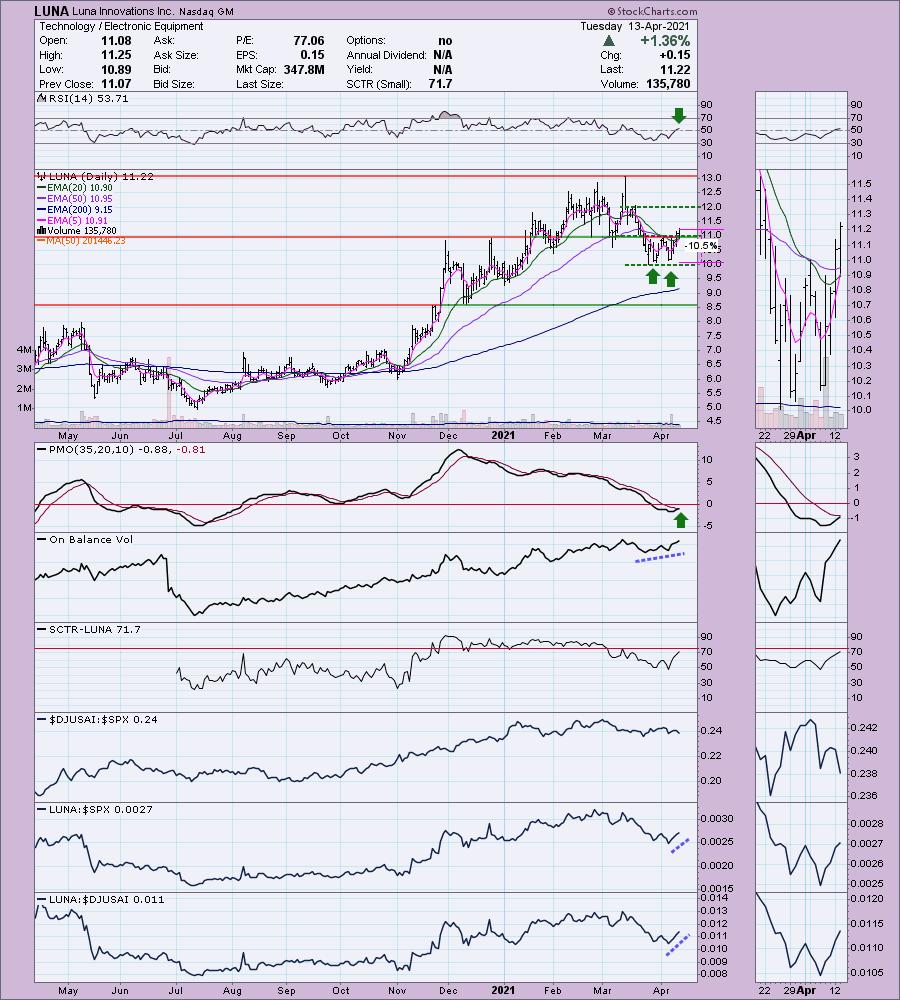
LUNA is down -1.87% in after hours trading, basically reclaiming all of today's gain plus some. Be sure and give this one a close review and position size appropriately on this low priced bargain. You can see why I love this chart. RSI has just moved positive. The PMO is nearing a crossover BUY signal and the SCTR is nearing the "hot zone" above 75. I like its outperformance as well. There is a double-bottom formation and yesterday's breakout put it above the confirmation line. Today's follow-through looks good. It triggered a Short-Term Trend Model BUY signal when the 5-EMA crossed above the 20-EMA today. I'm not happy to see that it is down in after hours trading, but that doesn't always translate to trading the next day. As long as it stays above the 20-EMA I'll be happy.
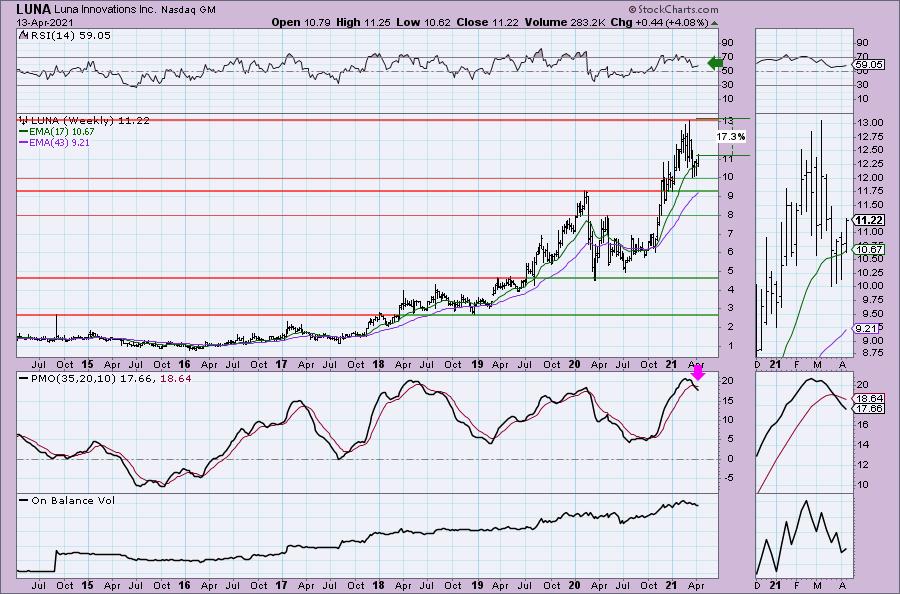
I like that price didn't have to go all the way down to support at $9 before rebounding. The weekly RSI is positive. As I've noted many times, most of the "diamond in the rough" charts are going to have declining weekly PMOs as we're trying to pick them up after corrections or pullbacks. This one is no exception.
Medifast, Inc. (MED)
EARNINGS: 5/5/2021 (AMC)
Medifast, Inc. engages in the provision of healthy living products and programs. It offers the OPTAVIA brand-a highly competitive and effective lifestyle solution centered on developing new healthy habits through smaller, foundational changes called micro-habits. The company was founded by William Vitale in 1981 and is headquartered in Baltimore, MD.
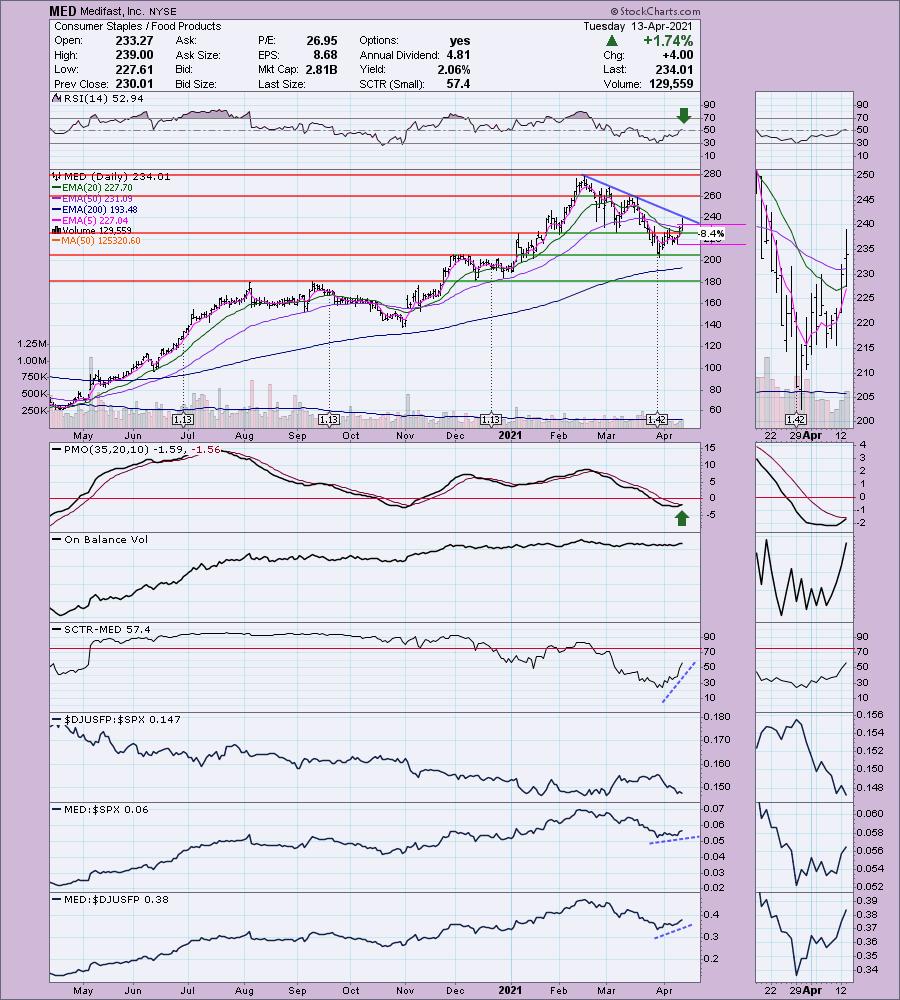
MED is down -1.29% in after hours trading which is also shaving some of today's profits away. However, I still like the chart. Newly positive RSI, PMO nearing a crossover BUY signal and price preparing to break its declining trend. It is outperforming the SPX and its industry group. This is a more defensive play given its category, but its theme of "healthy living products and programs" isn't quite so defensive. The stop was a little tricky as I didn't want it to be too deep, so I set it at around $215 which you can see in the thumbnail is just below last week's lows.
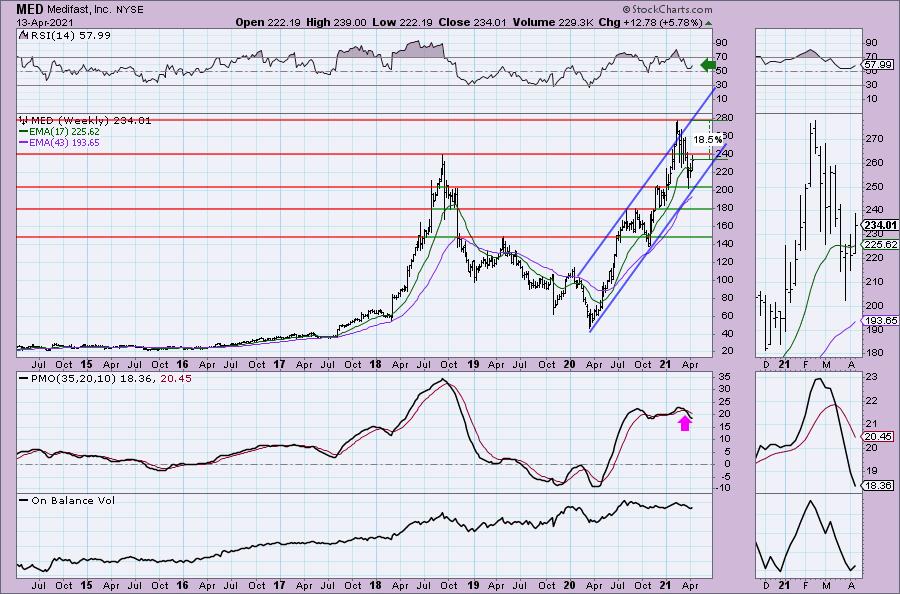
There is a rising trend channel and price is now bouncing off the bottom of it. The RSI is positive. The PMO isn't good, but it looks like it may be decelerating very slightly.
Don't forget, on Thursdays I look at reader-requested symbols, so shoot me an email at erin@decisionpoint.com. I read every email I receive and try to answer them all!
Full Disclosure: I'm about 80% invested and 20% is in 'cash', meaning in money markets and readily available to trade with. I'm out of solar and it feels good. I'll keep watching. Sold RAD XME and added prior diamond TSLA. I believe that covers it for diamond purchases/sales required for full disclosure.
Current Market Outlook:
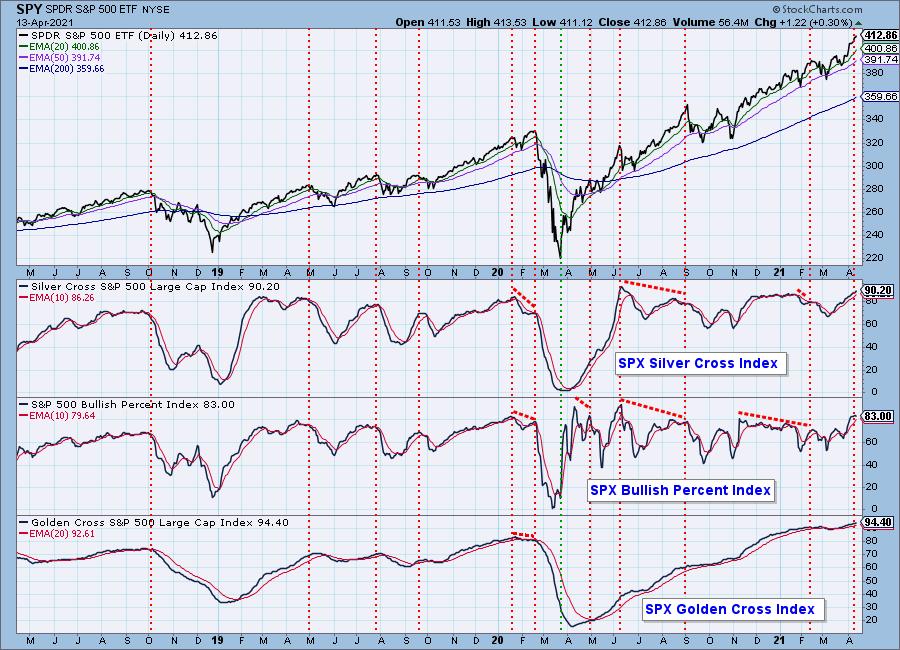
Market Environment: It is important to consider the odds for success by assessing the market tides. The following chart uses different methodologies for objectively showing the depth and trend of participation for intermediate- and long-term time frames.
- The Silver Cross Index (SCI) shows the percentage of SPX stocks on IT Trend Model BUY signals (20-EMA > 50-EMA)
- The Golden Cross Index (GCI) shows the percentage of SPX stocks on LT Trend Model BUY signals (50-EMA > 200-EMA)
- The Bullish Percent Index (BPI) shows the percentage of SPX stocks on Point & Figure BUY signals.
Don't forget that as a "Diamonds" member, you have access to our GCI/SCI curated ChartList on DecisionPoint.com. You'll find it under "Members Only" links on the left side on the Blogs and Links Page.
Here is the current chart:
Diamond Index:
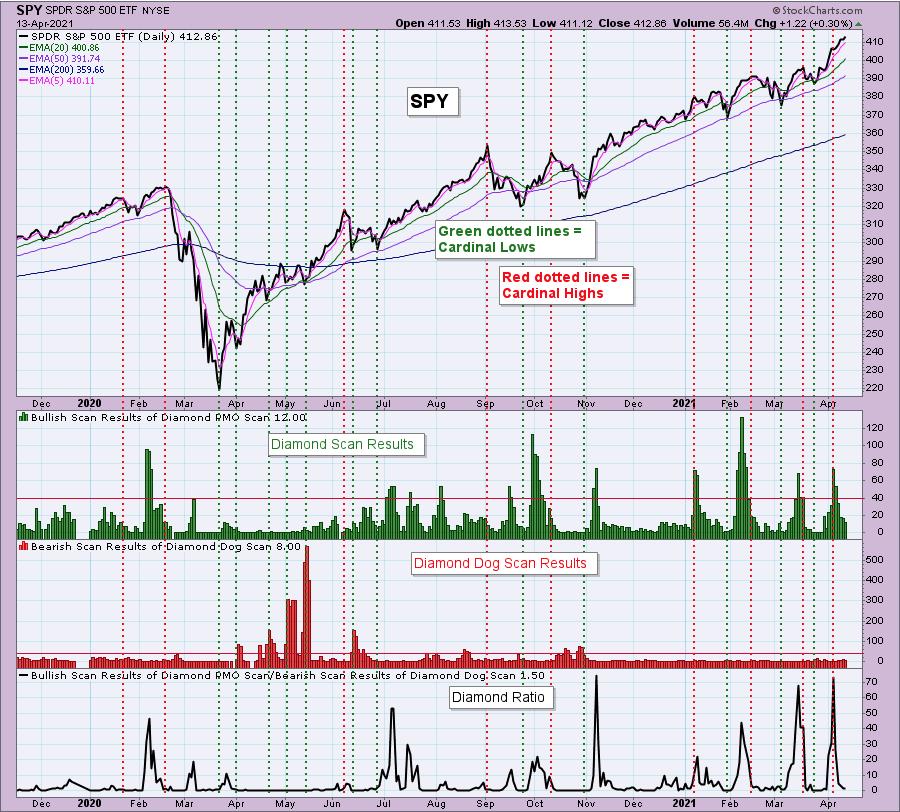
The Diamond Index chart looks at the number of scan results from my bullish Diamond PMO Scan and the number of scan results from the inverse Diamond Dog Scan. The Diamond Ratio divides the bullish results by the bearish results.
I only have data going back to October 2019 so I won't make any sweeping conclusions about the Diamond Index chart. I have marked cardinal tops with red dotted vertical lines and cardinal price bottoms with green dotted vertical lines. I believe that when the Diamond Dog results spike, it usually comes at a price bottom, or marks a strong continuation of the rising trend.
Unfortunately, the Diamond PMO Scan result numbers aren't providing much insight. The Diamond Ratio has promise, but again I don't see a clear correlation to the market tops/bottoms right now. I need to study and manipulate the data some more. Keep you posted!
Technical Analysis is a windsock, not a crystal ball.
Happy Charting!
- Erin
erin@decisionpoint.com
Watch the latest episode of DecisionPoint with Carl & Erin Swenlin on Mondays 7:00p EST or on the DecisionPoint playlist on the StockCharts TV YouTube channel here!
NOTE: The stocks reported herein are from mechanical trading model scans that are based upon moving average relationships, momentum and volume. DecisionPoint analysis is then applied to get five selections from the scans. The selections given should prompt readers to do a chart review using their own analysis process. This letter is not a call for a specific action to buy, sell or short any of the stocks provided. There are NO sure things or guaranteed returns on the daily selection of "diamonds in the rough."
Helpful DecisionPoint Links:
DecisionPoint Shared ChartList and DecisionPoint Chart Gallery
Price Momentum Oscillator (PMO)
Swenlin Trading Oscillators (STO-B and STO-V)
For more links, go to DecisionPoint.com!
