
Excellent time in the Diamond Mine this morning! The recording is linked below. Additionally, I've posted next week's link. When you register, be sure to keep the receipt with the "join" information. I forgot to resend the link this morning to those registered so I do apologize, but saving the confirmation email will always get you in.
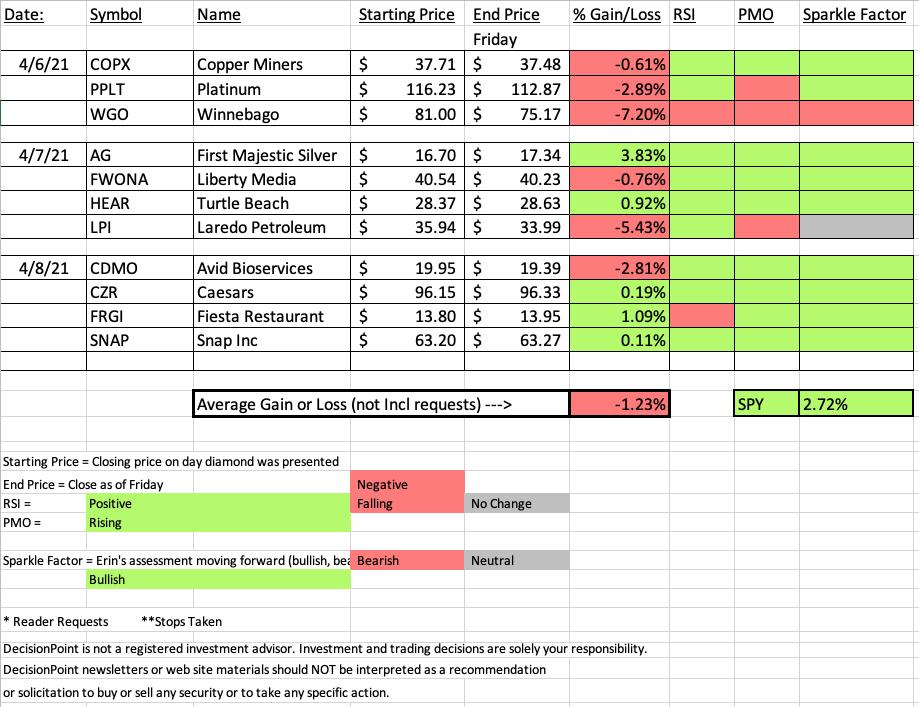
The "diamonds in the rough" didn't do that great, but I did use scans that brought stocks to the table that had just had big rally moves. Not too surprising to see some of them digesting their recent rallies. I still like nearly all of the stocks listed in this week's Recap.
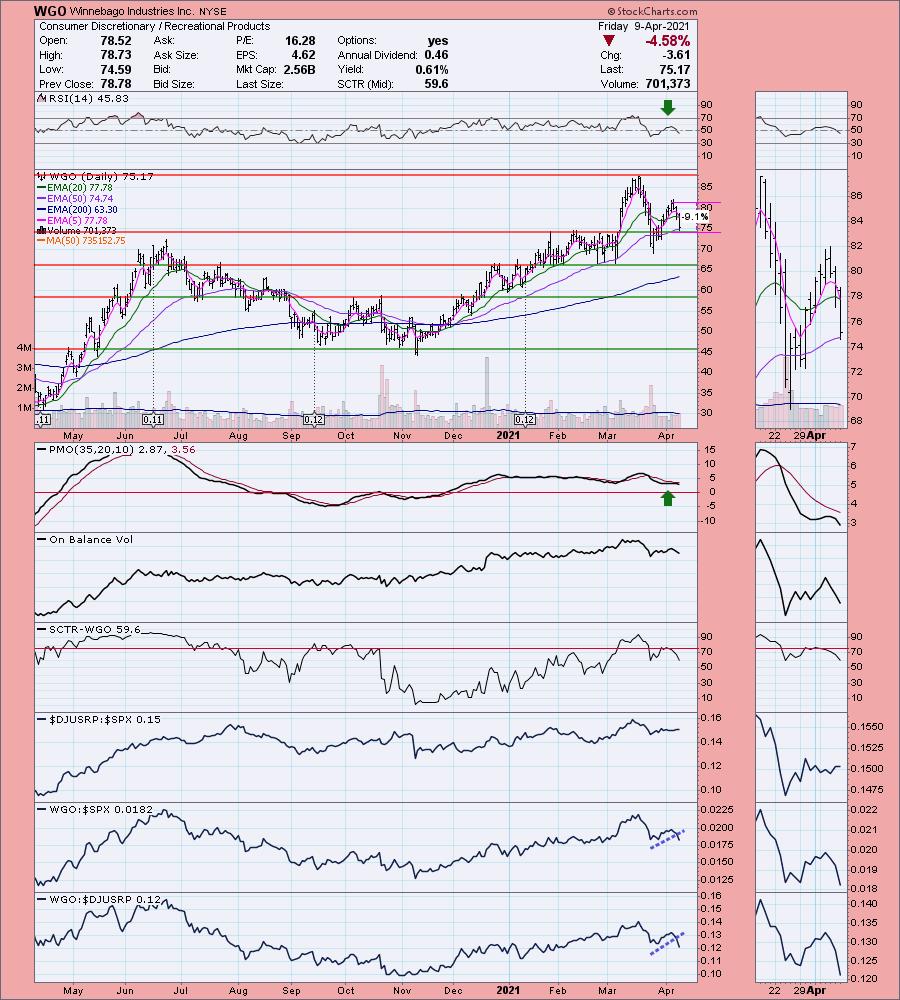
The biggest loser was Winnebego (WGO). It doesn't look good going forward. My thought on this one was that it was in the "recover/reopening" space and the set up was very good on Tuesday. The trade went south and the 9.1% stop was nearly hit today.
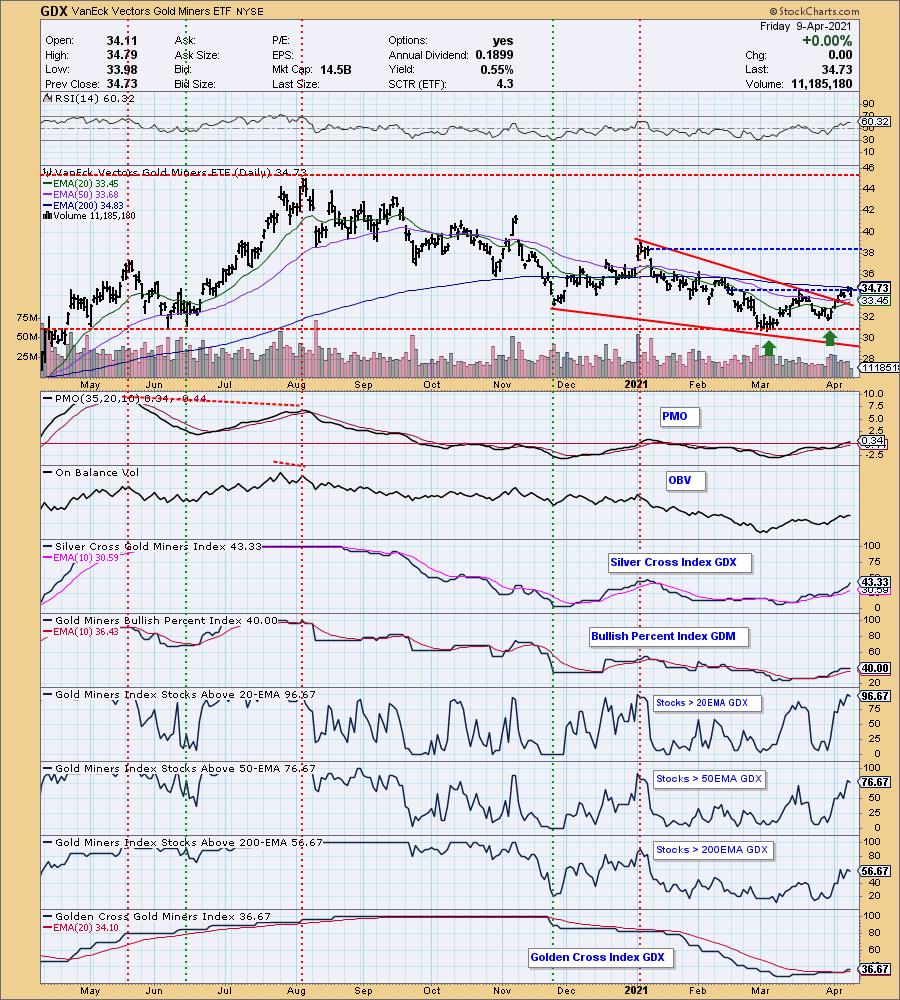
The biggest winner was First Majestic Silver (AG). I love this one going forward, especially on today's decline. The Gold Miners are the industry group to watch this upcoming week.
BIG NEWS! Minutes ago I found out that Greg Schnell will be joining me in the free DP Trading Room on May 3rd! If you haven't registered for the free Trading Room yet, here is the link. It is a recurring meeting so you only have to register once!
Register for next week's Diamond Mine below or HERE.
Diamond Mine Information:
RECORDING LINK:
Topic: DecisionPoint Diamond Mine LIVE Trading Room
Start Time : Apr 9, 2021 09:00 AM
Meeting Recording HERE
Access Passcode: TD6^5K^@
REGISTRATION:
When: Apr 16, 2021 09:00 AM Pacific Time (US and Canada)
Topic: DecisionPoint Diamond Mine (04/16/2021) LIVE Trading Room
Register in advance for this webinar HERE.
Save the registration confirmation email with login instructions in case Zoom doesn't notify you in time.
A few items about the spreadsheet: I decided it only fair to denote "reader requests" as I shouldn't get to take credit if they turn out great! I've put on the spreadsheet whether the RSI is positive (green) or negative (red). The PMO column tells you if it is rising (green) or falling (red). Finally I've added my own "Sparkle Factor" that gives you my assessment going forward, bullish (green), bearish (red) or neutral (gray). The Sparkle Factor is basically my thoughts on whether I expect it to rise or fall. A neutral means it could really go either way so it could be added to a watch list. If you're in a stock I consider "neutral" going forward, the ball is in your court.
Free DecisionPoint Trading Room on Mondays, Noon ET

*Click here to register for this recurring free DecisionPoint Trading Room on Mondays at Noon ET!*
=======================================
BELOW is a link to Monday's recording:
Topic: DecisionPoint Trading Room
Start Time : Apr 5, 2021 08:57 AM
Meeting Recording HERE.
Access Passcode: April_4/5
For best results, copy and paste the access code to avoid typos.
Darling:
First Majestic Silver Corp. (AG)
EARNINGS: 5/13/2021
First Majestic Silver Corp. engages in the production, development, exploration and acquisition of mineral properties. It owns and operates producing mines in México including La Encantada Silver Mine; La Parrilla Silver Mine; San Martin Silver Mine; La Guitarra Silver Mine; Del Toro Silver Mine; Santa Elena Silver & Gold Mine; and San Dimas Silver & Gold Mine. The company was founded by Keith Neumeyer on September 26, 1979 and is headquartered in Vancouver, Canada.
Below is the commentary and chart from Wednesday:
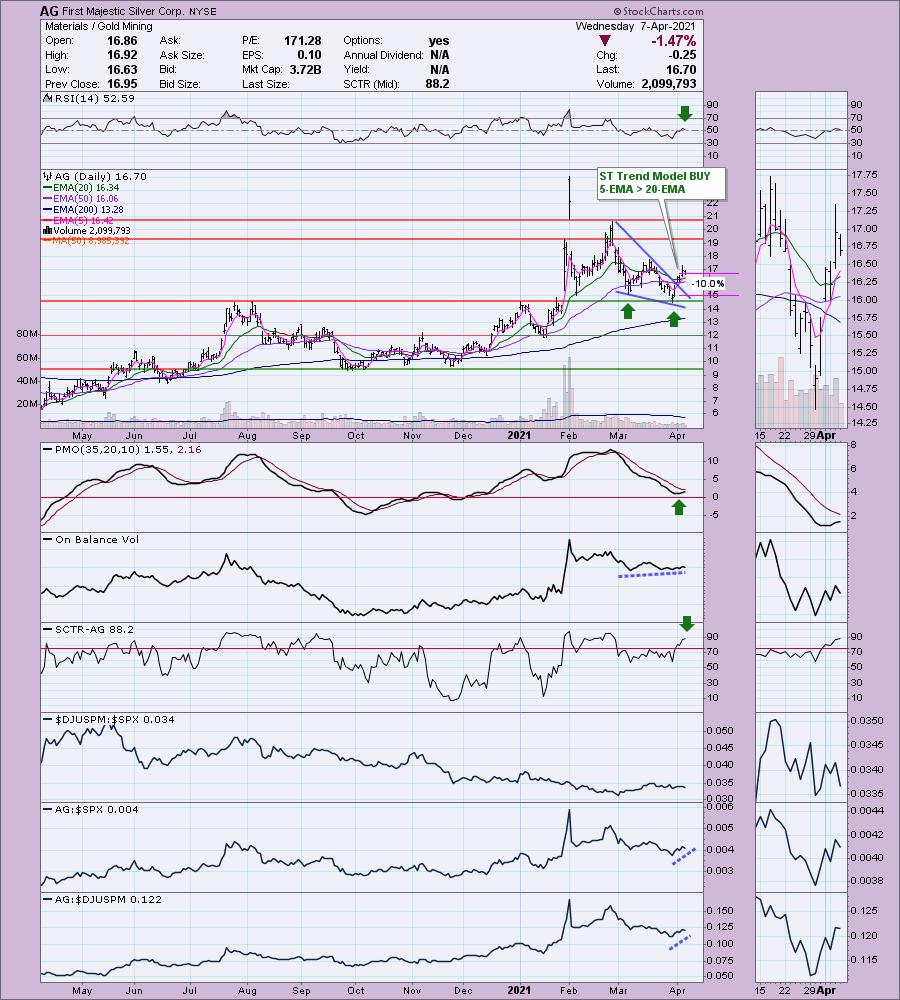
"AG is up +0.48% in after hours trading. When I examine my scan results, I use the "CandleGlance" view which doesn't include the sector and industry group. It makes me focus on the chart and indicators without showing bias toward an industry or sector. I'm bullish on Gold Miners, but when I selected this chart, it was because I liked the bullish bias. Finding out it was a Gold Miner when I examined it more closely, told me that I needed to include this one, especially given today's pullback.
We have a bullish falling wedge, a double-bottom and a recent breakout. The RSI just turned positive as it moved above net neutral (50). There is a very nice positive divergence with the OBV. These divergences general precede sustained rallies. The PMO is headed toward a crossover BUY signal. The SCTR is in the "hot zone" above 75 now and the stock is outperforming the SPX and its industry group. I've set a 10% stop level that aligns with the first bottom of a double-bottom pattern."
Here is today's chart:
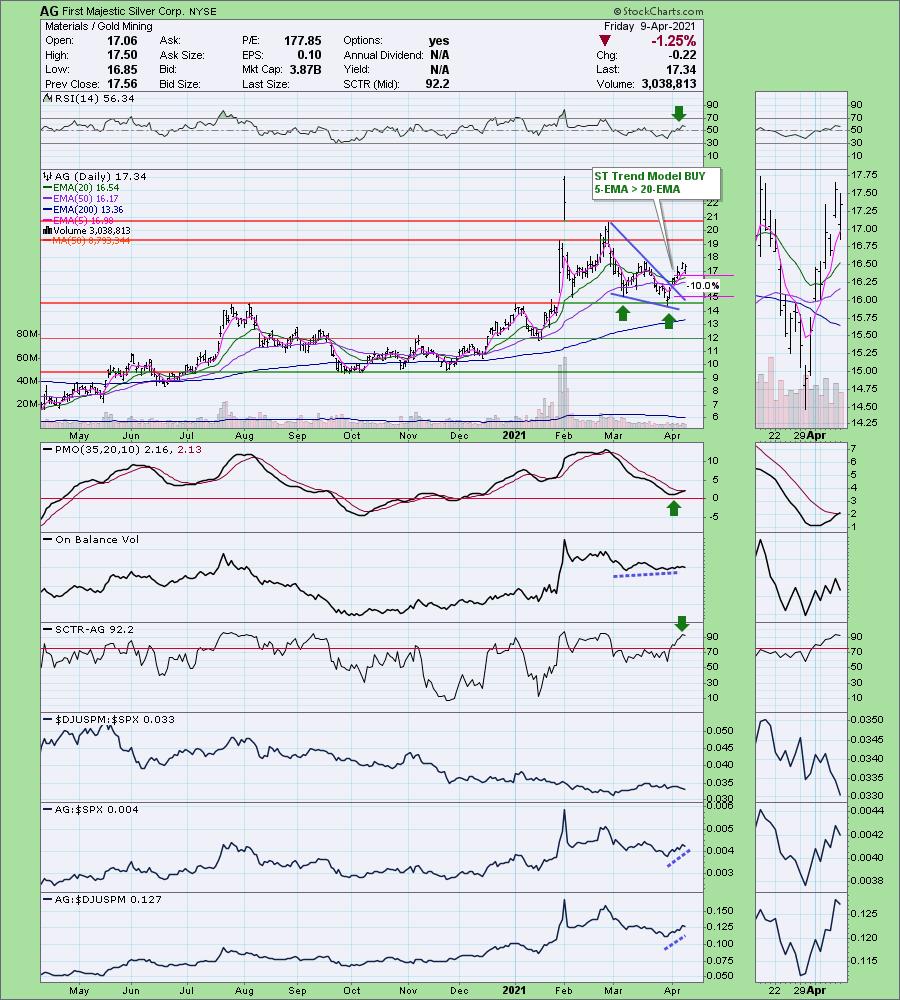
Today's pullback makes AG particularly good for next week. High likelihood that I will add it on Monday. We now have the PMO crossover BUY signal. RSI is still positive. You could probably raise the stop level if you prefer.
Don't forget, on Thursdays I look at reader-requested symbols, so shoot me an email at erin@decisionpoint.com. I read every email I receive and try to answer them all!
Dud:
Winnebago Industries Inc. (WGO)
EARNINGS: 6/23/2021 (BMO)
Winnebago Industries, Inc. engages in the design, development, manufacture, and sale of motorized and towable recreation products. It operates through the following segments: Grand Design towables, Winnebago towables, Winnebago motorhomes, Newmar motorhomes, Chris-Craft marine and Winnebago specialty vehicles. The company was founded on February 12, 1958 and is headquartered in Forest City, IA.
Below is the chart and commentary from Tuesday:
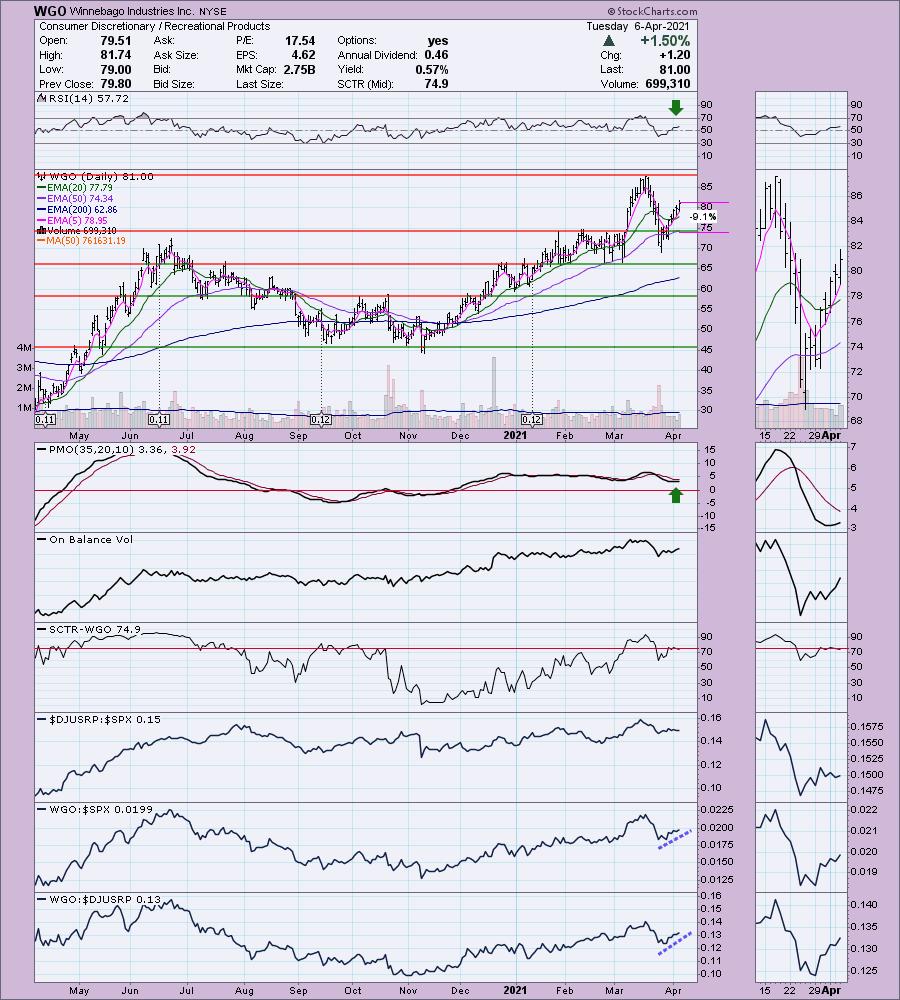
"WGO is unchanged in after hours trading. I covered WGO as a reader request back on June 11th 2020. It was up about 17% before falling and hitting the 7.8%. If you hadn't taken the stop and rode it down (which I never recommend) it would currently be up 31.2% today. I like the set up on this one. We have a strong "V" bottom that has retraced about half of the pattern...only 1/3 is required to execute the pattern. The RSI is positive and rising and the PMO is turning up on its way to a crossover BUY signal. The OBV is confirming the rally and it is showing good outperformance against the SPX and its industry group. I've set a 9.1% stop that is just below support at the top of the February trading channel."
Below is today's chart:
It is amazing how a trade can turn south so quickly. If you look at the chart above, you can easily see why I liked it. However, it ended up tarnishing right away. There's nothing to like on this chart. In fact we now have a bearish double-top. This could be an area where it will rebound since it is sitting strong support with the 50-EMA and support at the February tops. I think I'd rather put my money elsewhere instead of waiting this one out.
THIS WEEK's Sector Performance: 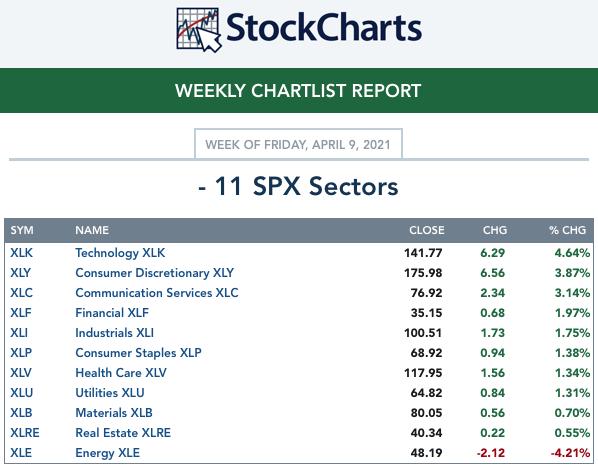
Click Here to view Carl's annotated Sector ChartList!
CONCLUSION:
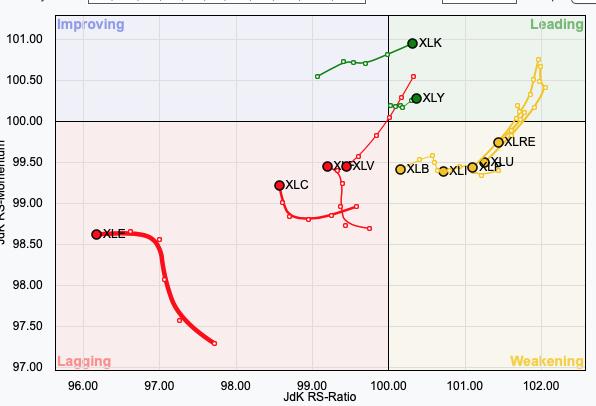
Below is the sector Relative Rotation Graph for the short term or "daily" version. The Real Estate Sector (XLRE) looks very strong, but if you look at our sector chart for XLRE, you'd see a huge drop in participation among members. I still like XLI and XLF, mainly based on our sector charts and the technicals underneath the hood.
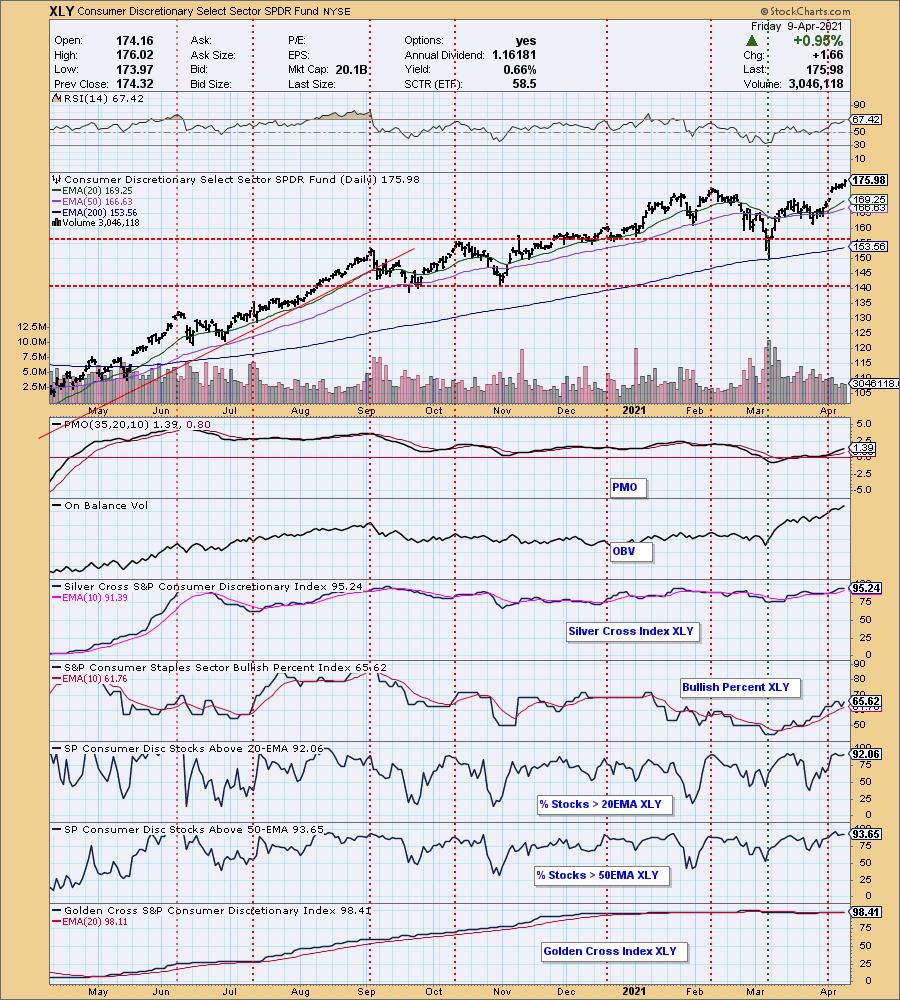
Sector to Watch: Consumer Discretionary (XLY)
Today we saw another breakout to an all-time high for XLY. Technology (XLK) looks great too, especially when you look at the Relative Rotation Graph (RRG) above. You could honestly pick either of these sectors and look for continued strength next week. I like the rising BPI, OBV and strong participation among members of XLY.
Industry Group to Watch: Gold Mining ($DJUSPM)
The set up on Gold Miners looks good. Price did falter today at overhead resistance, the confirmation line of the double-bottom pattern. The RSI is positive and the PMO has just hit positive territory. Participation is strong and there is even room for it to expand. Given that Gold is looking very bullish, this should put the wind at the back of the Gold Miners.
Go to our Sector ChartList on DecisionPoint.com to get an in depth view of all the sectors.
Technical Analysis is a windsock, not a crystal ball.
Have a great weekend & Happy Charting!
- Erin
erin@decisionpoint.com
Full Disclosure: I'm about 75% invested right now and 25% is in 'cash', meaning in money markets and readily available to trade with. This week I added Diamonds: EXC, RAD, BLBD and SPWR. I sold BOIL, but have a $9.60 stop on UNG. I felt overexposed to Nat Gas and pared back the position by selling BOIL.
Watch the latest episode of DecisionPoint with Carl & Erin Swenlin on Mondays 7:00p EST or on the DecisionPoint playlist on the StockCharts TV YouTube channel here!
NOTE: The stocks reported herein are from mechanical trading model scans that are based upon moving average relationships, momentum and volume. DecisionPoint analysis is then applied to get five selections from the scans. The selections given should prompt readers to do a chart review using their own analysis process. This letter is not a call for a specific action to buy, sell or short any of the stocks provided. There are NO sure things or guaranteed returns on the daily selection of "diamonds in the rough."
Helpful DecisionPoint Links:
DecisionPoint Shared ChartList and DecisionPoint Chart Gallery
Price Momentum Oscillator (PMO)
Swenlin Trading Oscillators (STO-B and STO-V)
