
It's Reader Request Day for Diamonds! I was proud and pleased when the requests came in and they were stocks that were already on my radar as they came up in scans this week. I've selected three requests and all of them were in my scan results this week. I've added a "reopening" stock of my own.
I came across a number of interesting symbols today and there were some requests that deserve a look, so I'm including them in the "Stocks to Consider".
Don't forget to sign up for tomorrow's Diamond Mine trading room! You'll find the link below or just click HERE.
Today's "Diamonds in the Rough" are: CDMO, CZR, FRGI and SNAP.
Stocks to Consider: CNK, GES, LSPD, ERJ, RL, SGMS, SQ, VNDA and VUZI.
 Diamond Mine REGISTRATION Information:
When: Apr 9, 2021 09:00 AM Pacific Time (US and Canada)
Topic: DecisionPoint Diamond Mine LIVE Trading Room
Register in advance for this webinar HERE!
After registering, you will receive a confirmation email containing information about joining the webinar.
After registering, you will receive a confirmation email containing information about joining the webinar, including the password.
=======================================================================
Diamond Mine RECORDING Link from 3/26/2021:
Topic: DecisionPoint Diamond Mine (04/02/2021) LIVE Trading Room
Start Time : Apr 2, 2021 09:00 AM
Meeting Recording HERE!
Access Passcode: DM_04/02
***Click here to register for this recurring free DecisionPoint Trading Room on Mondays at Noon ET!***
+++++++++++++++++++++++++++++++++++++++++++++++++++++++++++++++++++++++++++++++
Free DP Trading Room RECORDING LINK:
Topic: DecisionPoint Trading Room
Start Time : Apr 5, 2021 08:57 AM
Meeting Recording HERE!
Access Passcode: April_4/5
For best results, copy and paste the access code to avoid typos.
Welcome to DecisionPoint Daily Diamonds, wherein I highlight five "diamonds in the rough." These are selected from the results of my DecisionPoint scans, which search for stocks that could benefit from the trend and condition of the market. Remember, these are not recommendations to buy or sell, but are the most interesting of the stocks that surfaced in my scans. My objective is to save you the work of the initial, tedious culling process, but you need to apply your own analysis to see if these stocks pique your interest as well. There are no guaranteed winners here!
Avid Bioservices, Inc. (CDMO)
EARNINGS: 6/30/2021 (AMC)
Avid Bioservices, Inc. engages in the commercial manufacturing which focuses on biopharmaceutical products derived from mammalian cell culture for culture for biotechnology and pharmaceutical companies. The firm specializes in clinical and commercial product manufacturing, purification, bulk packaging, stability testing and regulatory submissions, and support. The company was founded on June 3, 1981 and is headquartered in Tustin, CA.
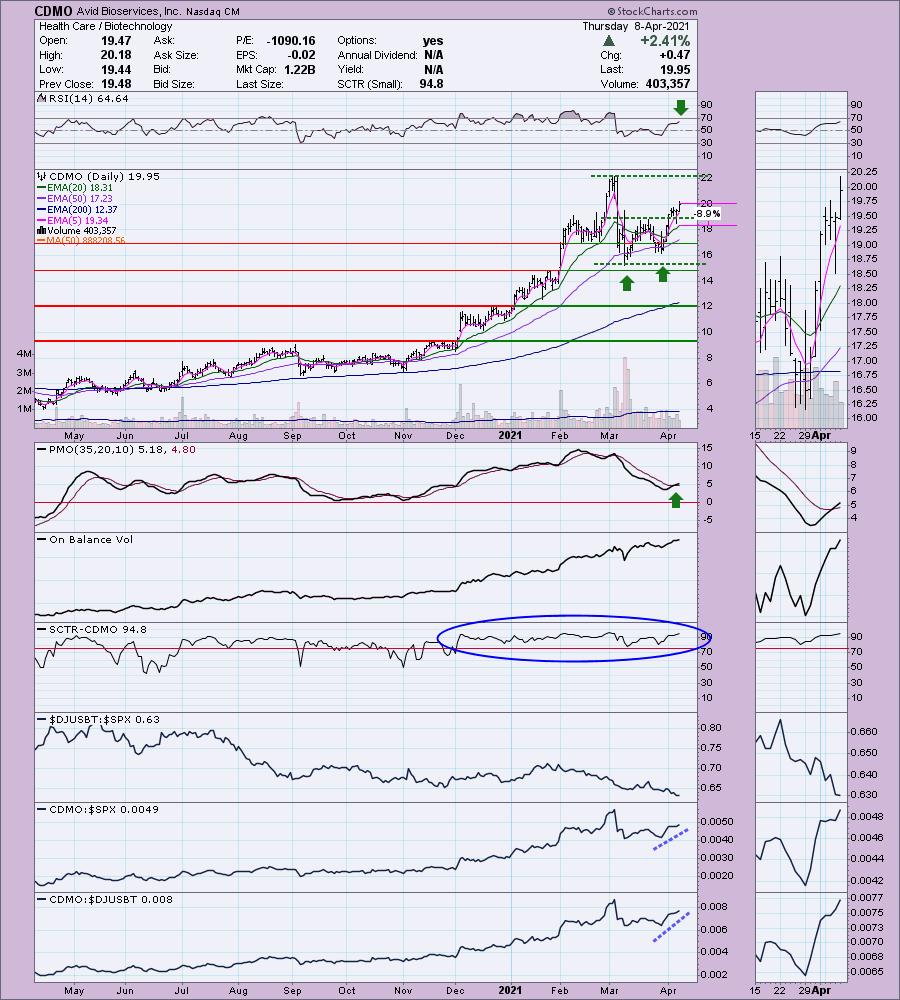
CDMO is unchanged in after hours trading. I mentioned this one on Tuesday as a "Stock to Watch". Since it was requested and I hadn't done complete analysis on it, thought it would be a good exercise.
There is a nice looking double-bottom pattern which has executed. The upside target of that pattern would be at all-time highs for the stock. The RSI is positive and we just got a PMO crossover BUY signal. The SCTR has shown strength all year. I'm not thrilled with the performance of the industry group against the SPX, but CDMO is outperforming the SPX. The stop is set below the confirmation line of the double-bottom.
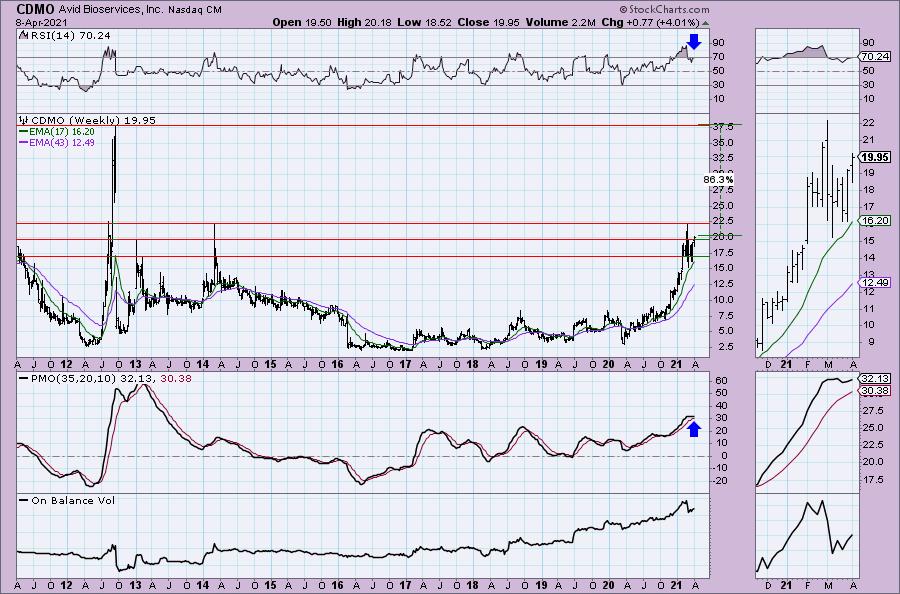
For reference, this weekly chart has an additional three years of data. You should always look at the same period charts when you can to keep context among all of your selections. However, in this case, I wanted to see where this stock had been. My biggest concern is that the most recent cardinal high near-term is right on the resistance level of 2014. However, the rest of the chart is positive. The RSI is slightly overbought. The PMO has turned up above its signal line.
Caesars Entertainment, Inc. (CZR)
EARNINGS: 5/4/2021 (AMC)
Caesars Entertainment, Inc. engages in the management of casinos and resorts under the Caesars, Harrah's, Horseshoe, and Eldorado brands. It operates through the following segments: West, Midwest, South, East, and Central. The West segment consists of gaming and hotel properties in Nevada and Colorado. The Midwest segment include dockside casino in Iowa and land-based casinos in Missouri. The South segment manages a dockside casinos in Louisiana and Mississippi, a land-based casino in Mississippi, and a racino in Florida. The East segment consists of a racino in Ohio and a casino in New Jersey. The Central segment manages casinos in Indiana, Illinois, and Missouri. The company was founded in 1937 and is headquartered in Reno, NV.
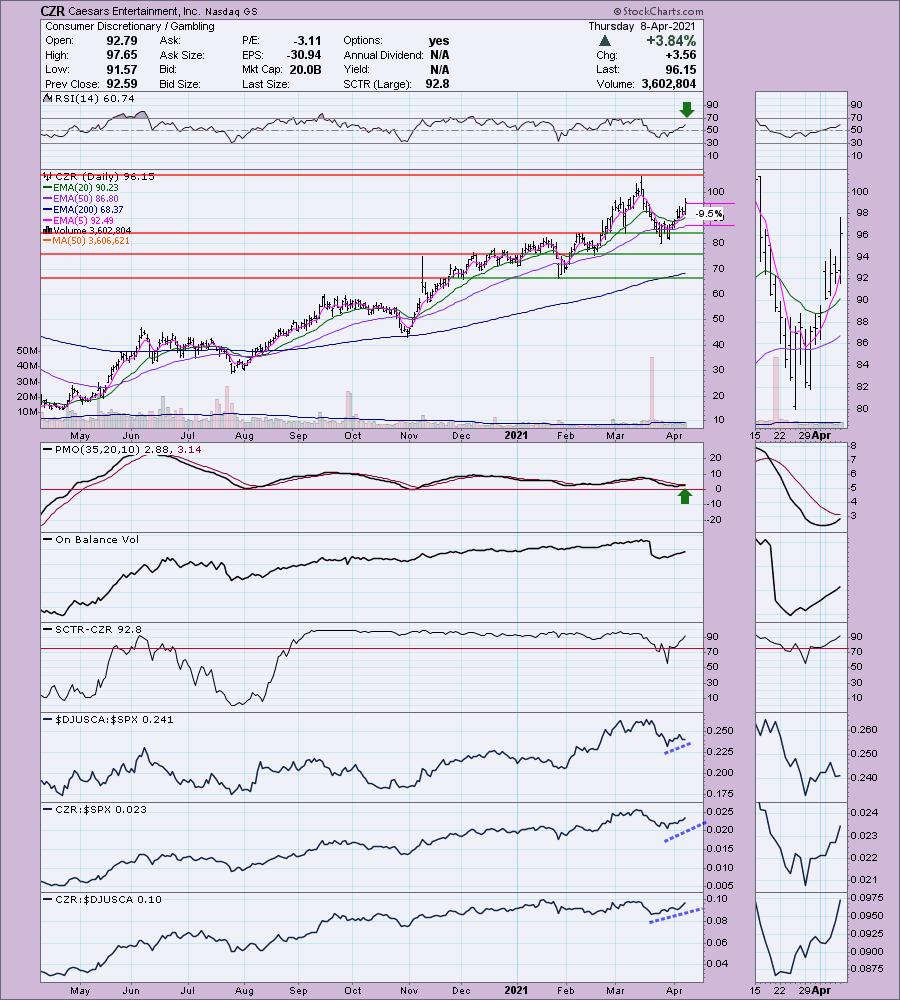
CZR is up +1.46% in after hours trading even after a nearly 4% move today. The RSI is positive and we have a nice basing pattern off the 50-EMA. The PMO has turned up and is going in for a crossover BUY signal. Volume is coming in and the SCTR has spent much of the past year in the "hot zone" above 75. I like how it is performing against the SPX and its industry group. The stop is a bit deep, but it is right below the 50-EMA.
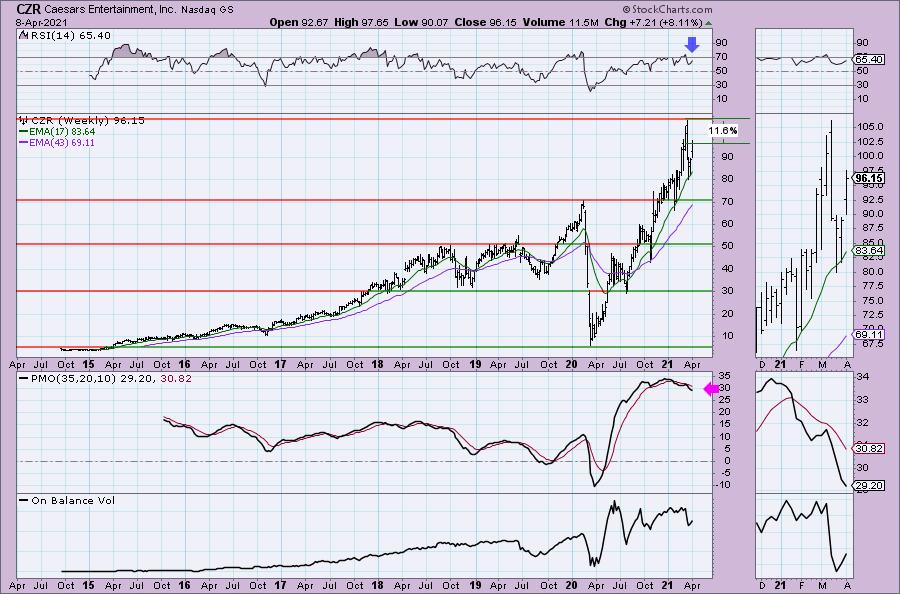
CZR is only about 11.5% away from new all-time highs. The RSI is positive and not overbought. However, the weekly PMO leaves much to be desired so consider this a short-term position until the weekly PMO improves.
Fiesta Restaurant Group, Inc. (FRGI)
EARNINGS: 5/6/2021 (AMC)
Fiesta Restaurant Group, Inc. is a holding company, which engages in the acquisition, operation, and franchising of fast-casual restaurants. It operates through the following segments: Pollo Tropical, Taco Cabana, and Other. The Pollo Tropical segment offers fire-grilled and crispy citrus marinated chicken and other freshly prepared tropical-inspired menu items. The Taco Cabana segment specializes in Mexican-inspired food. The Other segment includes corporate-owned property and equipment, advisory fees, and corporate. The company was founded in April 2011 and is headquartered in Dallas, TX.
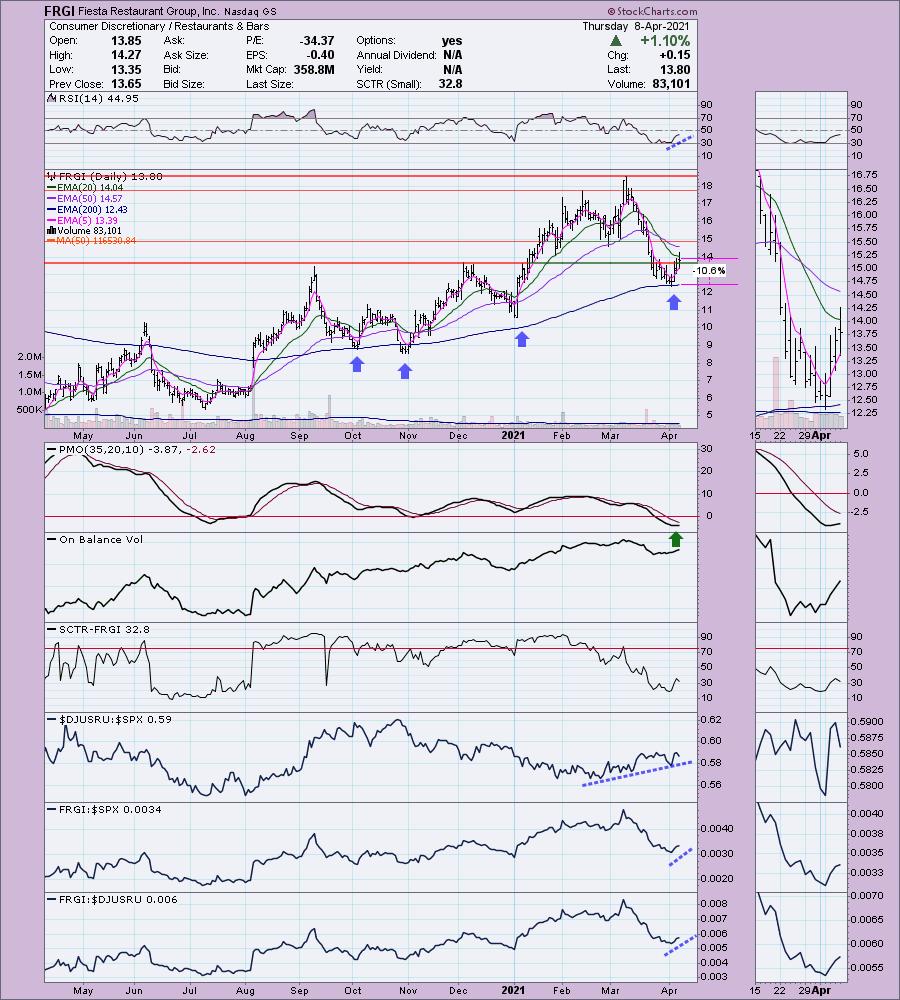
FRGI is unchanged in after hours trading. I covered this one in the October 13th 2020 Diamonds Report. The trade turned south almost immediately so this would be considered a 9.7% loss position. I like the set-up right now so I'm giving it another shot. We have a "V" bottom forming. We need to see price retrace the decline by 30%, so we are little early here. Notice how its "personality" is a test of the 200-EMA and then a rally. While price didn't close above the 20-EMA, it still traded above it. We're just now starting to see some outperformance. Since this is a "momentum sleeper", the RSI, while rising, is negative and as most of you know, I like it to be positive before presentation. However, this is in the "reopening" segment of the market. The stop is set to match up with the 200-EMA.
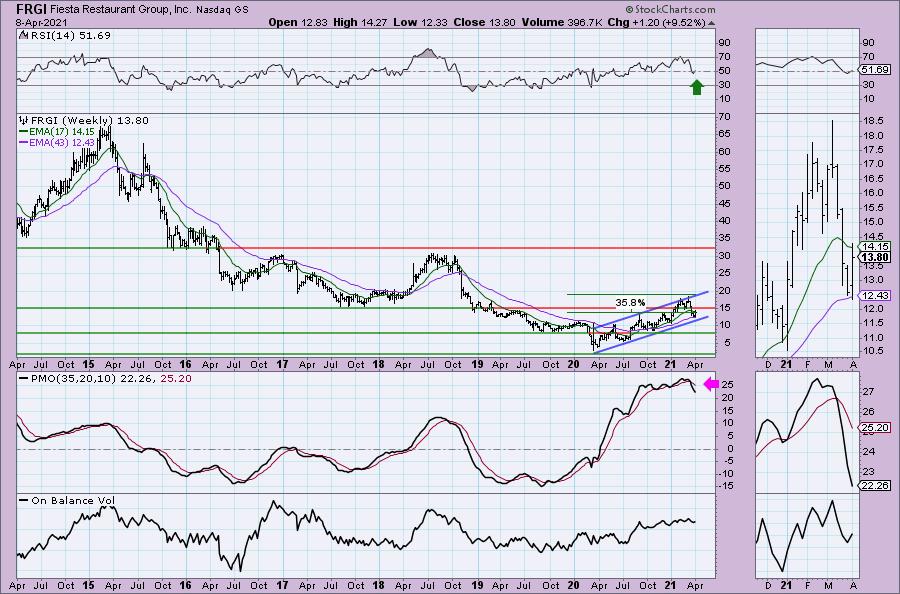
We have a rising trend channel on the weekly chart. The RSI just popped back into positive territory. The PMO looks horrible as it is diving, so keep an eye on it if you get in.
Don't forget, on Thursdays I look at reader-requested symbols, so shoot me an email at erin@decisionpoint.com. I read every email I receive and try to answer them all!
Snap Inc. (SNAP)
EARNINGS: 4/22/2021 (AMC)
Snap, Inc. engages in the operation of its camera platform. Its products include Snapchat, using the camera and editing tools to take and share Snaps, Friends Page, which lets users create and use Stories, Groups, Video and Chat, Discover for searching and surfacing relevant Stories, Snap Map, which shows friends, Stories and Snaps near the user, Memories, for saving personal collections, and Spectacles, wearable sunglasses capable of taking Snaps and interacting directly with the Snapchat application. The firm's primary source of revenue is advertising. The company was founded by Frank Reginald Brown IV, Evan Thomas Spiegel, and Robert C. Murphy in 2010 and is headquartered in Santa Monica, CA.
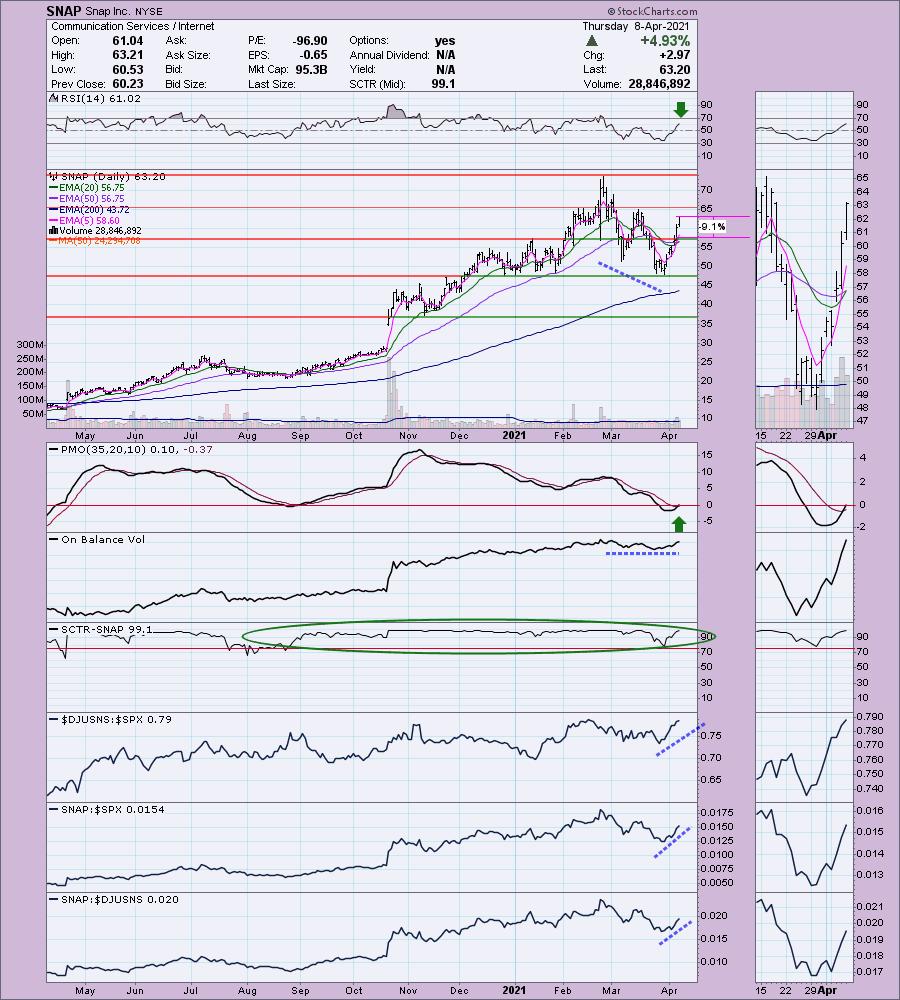
SNAP is up +0.60% in after hours trading. I covered it in the September 1st 2020 Diamonds Report. This is a big winner. It never hit its stop and is up 182% since I picked it. Talk about a shiny diamond! It's been through some tough times this spring, but has been rallying strongly. There is a double-bottom and we nearly got a "silver cross" IT Trend Model BUY signal as the 20-EMA just about crossed above the 50-EMA today. We did get a new PMO crossover BUY signal today. There is a slight positive divergence on the OBV. The price bottoms are steeply declining while the OBV bottoms are about the same. The SCTR has been in the hot zone since before we picked it in September. The outperformance looks good against the SPX and its Internet brethren.
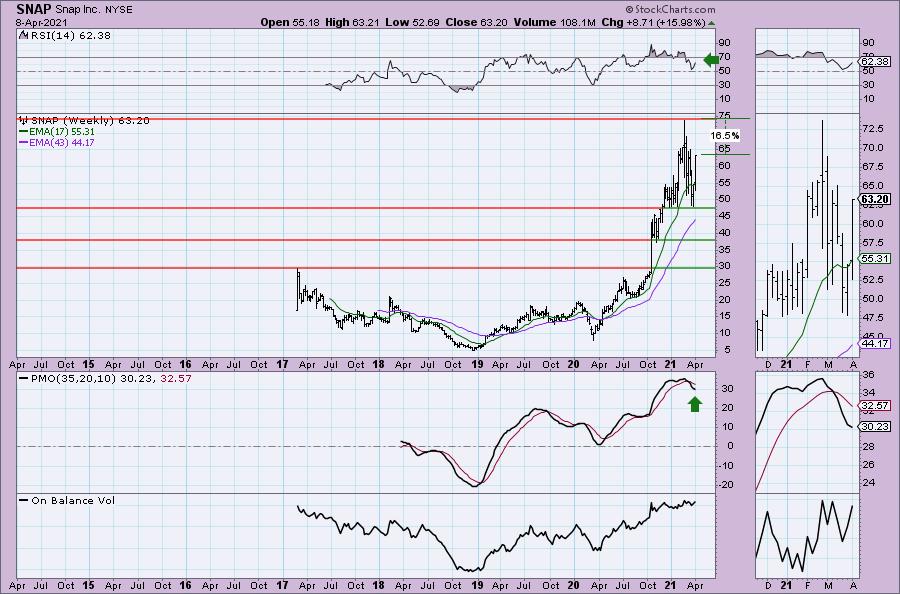
It's already up 16% this week, but there is another 16.5% profit to be had if it challenges its all-time highs. The weekly RSI is positive and the weekly PMO is at least decelerating from its decline.
Full Disclosure: I'm about 65% invested and 35% is in 'cash', meaning in money markets and readily available to trade with. Looking for a pullback on Gold Miners to enter. SPWR is on life support, I think I'll sell into any strength on it and look at a different solar stock.
Current Market Outlook:
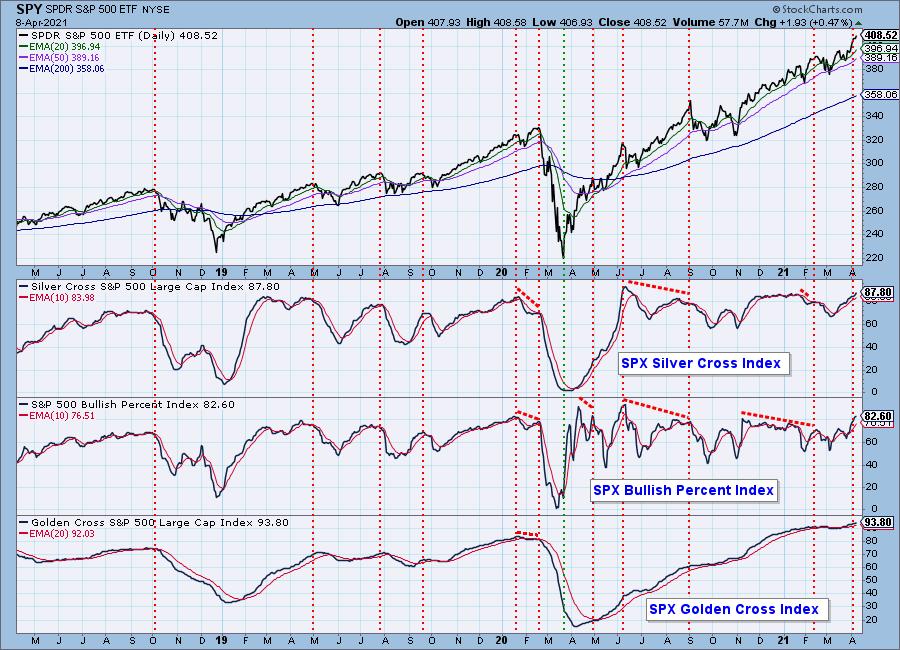
Market Environment: It is important to consider the odds for success by assessing the market tides. The following chart uses different methodologies for objectively showing the depth and trend of participation for intermediate- and long-term time frames.
- The Silver Cross Index (SCI) shows the percentage of SPX stocks on IT Trend Model BUY signals (20-EMA > 50-EMA)
- The Golden Cross Index (GCI) shows the percentage of SPX stocks on LT Trend Model BUY signals (50-EMA > 200-EMA)
- The Bullish Percent Index (BPI) shows the percentage of SPX stocks on Point & Figure BUY signals.
Don't forget that as a "Diamonds" member, you have access to our GCI/SCI curated ChartList on DecisionPoint.com. You'll find it under "Members Only" links on the left side on the Blogs and Links Page.
Here is the current chart:
Diamond Index:
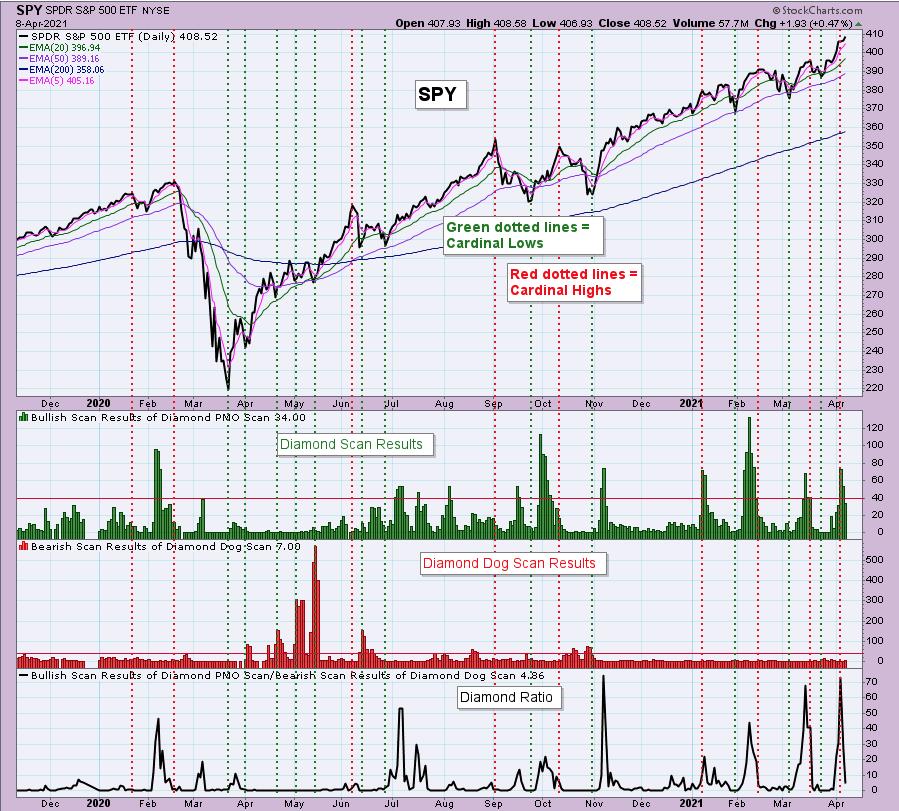
The Diamond Index chart looks at the number of scan results from my bullish Diamond PMO Scan and the number of scan results from the inverse Diamond Dog Scan. The Diamond Ratio divides the bullish results by the bearish results.
I only have data going back to October 2019 so I won't make any sweeping conclusions about the Diamond Index chart. I have marked cardinal tops with red dotted vertical lines and cardinal price bottoms with green dotted vertical lines. I believe that when the Diamond Dog results spike, it usually comes at a price bottom, or marks a strong continuation of the rising trend.
Unfortunately, the Diamond PMO Scan result numbers aren't providing much insight. The Diamond Ratio has promise, but again I don't see a clear correlation to the market tops/bottoms right now. I need to study and manipulate the data some more. Keep you posted!
Technical Analysis is a windsock, not a crystal ball.
Happy Charting!
- Erin
erin@decisionpoint.com
Watch the latest episode of DecisionPoint with Carl & Erin Swenlin on Mondays 7:00p EST or on the DecisionPoint playlist on the StockCharts TV YouTube channel here!
NOTE: The stocks reported herein are from mechanical trading model scans that are based upon moving average relationships, momentum and volume. DecisionPoint analysis is then applied to get five selections from the scans. The selections given should prompt readers to do a chart review using their own analysis process. This letter is not a call for a specific action to buy, sell or short any of the stocks provided. There are NO sure things or guaranteed returns on the daily selection of "diamonds in the rough."
Helpful DecisionPoint Links:
DecisionPoint Shared ChartList and DecisionPoint Chart Gallery
Price Momentum Oscillator (PMO)
Swenlin Trading Oscillators (STO-B and STO-V)
For more links, go to DecisionPoint.com!
