
For some reason it seemed to be much easier to glean "diamonds in the rough" today. All them come from the more defensive sectors, Healthcare and Consumer Staples. I wasn't looking specifically for defensive plays, but I have to say after watching our indicators yesterday, it seemed wise.
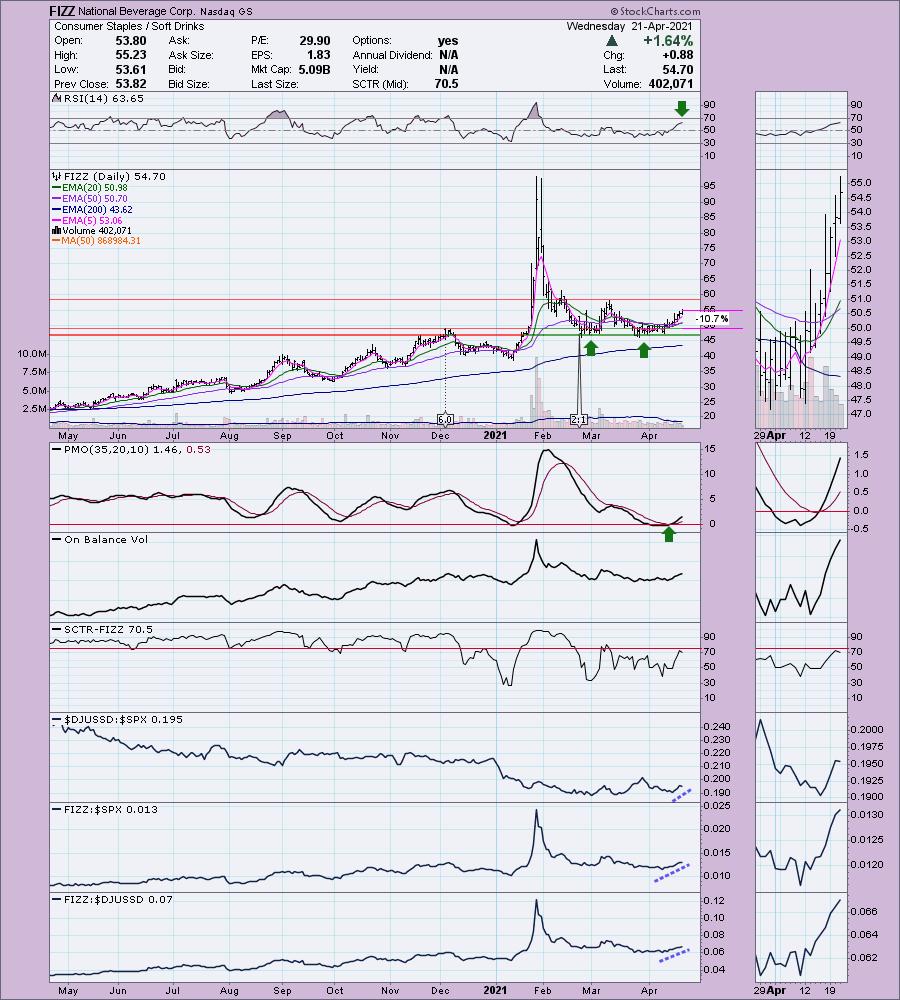
I couldn't resist FIZZ today, the chart is so favorable and it is in Consumer Staples. I decided to do four charts today since I did discuss FIZZ yesterday, but didn't include the chart. You'll also note that TSLA (full disclosure: I own it.) is on the "Stocks to Consider" list. I like the set up here and upside potential is very good.
Today's "Diamonds in the Rough" are: APYX, BGS, FIZZ and VNDA.
Stocks/ETFs to Consider: CRWD, AWI, ELF, ELY, GRA, NOBL and TSLA.
 Diamond Mine REGISTRATION Information:
When: Apr 23, 2021 09:00 AM Pacific Time (US and Canada)
Topic: DecisionPoint Diamond Mine LIVE Trading Room
Register HERE for this webinar.
After registering, you will receive a confirmation email containing information about joining the webinar, including the password.
=======================================================================
Diamond Mine RECORDING Link from 4/9/2021:
Topic: DecisionPoint Diamond Mine (04/16/2021) LIVE Trading Room
Start Time : Apr 16, 2021 09:00 AM
Meeting Recording Link.
Access Passcode: April_16
***Click here to register for this recurring free DecisionPoint Trading Room on Mondays at Noon ET!***
+++++++++++++++++++++++++++++++++++++++++++++++++++++++++++++++++++++++++++++++
Free DP Trading Room RECORDING LINK:
Topic: DecisionPoint Trading Room
Start Time : Apr 19, 2021 08:56 AM
DP Trading Room Recording Link HERE.
Access Passcode: April/19
For best results, copy and paste the access code to avoid typos.
Welcome to DecisionPoint Daily Diamonds, wherein I highlight five "diamonds in the rough." These are selected from the results of my DecisionPoint scans, which search for stocks that could benefit from the trend and condition of the market. Remember, these are not recommendations to buy or sell, but are the most interesting of the stocks that surfaced in my scans. My objective is to save you the work of the initial, tedious culling process, but you need to apply your own analysis to see if these stocks pique your interest as well. There are no guaranteed winners here!
Apyx Medical Corp. (APYX)
EARNINGS: 5/12/2021 (BMO)
Apyx Medical Corp. operates as an energy-based medical technology company. The firm engages in developing, manufacturing, and marketing a range of electrosurgical products and technologies, as well as related medical products used the offices of doctors, surgery centers, and hospitals worldwide. It operates through the following segments: Advanced Energy and Original Equipment Manufacture (OME). The company was founded by Andrew Makrides in 1978 and is headquartered in Clearwater, FL.
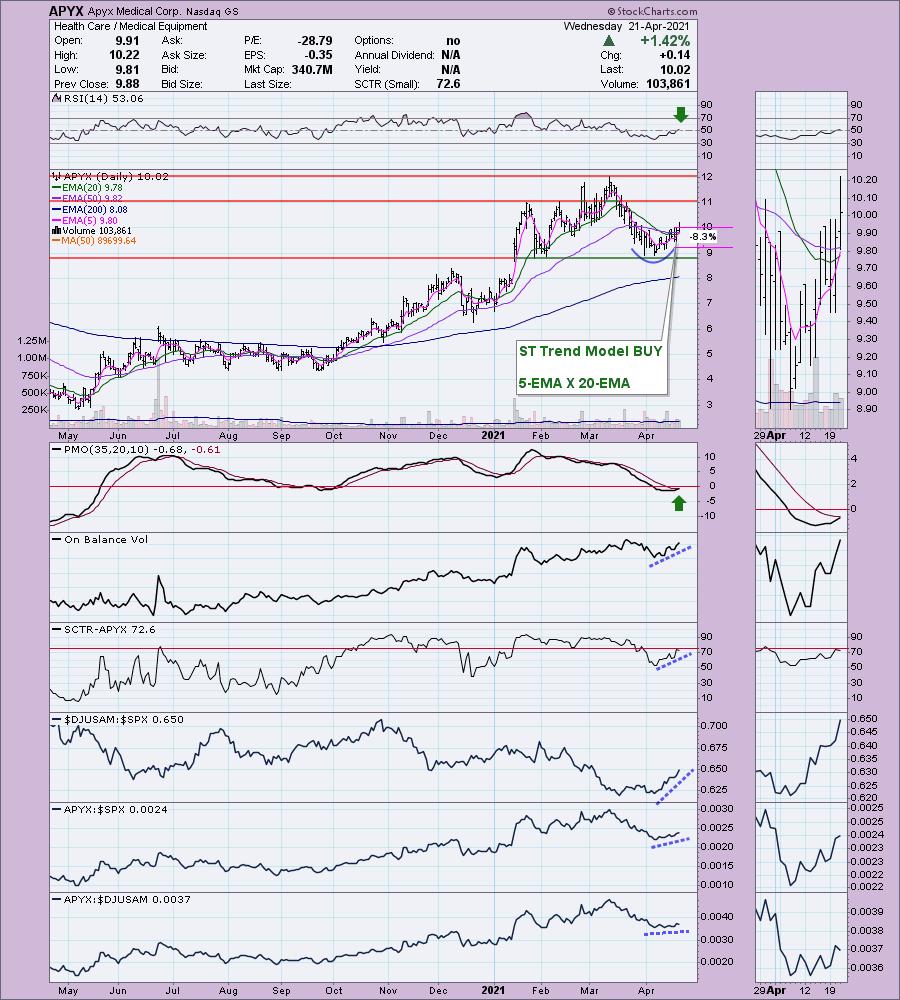
APYX is up +0.80% in after hours trading. Here we have a rounded price bottom. The RSI just moved into positive territory. There is a new ST Trend Model BUY signal that was triggered when the 5-EMA crossed above the 20-EMA. The PMO is nearing a crossover BUY signal in oversold territory and the OBV is confirming the current rising trend. It's performing well and the SCTR is very close to the "hot zone" above 75 (meaning it is in the upper quartile of all small-cap stocks). I've set an 8.3% stop level, but you could tighten or lengthen it depending on your risk appetite.
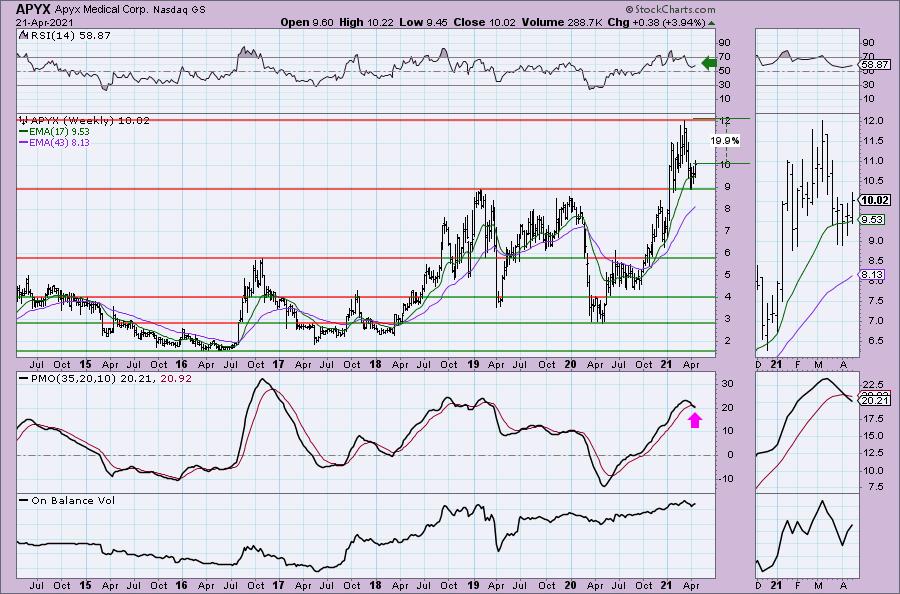
Risk/reward looks good with the upside target at it's all-time high. The RSI is positive. As with most stocks on a short-term reversal, the PMO is on a new SELL signal. The bounce off strong support makes this one especially interesting to me.
B&G Foods Inc. (BGS)
EARNINGS: 5/4/2021 (AMC)
B&G Foods, Inc.is a holding company, which engages in the manufacture, sale, and distribution of shelf-stable frozen food, and household products in the U.S., Canada, and Puerto Rico. Its products include frozen and canned vegetables, hot cereals, fruit spreads, canned meats and beans, bagel chips, spices, seasonings, hot sauces, and wine vinegar. Its brands include Back to Nature, Bear Creek, Cream of Wheat, Green Giant, Mrs. Dash, and Ortega. The company was founded in 1889 and is headquartered in Parsippany, NJ.
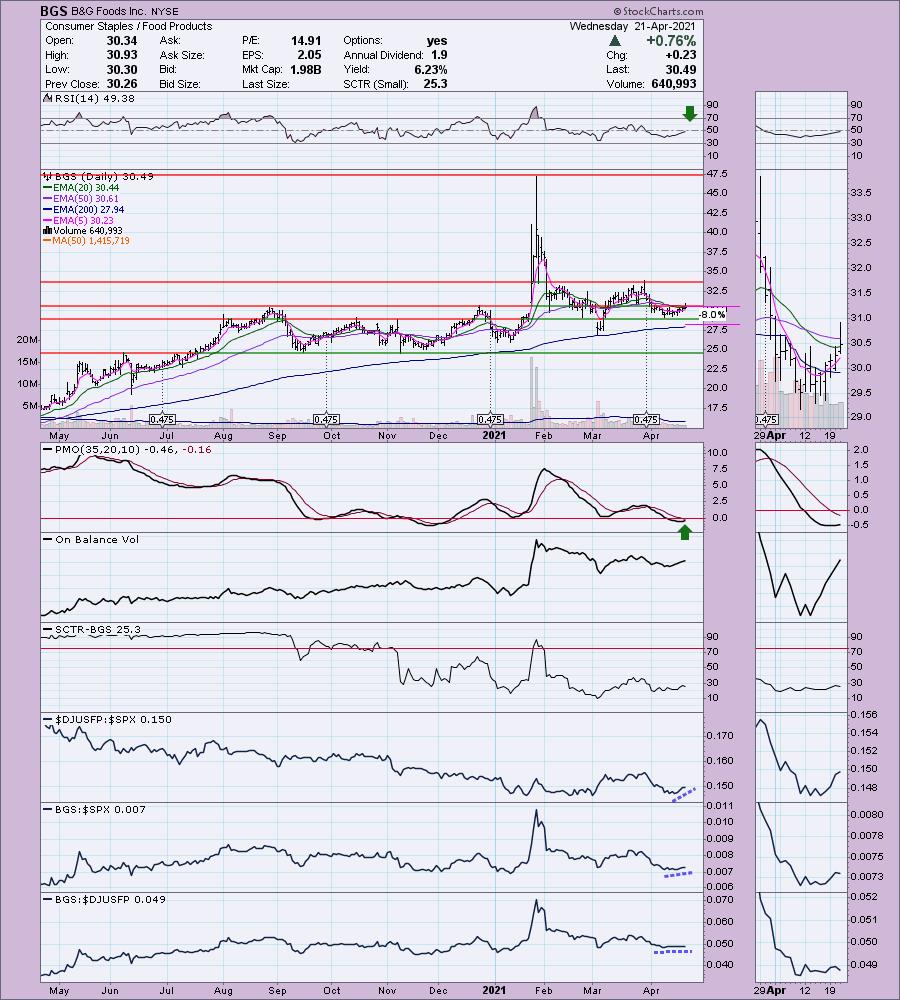
BGS is up +0.10% in after hours trading. This one we are trying to catch early. Consequently, the RSI is still negative territory; however, it is on its way into positive territory. Today price popped above strong overhead resistance at the August and December tops. We have another rounded price bottom which is bullish and the PMO has flattened in anticipation of rising toward a new crossover BUY signal. I set an 8% stop, but clearly you could tighten that up if you prefer given the most recent price low is only about 5% down.
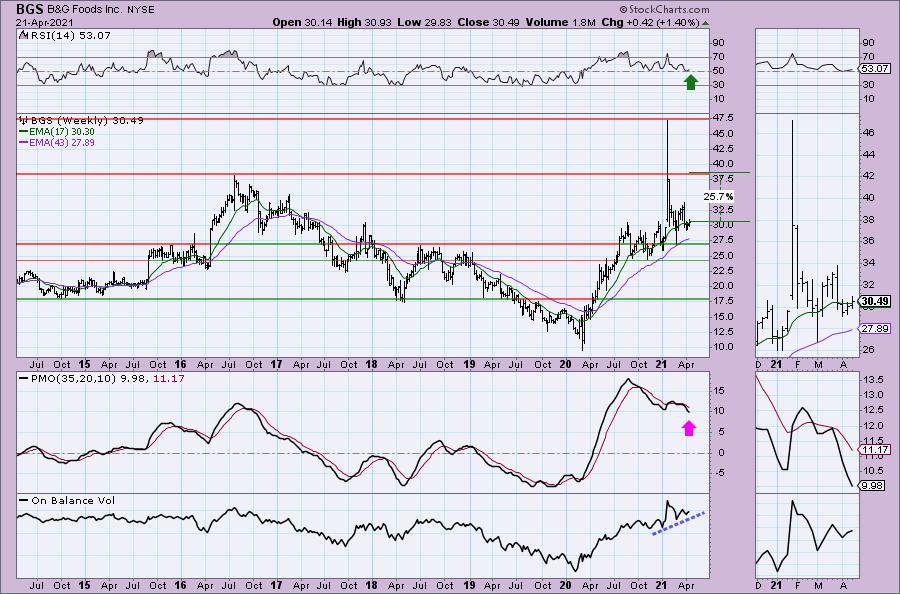
The weekly PMO is very ugly, but I like the current bounce of support at $30. The RSI is positive. I've marked the upside target at the 2016 high, but earlier this year it spiked much higher.
National Beverage Corp. (FIZZ)
EARNINGS: 6/30/2021 (AMC)
National Beverage Corp. engages in the development, manufacture, market, and sale of flavored beverage products. Its brands include Big Shot, Clear Fruit, Crystal Bay, Everfresh, Everfresh Premier Varietals, Faygo, LaCroix, LaCroix Cúrate, Mr.Pure, Nicola, Ohana, Ritz, Rip It, Rip It 2oz Shot, Ritz and Shasta. The company was founded by Nick A. Caporella in 1985 and is headquartered in Fort Lauderdale, FL.
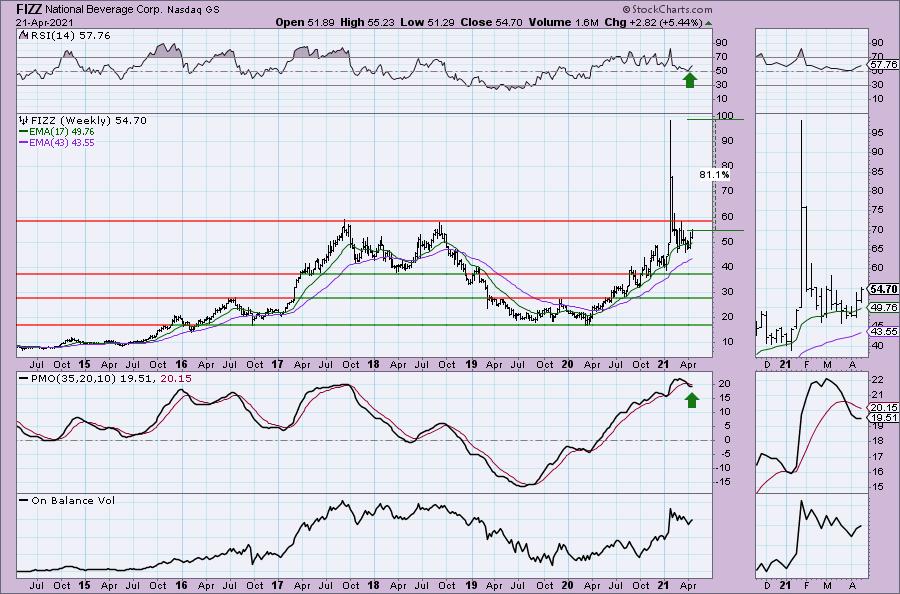
FIZZ is down -1.16% in after hours trading. I'm in the process of trying to get it in after hours trading on a limit order. If it doesn't execute, I'll be watching in the morning. I covered FIZZ in the November 12th 2020 report. It has since gone through a 2:1 split so based on that, the close was an adjusted $40.83. The stop was never hit and it is up 34.0% since then. However, on that closing high from 1/27/2020, it was up over 111%. There is a nice double-bottom pattern. It hasn't actually executed yet, but we're lying in wait. The PMO gave us a crossover BUY signal and yesterday it had a positive 20/50-EMA "Silver Cross" which triggered an IT Trend Model BUY signal. Volume is coming in and it is beginning to outperform. The RSI is positive and not overbought. This looks like an excellent basing pattern for FIZZ to break from. The stop is deep and honestly could be deeper, but I opted to lay it on support at the December top.
The weekly PMO is turning back up, as is the RSI. We do have very strong overhead resistance at the confirmation line for this pattern, so if it fails to overcome it, we may need to reconsider this position.
Vanda Pharmaceuticals Inc. (VNDA)
EARNINGS: 5/5/2021 (AMC)
Vanda Pharmaceuticals, Inc. engages in the development and commercialization of therapies for high unmet medical needs. The firm intends to treat schizophrenia, jet lag disorder, atopic dermatitis, central nervous system disorders, and circadian rhythm sleep disorder. Its product portfolio includes HETLIOZ, Fanapt, Tradipitant, Trichostatin, and AQW051. The company was founded by Mihael Hristos Polymeropoulos and Argeris N. Karabelas in 2002 and is headquartered in Washington, DC.
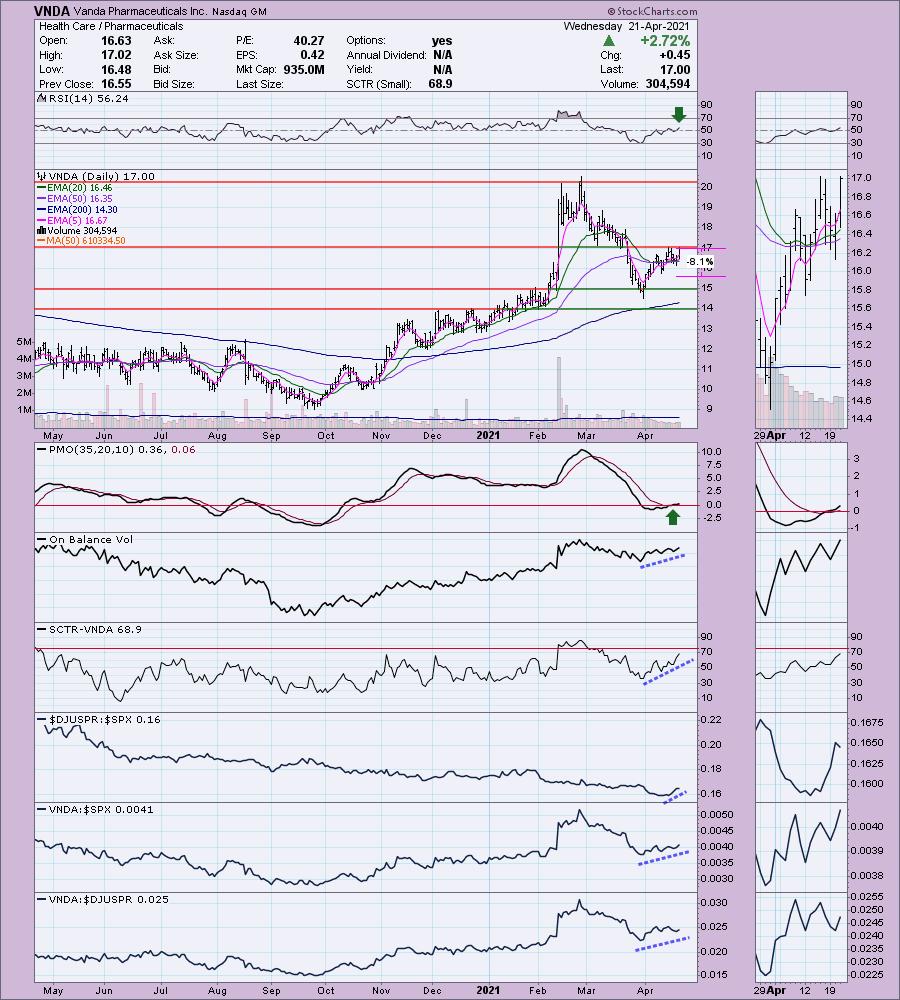
VNDA is down -1.74% in after hours trading. It had a strong rally today, so not a surprise to see it lower in after hours trading. I don't usually present this data, but apparently today VNDA triggered three pre-defined scans: Elder Bar Turned Green, New CCI Buy Signal and it Entered Ichimoku Cloud. I don't follow any of those indicators, but thought you might find it interesting.
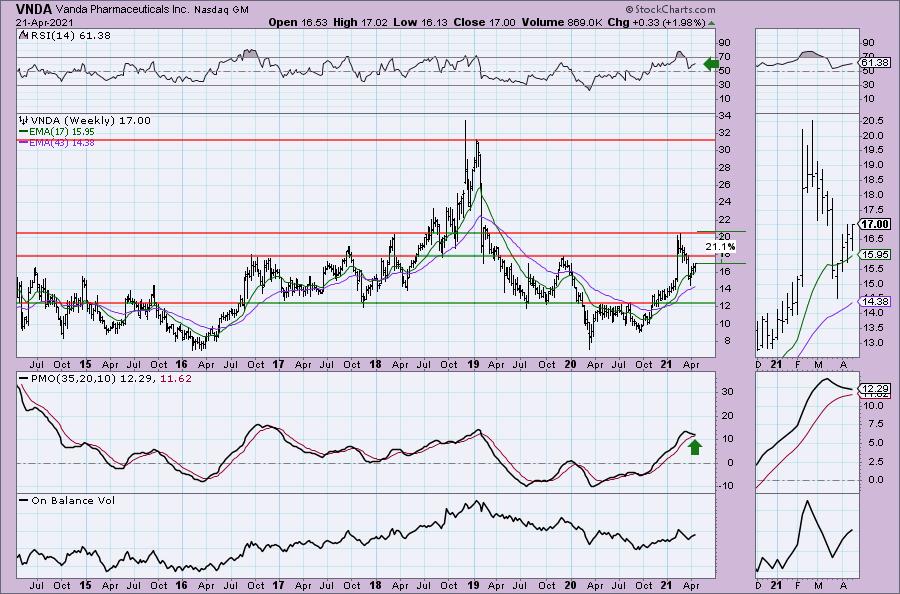
We are waiting for a breakout on VNDA. It should happen given a newly positive RSI and a new PMO crossover BUY signal. Additionally, the PMO is now in positive territory. The OBV is confirming and the SCTR is nearing 75. Performance has been pretty good. You can see that the Pharma industry group is beginning to wake up. The stop can be set at 6%, but I opted for more room on an 8.1% stop level. We need to see price hold above the 50-EMA.
The weekly PMO is flattening in anticipation of a rally continuation. The RSI is positive. I've put a conservative upside target at the 2021 top, but there's no reason it continue further if it break above that resistance line.
Don't forget, on Thursdays I look at reader-requested symbols, so shoot me an email at erin@decisionpoint.com. I read every email I receive and try to answer them all!
Full Disclosure: I'm about 80% invested and 20% is in 'cash', meaning in money markets and readily available to trade with. I have a limit order in on FIZZ.
Current Market Outlook:
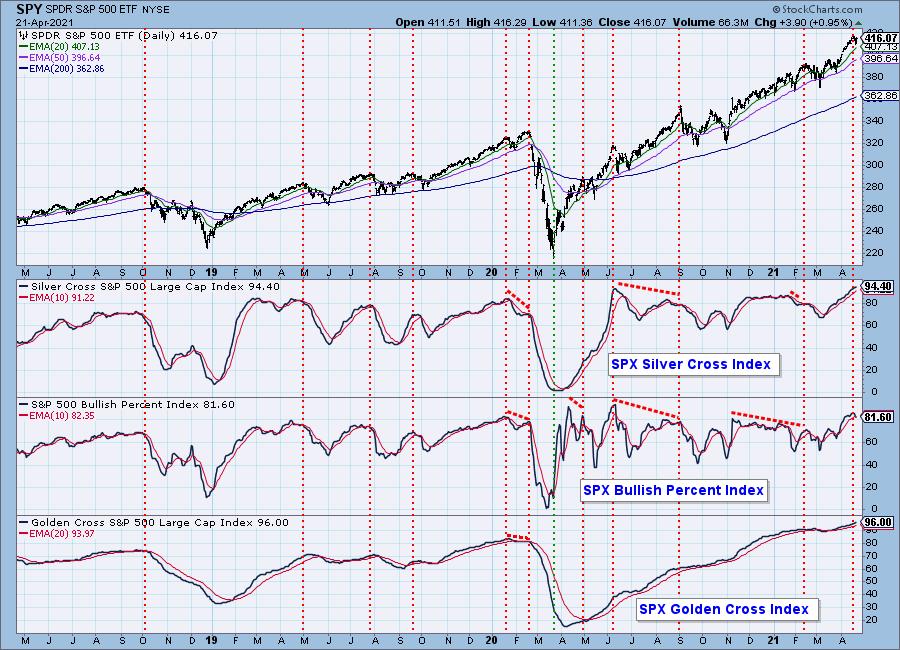
Market Environment: It is important to consider the odds for success by assessing the market tides. The following chart uses different methodologies for objectively showing the depth and trend of participation for intermediate- and long-term time frames.
- The Silver Cross Index (SCI) shows the percentage of SPX stocks on IT Trend Model BUY signals (20-EMA > 50-EMA)
- The Golden Cross Index (GCI) shows the percentage of SPX stocks on LT Trend Model BUY signals (50-EMA > 200-EMA)
- The Bullish Percent Index (BPI) shows the percentage of SPX stocks on Point & Figure BUY signals.
Don't forget that as a "Diamonds" member, you have access to our GCI/SCI curated ChartList on DecisionPoint.com. You'll find it under "Members Only" links on the left side on the Blogs and Links Page.
Here is the current chart:
Diamond Index:
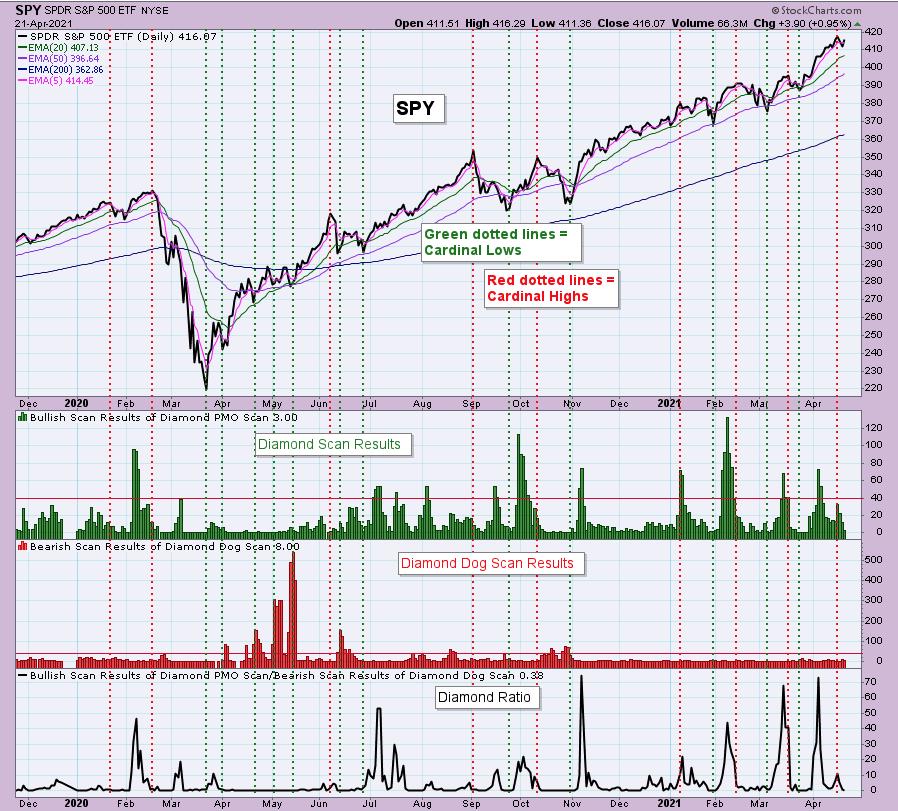
The Diamond Index chart looks at the number of scan results from my bullish Diamond PMO Scan and the number of scan results from the inverse Diamond Dog Scan. The Diamond Ratio divides the bullish results by the bearish results.
I only have data going back to October 2019 so I won't make any sweeping conclusions about the Diamond Index chart. I have marked cardinal tops with red dotted vertical lines and cardinal price bottoms with green dotted vertical lines. I believe that when the Diamond Dog results spike, it usually comes at a price bottom, or marks a strong continuation of the rising trend.
Unfortunately, the Diamond PMO Scan result numbers aren't providing much insight. The Diamond Ratio has promise, but again I don't see a clear correlation to the market tops/bottoms right now. I need to study and manipulate the data some more. Keep you posted!
Technical Analysis is a windsock, not a crystal ball.
Happy Charting!
- Erin
erin@decisionpoint.com
Watch the latest episode of DecisionPoint with Carl & Erin Swenlin on Mondays 7:00p EST or on the DecisionPoint playlist on the StockCharts TV YouTube channel here!
NOTE: The stocks reported herein are from mechanical trading model scans that are based upon moving average relationships, momentum and volume. DecisionPoint analysis is then applied to get five selections from the scans. The selections given should prompt readers to do a chart review using their own analysis process. This letter is not a call for a specific action to buy, sell or short any of the stocks provided. There are NO sure things or guaranteed returns on the daily selection of "diamonds in the rough."
Helpful DecisionPoint Links:
DecisionPoint Shared ChartList and DecisionPoint Chart Gallery
Price Momentum Oscillator (PMO)
Swenlin Trading Oscillators (STO-B and STO-V)
For more links, go to DecisionPoint.com!
