
The market kicked off on a high note and then hit a bass note by the end of the day. As Mary Ellen McGonagle and I prepared for today's Chartwise Women show on StockChartsTV , we discussed how Biotechs are beginning to show promise. I had a stock in my back pocket to review, but we ended up not having time. Consequently you will be the private recipients of the Biotech I like right now.
Reader Requests were strong, but I was able to whittle it down to three for analysis. I think you'll like these charts.
Overall, the market is healthy, but cracks are appearing. Today's reversal was likely a warning shot, so be sure and tighten your stops tonight if you haven't already. I did end up purchasing FIZZ. It's in the defensive Consumer Staples sector. The chart has been calling out to me since Tuesday.
A very healthy area of the market is Gold and Gold Miners. Small-caps are showing some promise so you should take a look at the Junior Gold Miners ETF (GDXJ). I will be rotating out of some of my more aggressive positions in favor of Miners. I wasn't going to include GDXJ charts, but another review and I simply had to, so you get a bonus on Reader Request Day!
Don't forget to sign up for tomorrow's Diamond Mine Trading Room! I'm sure the market will have plenty of surprises left for us tomorrow. Here is the registration LINK.
Today's "Diamonds in the Rough" are: ABST, ALKS, GDXJ, MGNX and UDR.
Stocks/ETFs to Consider (no order): FLO, FWONK, STAA, NVCR, ATRC, BCRX and CYTK.
 Diamond Mine REGISTRATION Information:
When: Apr 23, 2021 09:00 AM Pacific Time (US and Canada)
Topic: DecisionPoint Diamond Mine LIVE Trading Room
Register HERE for this webinar.
After registering, you will receive a confirmation email containing information about joining the webinar, including the password.
=======================================================================
Diamond Mine RECORDING Link from 4/9/2021:
Topic: DecisionPoint Diamond Mine (04/16/2021) LIVE Trading Room
Start Time : Apr 16, 2021 09:00 AM
Meeting Recording Link.
Access Passcode: April_16
***Click here to register for this recurring free DecisionPoint Trading Room on Mondays at Noon ET!***
+++++++++++++++++++++++++++++++++++++++++++++++++++++++++++++++++++++++++++++++
Free DP Trading Room RECORDING LINK:
Topic: DecisionPoint Trading Room
Start Time : Apr 19, 2021 08:56 AM
DP Trading Room Recording Link HERE.
Access Passcode: April/19
For best results, copy and paste the access code to avoid typos.
Welcome to DecisionPoint Daily Diamonds, wherein I highlight five "diamonds in the rough." These are selected from the results of my DecisionPoint scans, which search for stocks that could benefit from the trend and condition of the market. Remember, these are not recommendations to buy or sell, but are the most interesting of the stocks that surfaced in my scans. My objective is to save you the work of the initial, tedious culling process, but you need to apply your own analysis to see if these stocks pique your interest as well. There are no guaranteed winners here!
Absolute Software Corp. (ABST)
EARNINGS: N/A
Absolute Software Corp. engages in the provision of cloud-based service that supports the management and security of computing devices, applications, and data for a variety of organizations. Its solutions includes education, financial services, general date protection regulations (GDPR) compliance, government, healthcare, professional services, and technology solutions such as Absolute for Android, and Absolute for Chromebook. The company was founded on November 24, 1993 and is headquartered in Vancouver, Canada.
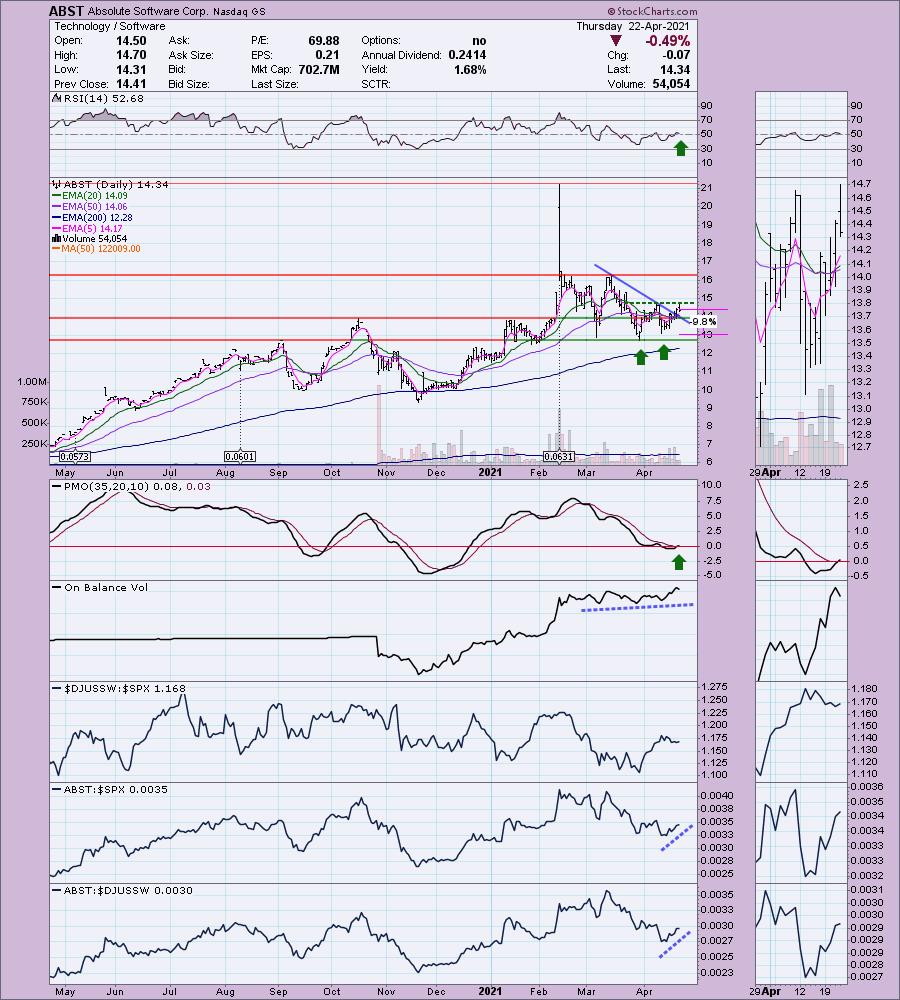
ABST is unchanged in after hours trading. This reader request looks very interesting on today's decline. I see a double-bottom pattern that is just about ready to execute. Price has broken the declining trend which is why I'm expecting that upside breakout. We see two recent Trend Model BUY signals. A "Silver Cross" IT Trend Model BUY signal (20-EMA > 50-EMA) and a ST Trend Model BUY signal (5-EMA > 20-EMA). The RSI is positive and the PMO just reached above zero on a new crossover BUY signal. The OBV is confirming the rising trend. Performance against the SPX is excellent. The stop is about as low I like to go, but if you want to reach the late March bottom that is an over 11.5% stop.
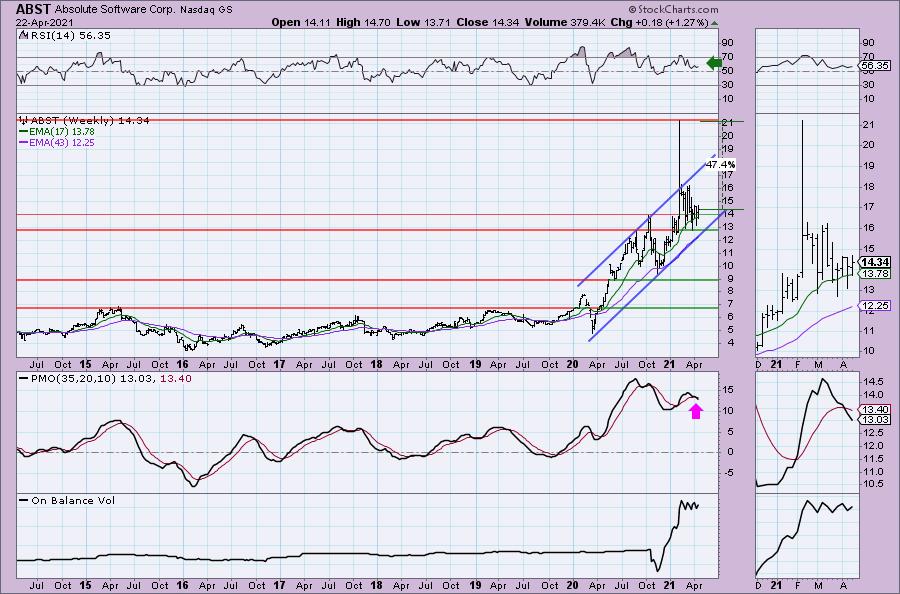
Other than the weekly PMO declining on a SELL signal, I like this weekly chart. ABST is in a strong IT rising trend channel. It didn't need to test the bottom of the channel this time around which suggest we will see a test of the top of the channel next. It's a solid 20% upside target if you go to $16.25 or if it can reach the top of the 'Pinocchio' bar as Martin Pring calls them, that is an over 47%+ gain.
Alkermes, Inc. (ALKS)
EARNINGS: 4/28/2021 (BMO)
Alkermes Plc is a biopharmaceutical company, which engages in the development, research, and commercialization of medicines that are designed to address unmet medical needs of patients in major therapeutic areas. Its products include Aristada, which is used for the treatment of schizophrenia in adults; and Vivitrol, which is an injectable medication for the treatment of alcohol dependence and for the prevention of relapse to opioid dependence, following opioid detoxification. The company was founded on May 4, 2011 and is headquartered in Dublin, Ireland.
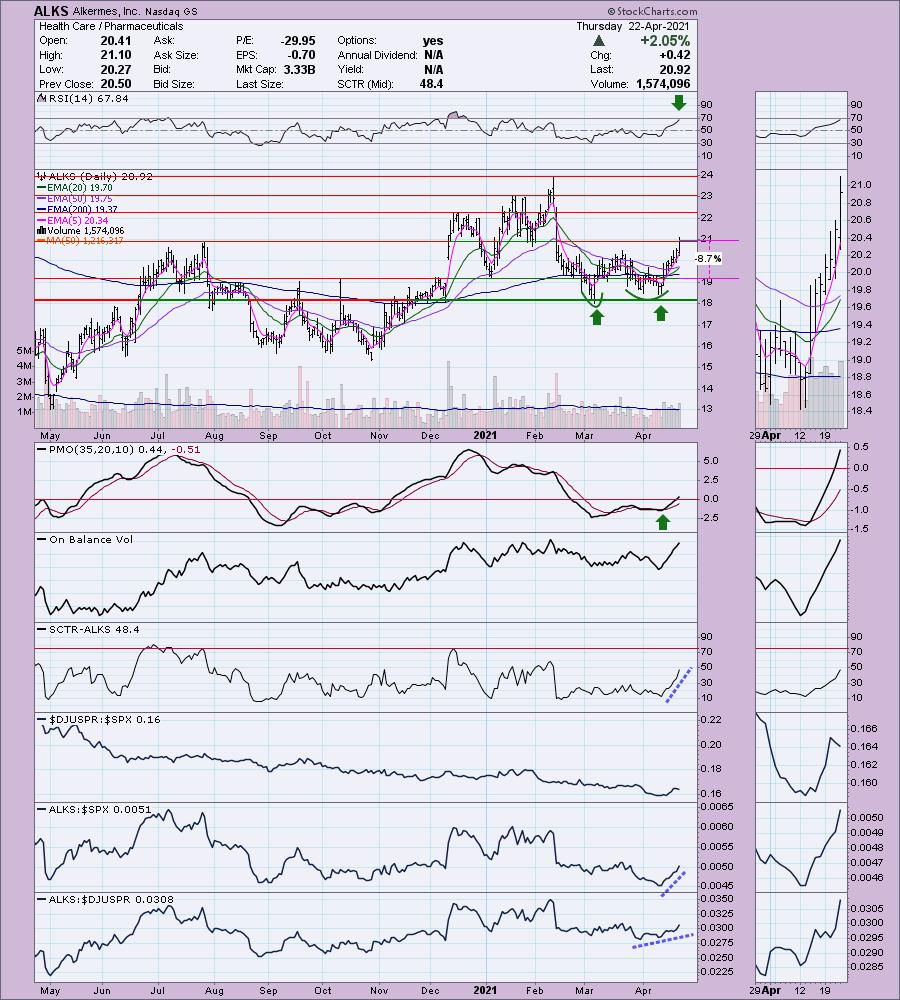
ALKS is unchanged in after hours trading. There is an "Adam and Eve" double-bottom formation that executed with today's strong rally. The upside target of the pattern is around $23. The RSI is positive and the PMO is on a BUY signal. The PMO also entered positive territory above the zero line. The 20-EMA is about to have a "silver cross" over the 50-EMA which would give us an IT Trend Model BUY signal. It is performing exceptionally well against the SPX. The stop is set at the October high.
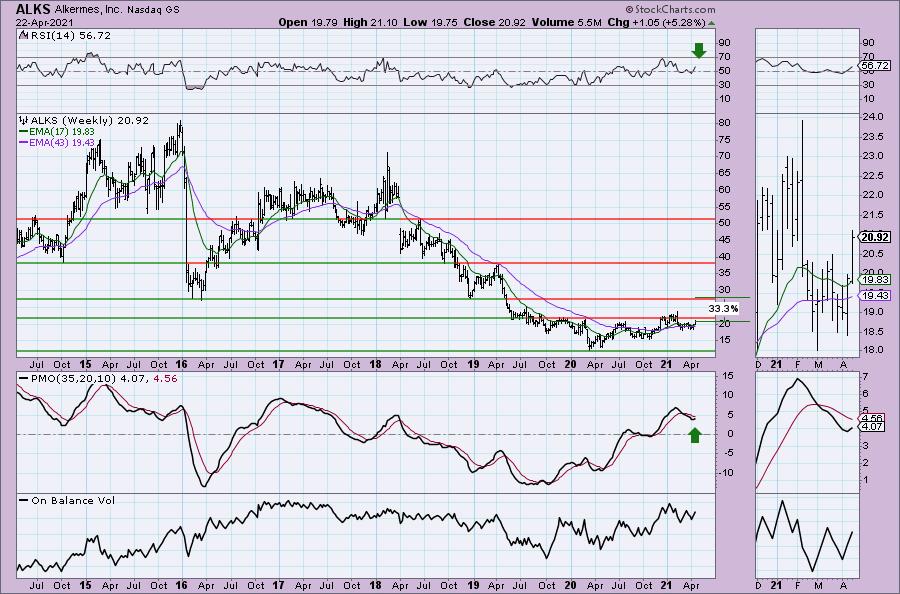
The weekly chart looks great. The only real issue is that we have fairly strong overhead resistance around $22, but given the rising PMO and positive RSI, I am expecting to see a breakout and move to test the 2016 and 2018 lows which is a 33%+ gain.
VanEck Vectors Junior Gold Miners ETF (GDXJ)
EARNINGS: N/A
GDXJ tracks a market-cap-weighted index of global gold- and silver-mining firms, focusing on small caps.
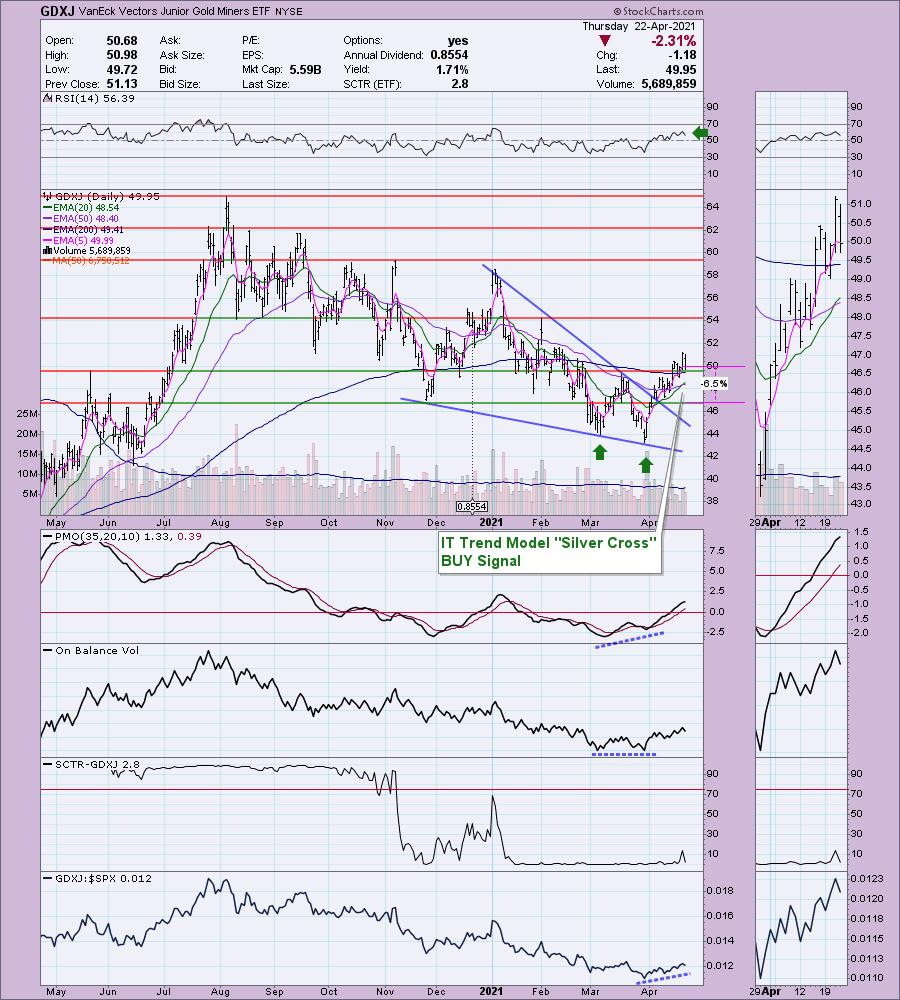
GDXJ is up +0.04% in after hours trading. I covered GDXJ as a reader request on May 29th 2020. I wasn't fond of it then and it promptly hit my 7% stop level in mid-June. I covered it again on June 29th 2020. The 8% stop wasn't hit until the end of March 2021. Guaranteed we would have bailed out on the late July pullback or the gap down in early August after its incredible 30%+ move out of the close on 6/29/2020. The chart looks excellent right now, especially on today's hefty pullback. The PMO wasn't damaged on today's pullback and the RSI is still positive. The first pattern to execute was the bullish falling wedge. Now we have a double-bottom. Price pulled back to sit right on the confirmation line. There is a new IT Trend Model "Silver Cross" BUY signal as the 20-EMA just crossed over the 50-EMA. The PMO and OBV have positive divergences with the double-bottom lows. It's outperforming the SPX too. The stop is set beneath the November low.
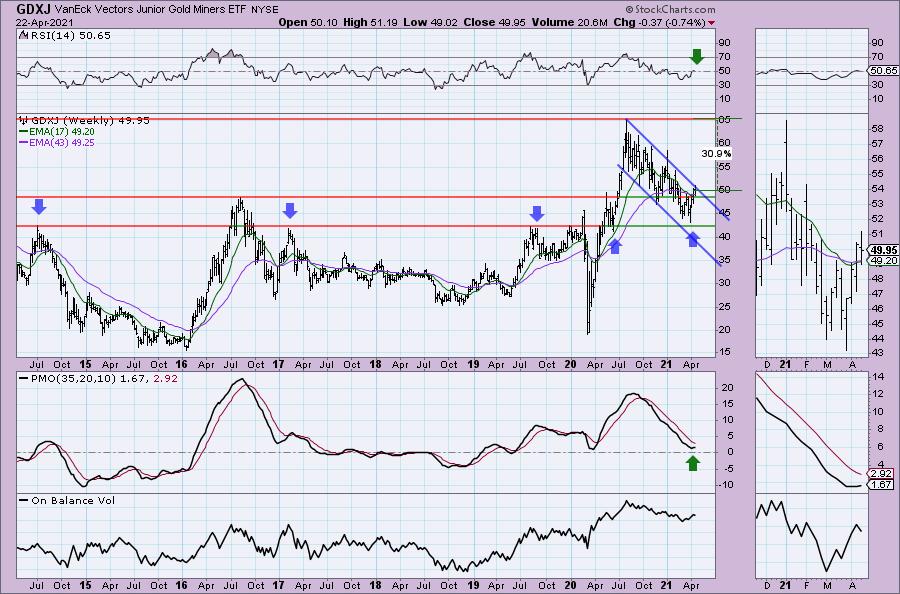
The weekly PMO is just now turning up. Price didn't need to test the bottom of the declining trend channel before returning to test the top, which suggests we will see an upside breakout. Notice price bounced off a very strong support level, lots of "touches" around $42. The weekly RSI just hit positive territory. In the thumbnail you can see the positive OBV divergence between double-bottom lows and rising OBV lows.
MacroGenics Inc. (MGNX)
EARNINGS: 4/29/2021 (AMC)
MacroGenics, Inc. is a clinical-stage biopharmaceutical company, which engages in discovering and developing antibody-based therapeutics designed to modulate the human immune response for the treatment of cancer. Its product pipeline includes Margetuximab, Flotetuzumab, Retifanlimab, Enoblituzumab, Tebotelimab, MGC018, MGD019, IMGC936, and MGD014 for infectious diseases. The company was founded by Scott E. Koenig, Jeffrey V. Ravetch, LeRoy E. Hood, Ruedi Aebersold, and Alan Aderem on August 14, 2000 and is headquartered in Rockville, MD.
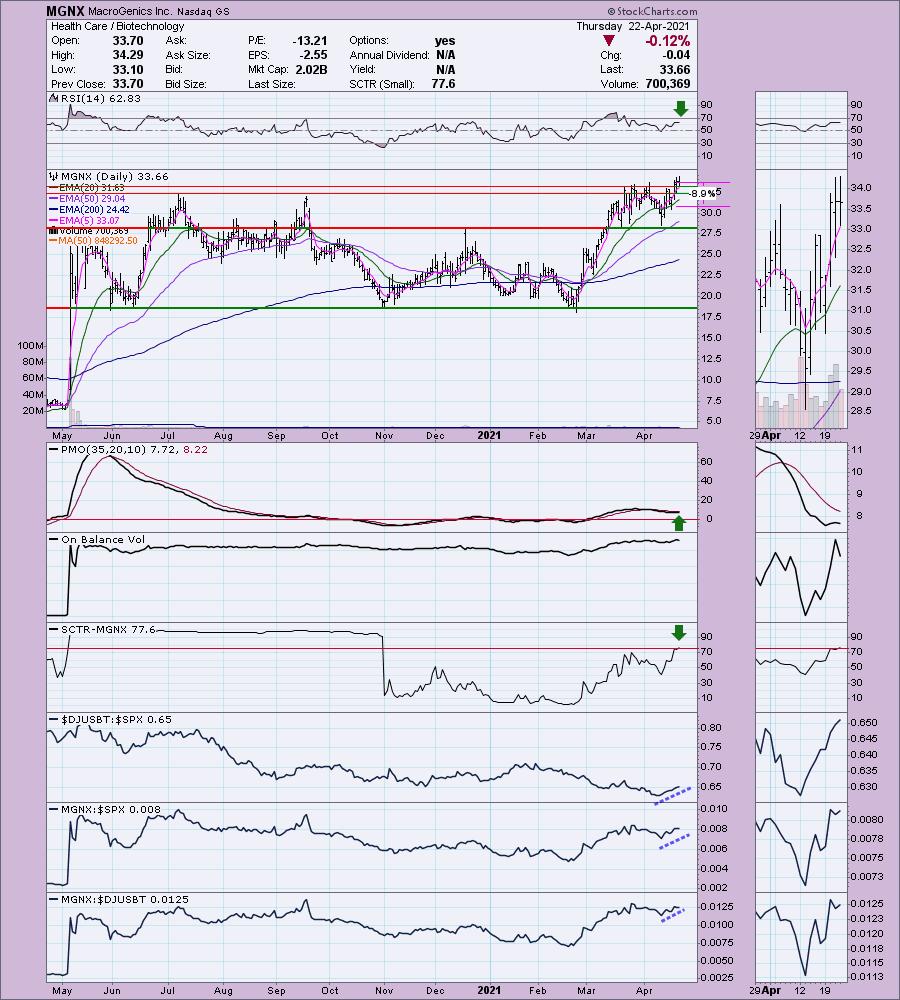
MGNX is unchanged in after hours trading. I had trouble deciding between this Biotech versus Cytokinetics (CYTK). They both are outperforming their industry group, but the weekly chart is what swayed me. The daily chart shows a breakout from a long-term basing pattern or trading range. The RSI is positive and the SCTR just entered the "hot zone" above 75. The PMO is a little concerning as it flattened very quickly on a rather benign decline today. The stop is set midway down into the short-term trading range.
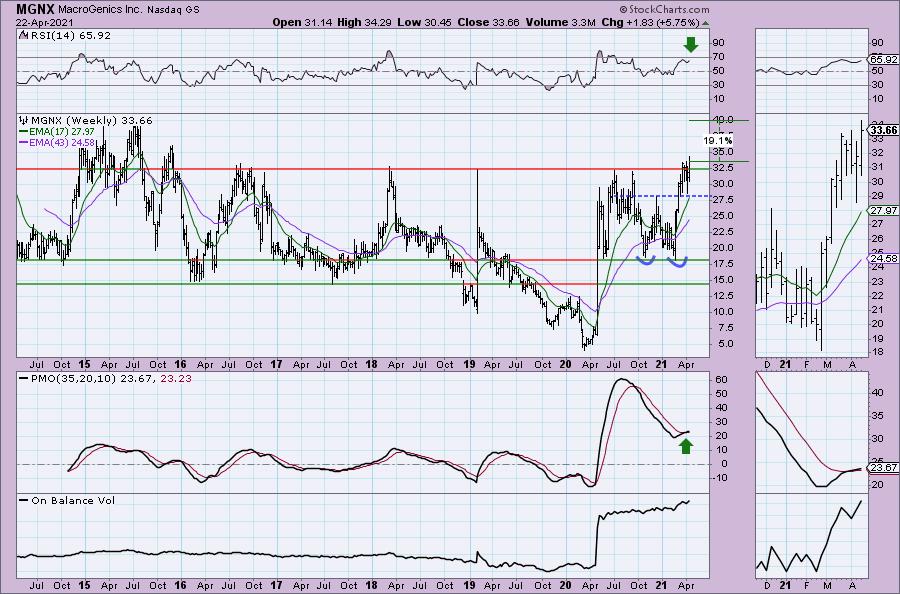
We have a large double-bottom pattern that has already executed and calls for an upside target around $40. The weekly RSI is positive and the weekly PMO just had a crossover BUY signal. Notice the strength of overhead resistance at $32.50. Numerous long-term "touches" and now, it has broken out above that level.
United Dominion Realty Trust (UDR)
EARNINGS: 4/27/2021 (AMC)
UDR, Inc. is a real estate investment trust, which owns, operates, acquires, renovates, develops, redevelops, disposes of, and manages multifamily apartment communities. It engages in the multi-family real estate investment trust business. It operates through the Same-Store Communities and Non-Mature Communities/Other segments. The Same-Store Communities segment pertains to properties that are acquired, developed, and stabilized occupancy. The Non-Mature Communities/Other segment include recently acquired, developed and redeveloped communities and the non-apartment components of mixed use properties. The company was founded in 1972 and is headquartered in Highlands Ranch, CO.
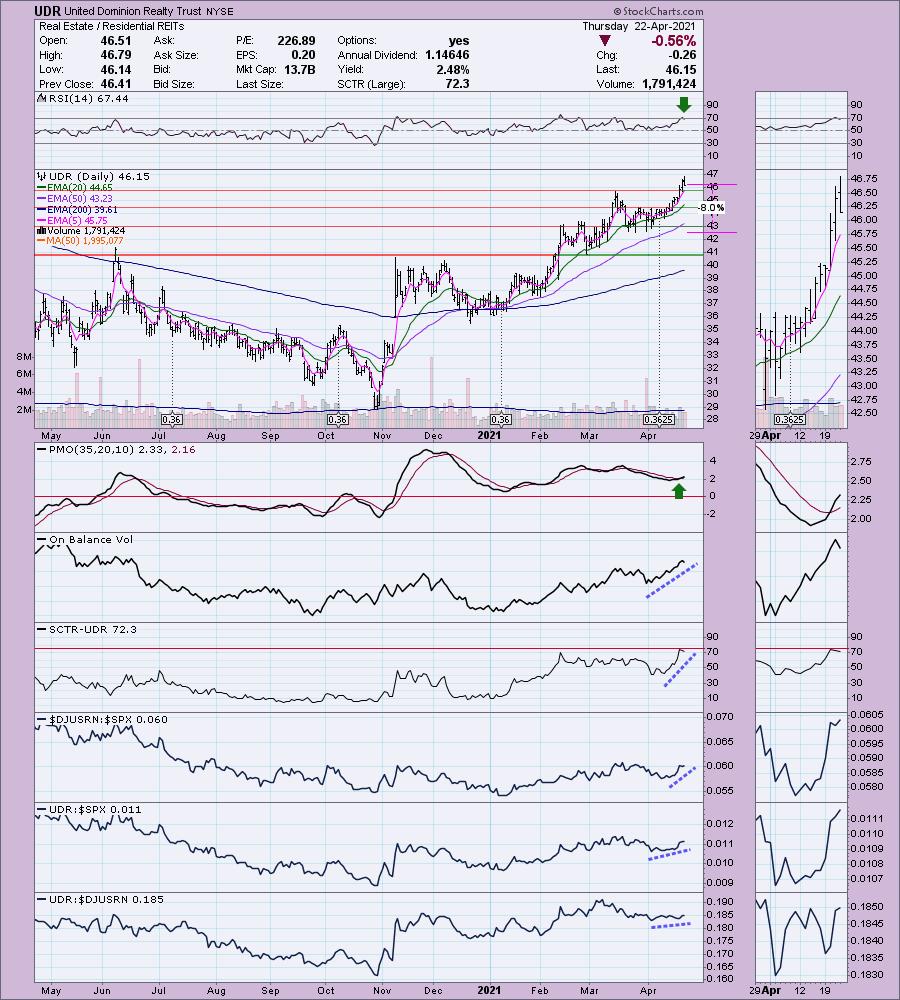
UDR is unchanged in after hours trading. REITs have been heating up this month and UDR is no exception. Today's decline was constructive as it took the RSI out of overbought territory. Despite the decline, the PMO is rising strongly after generating a crossover BUY signal. It's performing well against the SPX and the SCTR is respectable. Volume is coming in based on the OBV. The stop is reasonable at 8%.
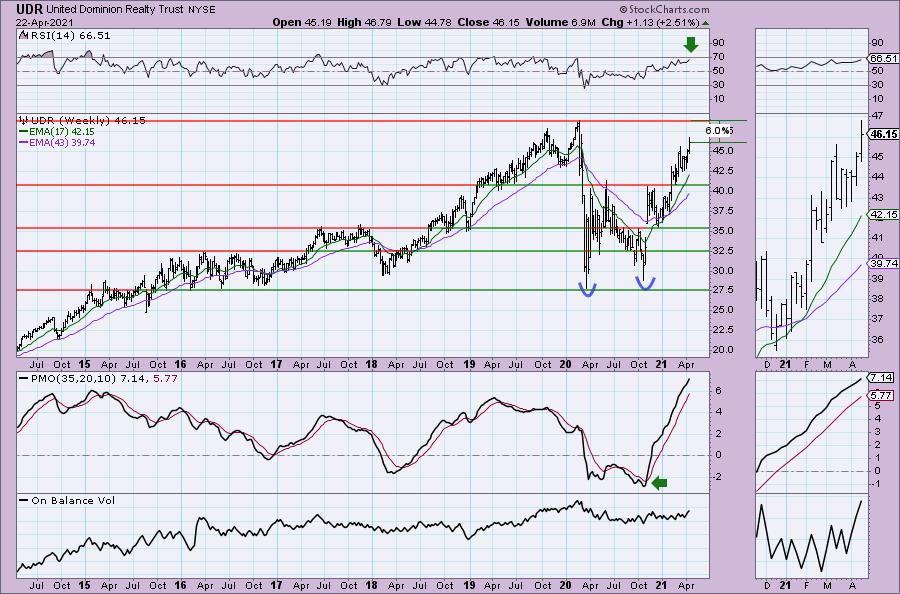
There is a large double-bottom on the weekly chart. It has already executed, but the upside target has yet to be reached. I've calculated it to be around $55 or so.
Don't forget, on Thursdays I look at reader-requested symbols, so shoot me an email at erin@decisionpoint.com. I read every email I receive and try to answer them all!
Full Disclosure: I'm about 85% invested and 15% is in 'cash', meaning in money markets and readily available to trade with. I purchased FIZZ and will be purchasing GDXJ tomorrow. I'll be looking to unload a few stocks tomorrow to reduce my exposure to closer to 70% with most being in Materials and Consumer Staples sectors.
Current Market Outlook:
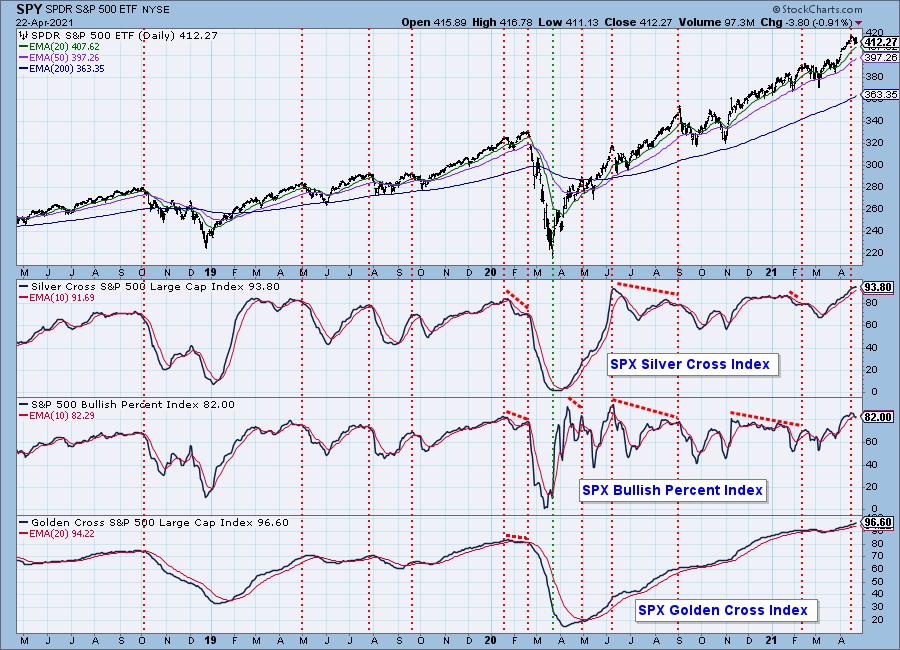
Market Environment: It is important to consider the odds for success by assessing the market tides. The following chart uses different methodologies for objectively showing the depth and trend of participation for intermediate- and long-term time frames.
- The Silver Cross Index (SCI) shows the percentage of SPX stocks on IT Trend Model BUY signals (20-EMA > 50-EMA)
- The Golden Cross Index (GCI) shows the percentage of SPX stocks on LT Trend Model BUY signals (50-EMA > 200-EMA)
- The Bullish Percent Index (BPI) shows the percentage of SPX stocks on Point & Figure BUY signals.
Don't forget that as a "Diamonds" member, you have access to our GCI/SCI curated ChartList on DecisionPoint.com. You'll find it under "Members Only" links on the left side on the Blogs and Links Page.
Here is the current chart:
Diamond Index:
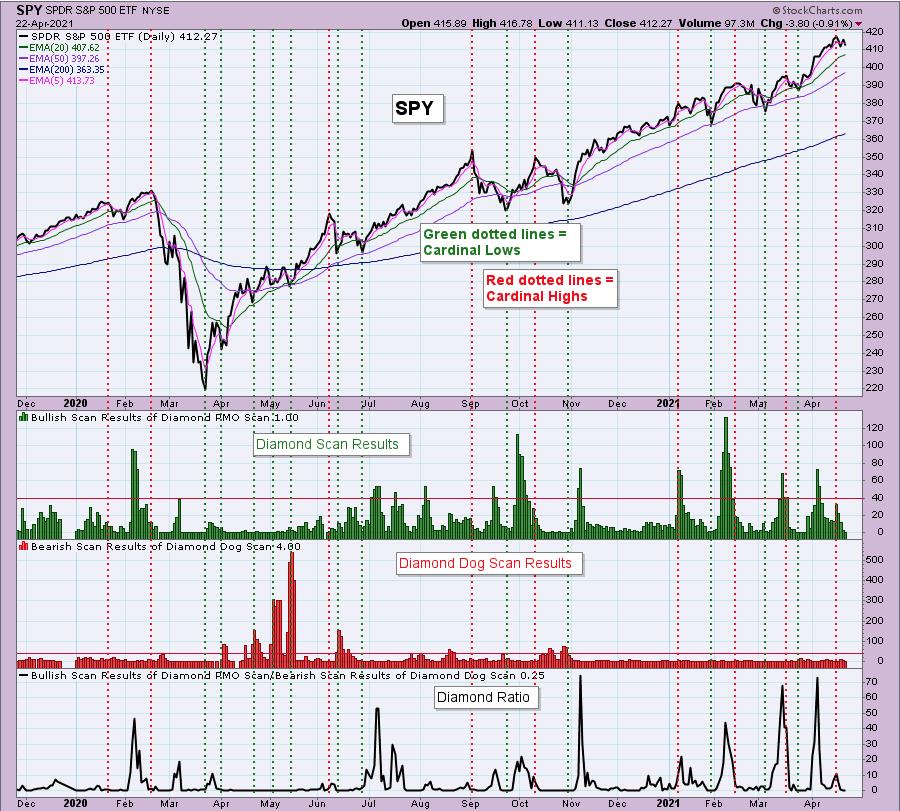
The Diamond Index chart looks at the number of scan results from my bullish Diamond PMO Scan and the number of scan results from the inverse Diamond Dog Scan. The Diamond Ratio divides the bullish results by the bearish results.
I only have data going back to October 2019 so I won't make any sweeping conclusions about the Diamond Index chart. I have marked cardinal tops with red dotted vertical lines and cardinal price bottoms with green dotted vertical lines. I believe that when the Diamond Dog results spike, it usually comes at a price bottom, or marks a strong continuation of the rising trend.
Unfortunately, the Diamond PMO Scan result numbers aren't providing much insight. The Diamond Ratio has promise, but again I don't see a clear correlation to the market tops/bottoms right now. I need to study and manipulate the data some more. Keep you posted!
Technical Analysis is a windsock, not a crystal ball.
Happy Charting!
- Erin
erin@decisionpoint.com
Watch the latest episode of DecisionPoint with Carl & Erin Swenlin on Mondays 7:00p EST or on the DecisionPoint playlist on the StockCharts TV YouTube channel here!
NOTE: The stocks reported herein are from mechanical trading model scans that are based upon moving average relationships, momentum and volume. DecisionPoint analysis is then applied to get five selections from the scans. The selections given should prompt readers to do a chart review using their own analysis process. This letter is not a call for a specific action to buy, sell or short any of the stocks provided. There are NO sure things or guaranteed returns on the daily selection of "diamonds in the rough."
Helpful DecisionPoint Links:
DecisionPoint Shared ChartList and DecisionPoint Chart Gallery
Price Momentum Oscillator (PMO)
Swenlin Trading Oscillators (STO-B and STO-V)
For more links, go to DecisionPoint.com!
