
While scanning for today's "diamonds in the rough", I found myself looking at bullish chart patterns throughout my results. I also noticed that REITS and Biotechs were the leaders. Unfortunately, most of the REITs and many of the Biotechs had made incredible runs to the upside already. The storage industry has been on fire. So while I liked many of the results today, too many of them had either popped too high today or were very overbought.
I had really liked FIZZ with its double-bottom, but it is down well over 2% now in after hours trading so I decided to leave it in the "stocks to consider" category.
I added some of the stocks under the "Stocks to Consider" section for your review. Most are Biotechs.
Today's "Diamonds in the Rough" are: ELAN, ICLK, and NNN.
Stocks/ETFs to Consider: CVM, FIZZ, GKOS, HLF and SILK.
 Diamond Mine REGISTRATION Information:
When: Apr 23, 2021 09:00 AM Pacific Time (US and Canada)
Topic: DecisionPoint Diamond Mine LIVE Trading Room
Register HERE for this webinar.
After registering, you will receive a confirmation email containing information about joining the webinar, including the password.
=======================================================================
Diamond Mine RECORDING Link from 4/9/2021:
Topic: DecisionPoint Diamond Mine (04/16/2021) LIVE Trading Room
Start Time : Apr 16, 2021 09:00 AM
Meeting Recording Link.
Access Passcode: April_16
***Click here to register for this recurring free DecisionPoint Trading Room on Mondays at Noon ET!***
+++++++++++++++++++++++++++++++++++++++++++++++++++++++++++++++++++++++++++++++
Free DP Trading Room RECORDING LINK:
Topic: DecisionPoint Trading Room
Start Time : Apr 19, 2021 08:56 AM
DP Trading Room Recording Link HERE.
Access Passcode: April/19
For best results, copy and paste the access code to avoid typos.
Welcome to DecisionPoint Daily Diamonds, wherein I highlight five "diamonds in the rough." These are selected from the results of my DecisionPoint scans, which search for stocks that could benefit from the trend and condition of the market. Remember, these are not recommendations to buy or sell, but are the most interesting of the stocks that surfaced in my scans. My objective is to save you the work of the initial, tedious culling process, but you need to apply your own analysis to see if these stocks pique your interest as well. There are no guaranteed winners here!
Elanco Animal Health Inc. (ELAN)
EARNINGS: 5/7/2021 (BMO)
Elanco Animal Health, Inc. engages in the innovation, development, manufacture and market products for companion and food animals. It offers products through the following four categories: Companion Animal Disease Prevention, Companion Animal Therapeutics, Food Animal Future Protein & Health, and Food Animal Ruminants & Swine. The Companion Animal Disease Prevention category engages in the broadest parasiticide portfolios in the companion animal sector based on indications, species and formulations, with products that protect pets from worms, fleas and ticks. The Companion Animal Therapeutics category provides the details of broad pain and osteoarthritis portfolio across species, modes of action, indications and disease stages. The Food Animal Future Protein & Health category includes vaccines, nutritional enzymes and animal-only antibiotics, serves the growing demand for protein and includes innovative products in poultry and aquaculture production, where demand for animal health products is outpacing overall industry growth. It also focuses on developing functional nutritional health products that promote food animal health, including enzymes, probiotics and prebiotics. The Food Animal Ruminants & Swine category develops animal food products used in ruminant and swine production. The company was founded on May 3, 2018 and is headquartered in Greenfield, IN.
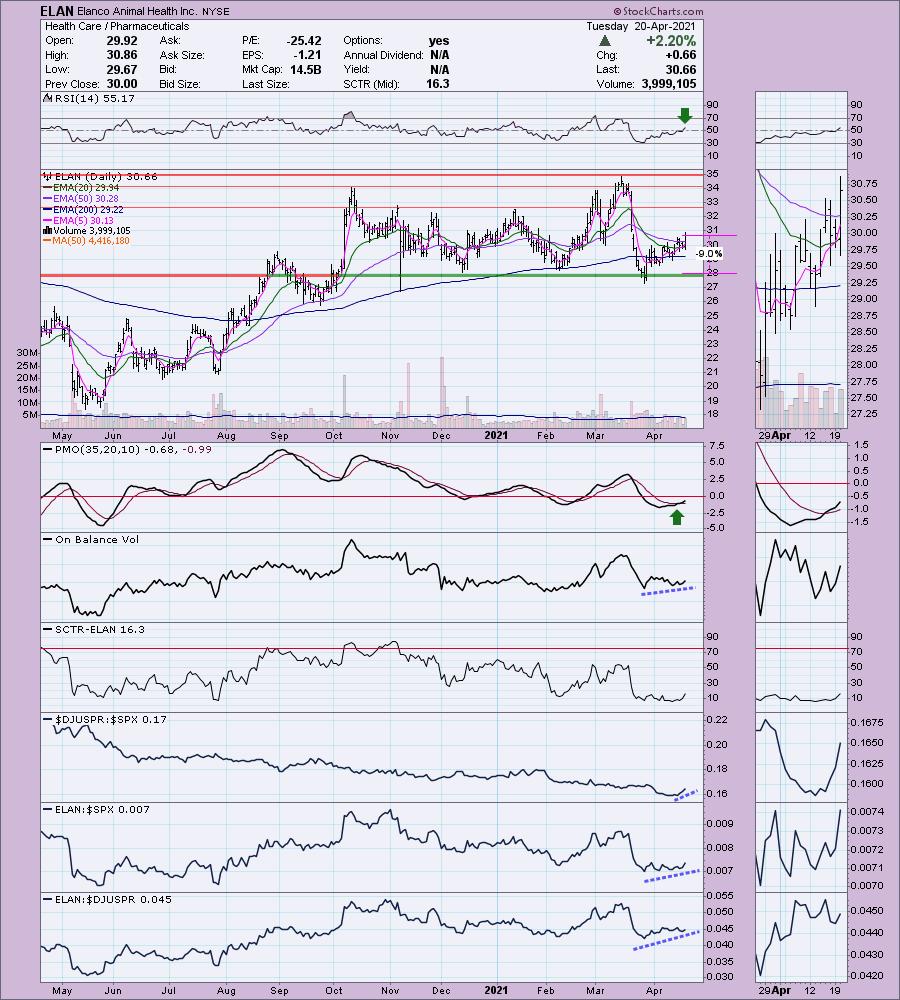
ELAN is up +0.03% in after hours trading. I covered ELAN back on February 17th 2021. It's mostly unchanged from then to now; however, after this one was presented it ran up 16%+. Technically, it barely hit the stop on the March low. It's a trading range type of stock and it appears ready to test the top of the range. The RSI is positive, price just poked above the 50-EMA and we have a new 5/20-EMA positive crossover for a ST Trend Model BUY signal. Additionally, the PMO gave us a crossover BUY signal last week. The OBV is okay... it's confirming the rising price bottoms, but OBV tops are in a slight decline while price is moving higher. The SCTR is beginning to show signs of life and performance has been good. I set the stop close to strong support at the bottom of the trading range.
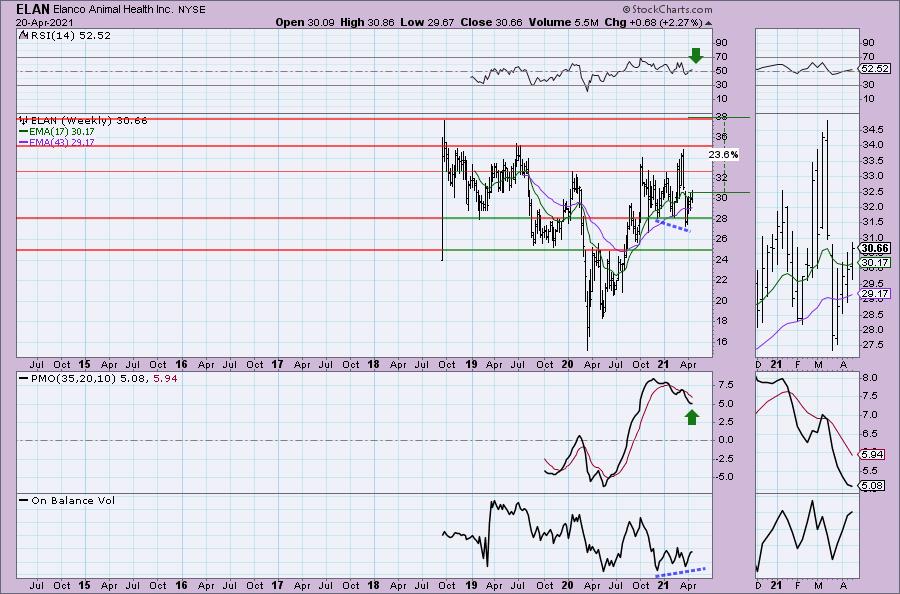
It didn't hit its upside target at the all-time high last time around, but we are looking for it this time. The weekly RSI is positive and the weekly PMO is beginning to turn back up. A somewhat similar situation to last time I picked it.
iClick Interactive Asia Group Ltd. (ICLK)
EARNINGS: 5/21/2021 (BMO)
iClick Interactive Asia Group Ltd. is a holding company, engages in the provision of online marketing and data technology platform. Its data-driven solutions help marketers identify, engage, and activate potential customers, monitor and measure the results of marketing campaigns, and create content catering to potential customers across different content distribution channels through both personal computer and mobile devices. The company was founded by Wing Hong Hsieh, Ricky Ng, and Jian Tang on February 3, 2010 and is headquartered in Hong Kong.
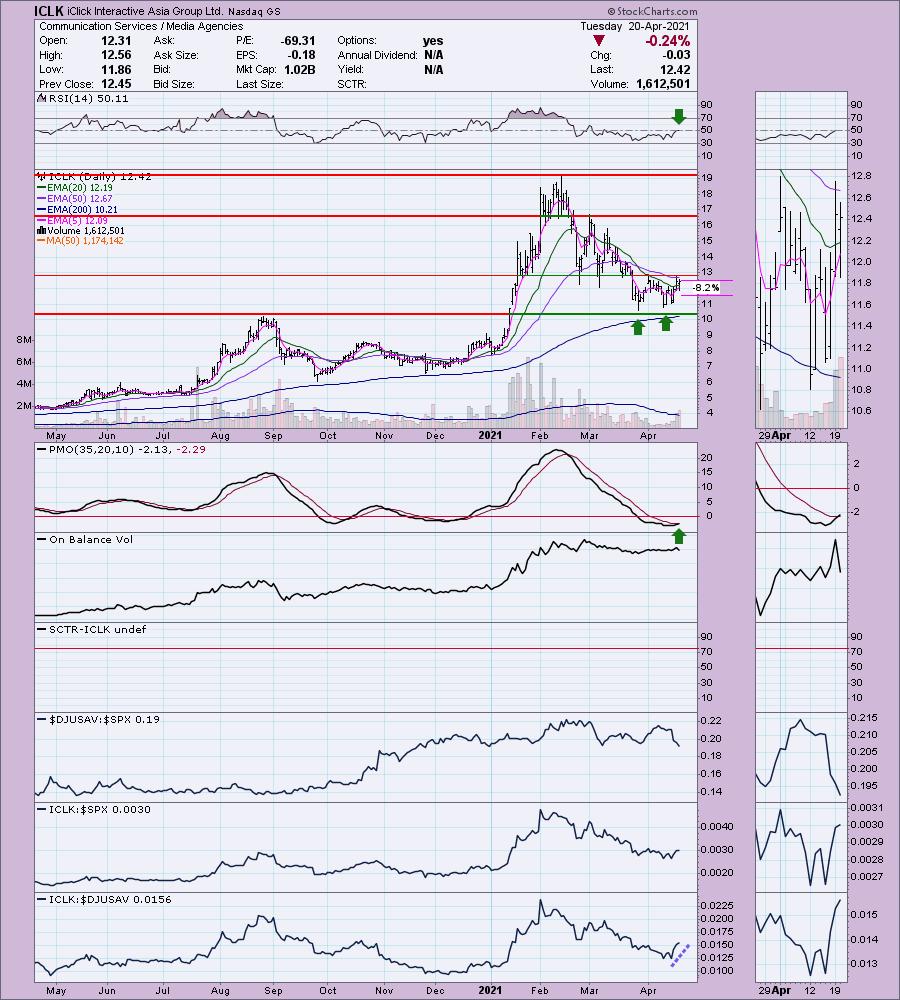
ICLK is unchanged in after hours trading. Here is a fairly textbook bullish double-bottom pattern. Currently price hasn't crossed above the confirmation line nor the 50-EMA. This one is percolating with a brand new PMO crossover BUY signal and newly positive RSI. It's performed adequately against the SPX. It's outpaced its industry group, but the group has been underperforming, so I don't count that as much of a plus. The stop is set midway down the double-bottom pattern.
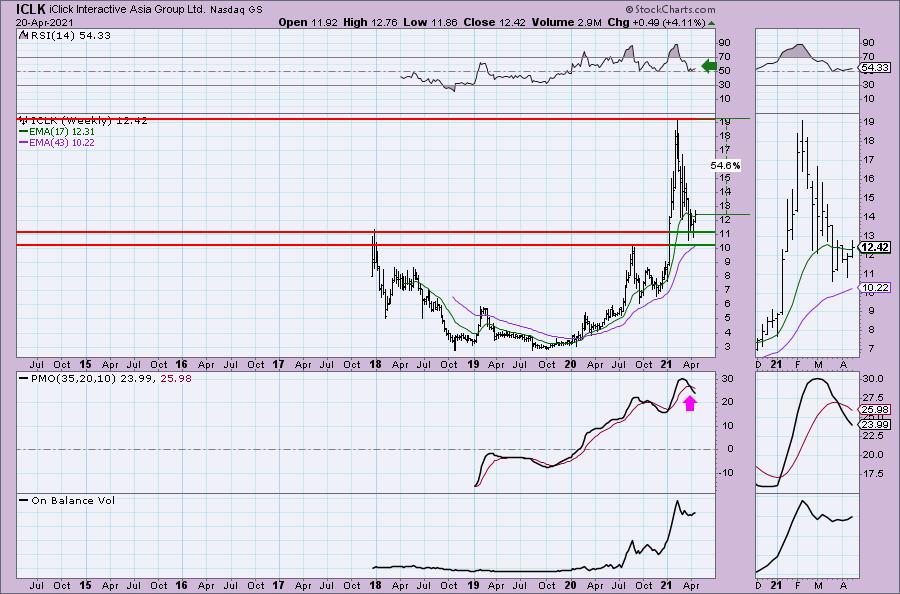
The weekly RSI has just turned up before reaching negative territory. The weekly PMO isn't favorable, but this is a strong area of support for price to bounce off. Upside potential is tasty.
National Retail Properties Inc. (NNN)
EARNINGS: 5/4/2021 (BMO)
National Retail Properties, Inc. is a real estate investment trust, which engages in investing in properties subject to long-term net leases. It acquires, owns, invests in, and develops properties that are leased to retail tenants under long-term net leases and held for investment. The company was founded on August 8, 1984 and is headquartered in Orlando, FL.
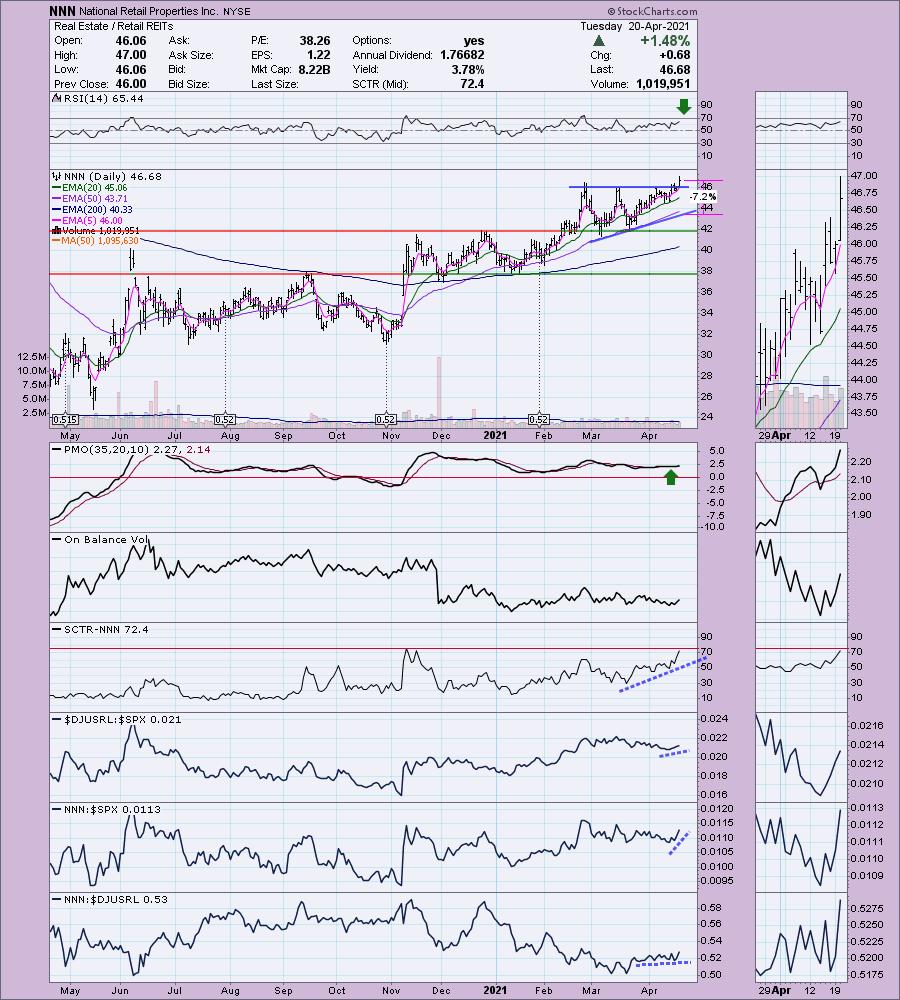
NNN is up +0.69% in after hours trading. I like the bullish ascending triangle breakout. The RSI is positive and not overbought. The PMO has a recent crossover BUY signal. The OBV is mostly flat, but you can volume expanded on this breakout. I set a rather tight stop; mainly because there is no need to keep it if it loses the bottom of the triangle.
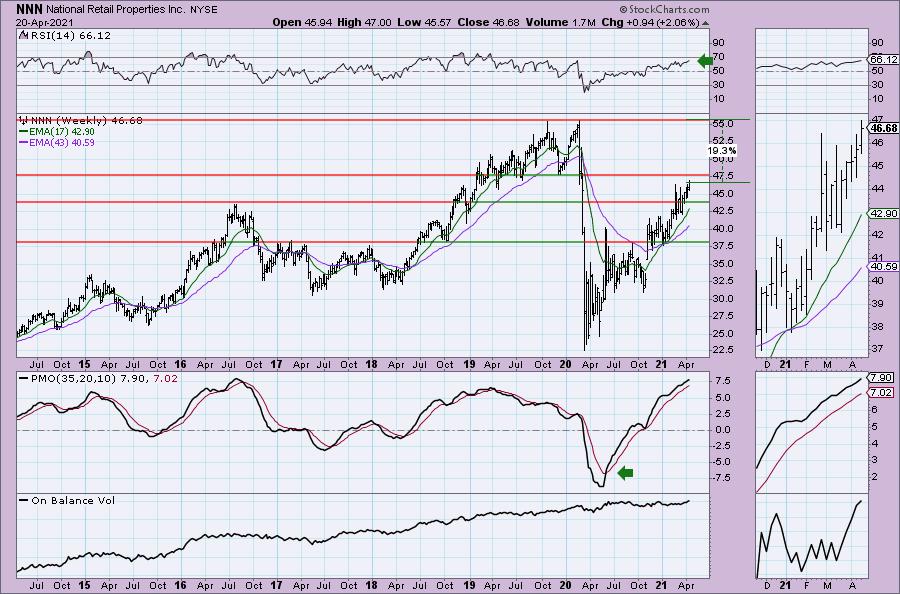
The weekly PMO is rising, albeit on the overbought side. However, the RSI is positive and is not overbought.
Don't forget, on Thursdays I look at reader-requested symbols, so shoot me an email at erin@decisionpoint.com. I read every email I receive and try to answer them all!
Full Disclosure: I'm about 80% invested and 20% is in 'cash', meaning in money markets and readily available to trade with. Still contemplating a Gold Miner SBSW, GOLD and NEM on my radar.
Current Market Outlook:
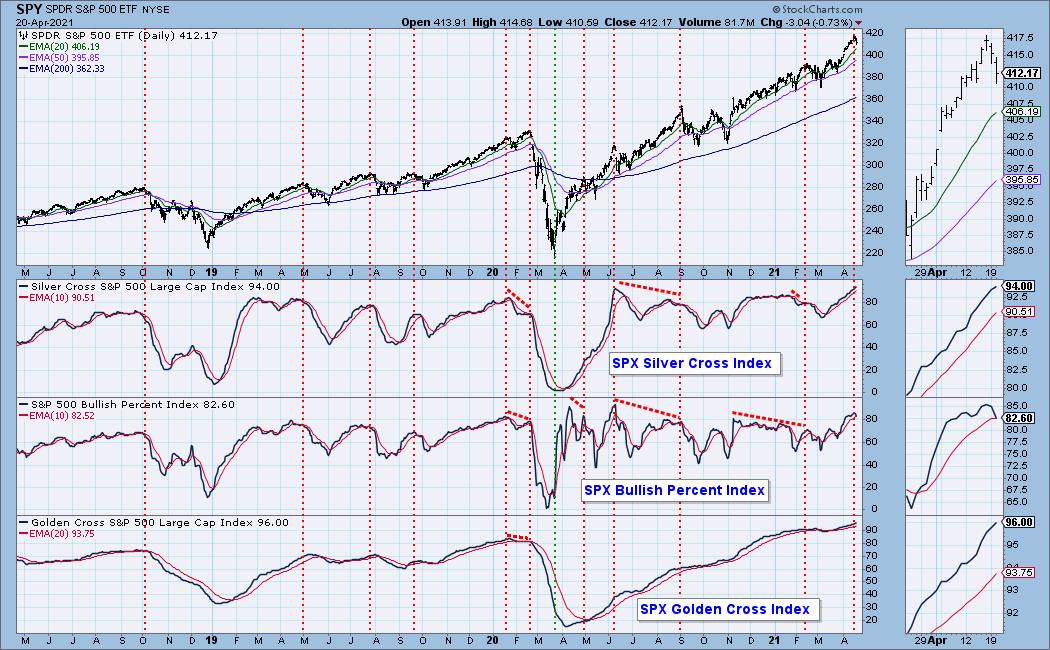
Market Environment: It is important to consider the odds for success by assessing the market tides. The following chart uses different methodologies for objectively showing the depth and trend of participation for intermediate- and long-term time frames.
- The Silver Cross Index (SCI) shows the percentage of SPX stocks on IT Trend Model BUY signals (20-EMA > 50-EMA)
- The Golden Cross Index (GCI) shows the percentage of SPX stocks on LT Trend Model BUY signals (50-EMA > 200-EMA)
- The Bullish Percent Index (BPI) shows the percentage of SPX stocks on Point & Figure BUY signals.
Don't forget that as a "Diamonds" member, you have access to our GCI/SCI curated ChartList on DecisionPoint.com. You'll find it under "Members Only" links on the left side on the Blogs and Links Page.
Here is the current chart:
Diamond Index:
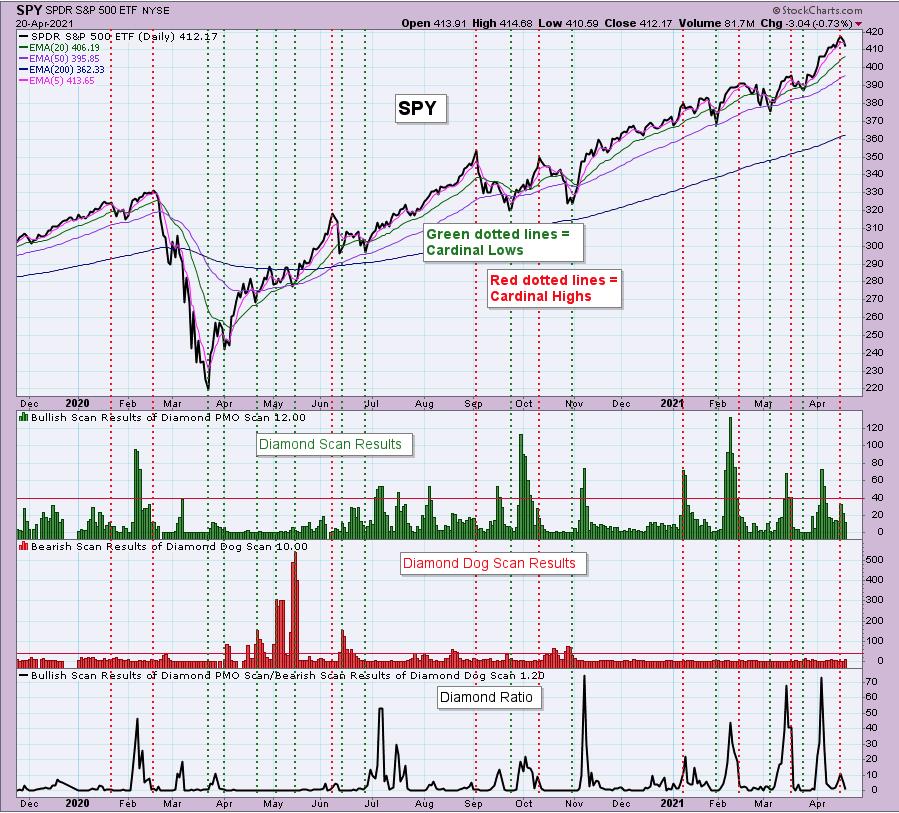
The Diamond Index chart looks at the number of scan results from my bullish Diamond PMO Scan and the number of scan results from the inverse Diamond Dog Scan. The Diamond Ratio divides the bullish results by the bearish results.
I only have data going back to October 2019 so I won't make any sweeping conclusions about the Diamond Index chart. I have marked cardinal tops with red dotted vertical lines and cardinal price bottoms with green dotted vertical lines. I believe that when the Diamond Dog results spike, it usually comes at a price bottom, or marks a strong continuation of the rising trend.
Unfortunately, the Diamond PMO Scan result numbers aren't providing much insight. The Diamond Ratio has promise, but again I don't see a clear correlation to the market tops/bottoms right now. I need to study and manipulate the data some more. Keep you posted!
Technical Analysis is a windsock, not a crystal ball.
Happy Charting!
- Erin
erin@decisionpoint.com
Watch the latest episode of DecisionPoint with Carl & Erin Swenlin on Mondays 7:00p EST or on the DecisionPoint playlist on the StockCharts TV YouTube channel here!
NOTE: The stocks reported herein are from mechanical trading model scans that are based upon moving average relationships, momentum and volume. DecisionPoint analysis is then applied to get five selections from the scans. The selections given should prompt readers to do a chart review using their own analysis process. This letter is not a call for a specific action to buy, sell or short any of the stocks provided. There are NO sure things or guaranteed returns on the daily selection of "diamonds in the rough."
Helpful DecisionPoint Links:
DecisionPoint Shared ChartList and DecisionPoint Chart Gallery
Price Momentum Oscillator (PMO)
Swenlin Trading Oscillators (STO-B and STO-V)
For more links, go to DecisionPoint.com!
