
Welcome to Reader Request Day! I opted to cover five stocks today, three were reader requests and I added two of my own. Energy (XLE) is heating up and we now have a plethora of stocks to consider. The news has been out that gas prices are on the rise. This could also offer opportunity for growth in some of these fossil fuel related stocks.
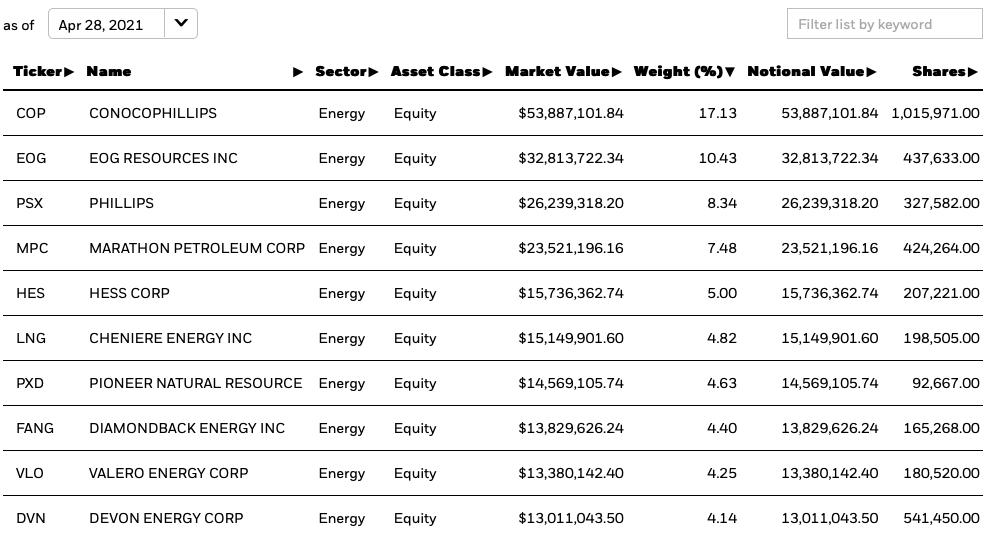
Banks continue to outperform. Yesterday's "diamond in the rough", ABCB performed quite nicely today. I have included a few in the "Stocks to Consider" list. Many are reader requests, but the majority are mine. I opted to include two Energy industry group ETFs for two picks today. One reason is that earnings are being reported and this will not overexpose us to earnings volatility. Check the top ten holdings. If you like the group and would like more exposure, you can see which stocks are most prominent in the ETF.
Remember to email me your requests before the close on Thursday and maybe yours will be in the report!
IMPORTANT: Be sure to sign up for the DP Diamond Mine for tomorrow! Here is a quick link.
Today's "Diamonds in the Rough" are: AROC, IEO, VEDL, XES and XOM.
Stocks/ETFs to Consider (no order): COP, DK, EGO, EUFN, HES, SU, SAVA, TILE, USB, FBP and CFR
 Diamond Mine REGISTRATION Information:
When: Apr 30, 2021 09:00 AM Pacific Time (US and Canada)
Topic: DecisionPoint Diamond Mine LIVE Trading Room
Register in advance for this webinar.
After registering, you will receive a confirmation email containing information about joining the webinar, including the password. SAVE IT! Zoom doesn't always send out the reminders.
=======================================================================
Diamond Mine RECORDING Link from 4/9/2021:
Topic: DecisionPoint Diamond Mine (04/23/2021) LIVE Trading Room
Start Time : Apr 23, 2021 08:58 AM
Here is the Meeting Recording.
Access Passcode: April/23
***Click here to register for this recurring free DecisionPoint Trading Room on Mondays at Noon ET!***
+++++++++++++++++++++++++++++++++++++++++++++++++++++++++++++++++++++++++++++++
Free DP Trading Room RECORDING LINK:
Topic: DecisionPoint Trading Room
Start Time : Apr 26, 2021 08:51 AM
Here is the Meeting Recording.
Access Passcode: April/26
For best results, copy and paste the access code to avoid typos.
Welcome to DecisionPoint Daily Diamonds, wherein I highlight five "diamonds in the rough." These are selected from the results of my DecisionPoint scans, which search for stocks that could benefit from the trend and condition of the market. Remember, these are not recommendations to buy or sell, but are the most interesting of the stocks that surfaced in my scans. My objective is to save you the work of the initial, tedious culling process, but you need to apply your own analysis to see if these stocks pique your interest as well. There are no guaranteed winners here!
Archrock, Inc (AROC)
EARNINGS: 4/29/2021 (AMC) **REPORTS TODAY**
Archrock, Inc. engages in the provision of operations, maintenance, service and equipment for oil and natural gas production, processing and transportation applications. It operates through the following segments: Contract Operations and Aftermarket Services. The Contract Operations segment consists of equity investment in the partnership, in addition to the owned fleet of natural gas compression equipment that the company use to provide operations services. The Aftermarket Services segment sell parts and components, provides operations, maintenance, overhaul and reconfiguration services to customers. The company was founded in 1954 and is headquartered in Houston, TX.
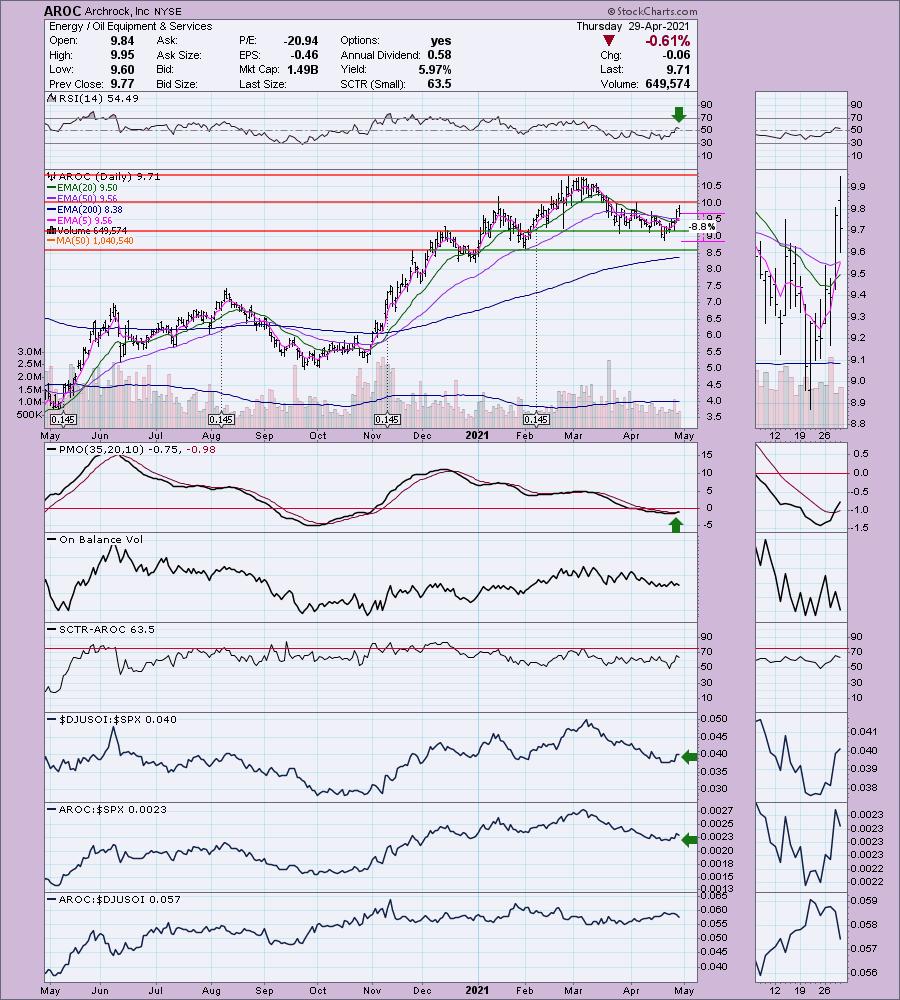
AROC is unchanged in after hours trading, which suggests to me that earnings aren't going to be an issue for AROC's price. This is a reader request. I like the breakout from the declining trend and today's pullback does make an interesting entry. The RSI just turned positive and the PMO had a crossover BUY signal trigger. The PMO isn't in positive territory above zero yet, but I like this oversold BUY signal. Performance is okay against the SPX, but the chart is saying that there may be better choices within this group given performance against the group is now turning down. The stop is set at the April intraday low.
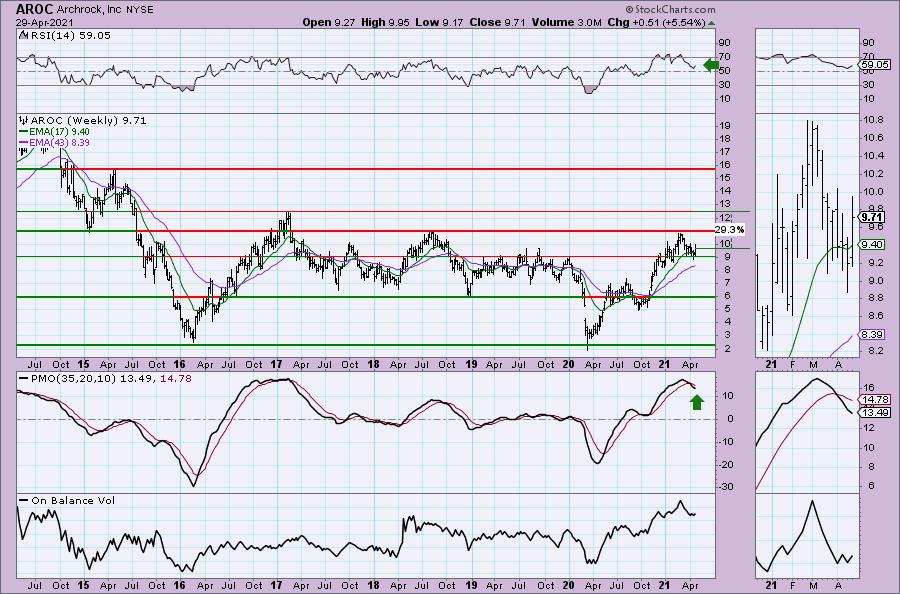
The weekly PMO is trying to decelerate, but it's not pretty right now. On the other hand, we have a positive RSI and nice upside potential should it reach the 2017 high.
iShares U.S. Oil & Gas Exploration & Production ETF (IEO)
EARNINGS: N/A
IEO tracks a market cap weighted index of companies in the U.S. oil and gas exploration and production space according to Dow Jones.
Top Ten Holdings:
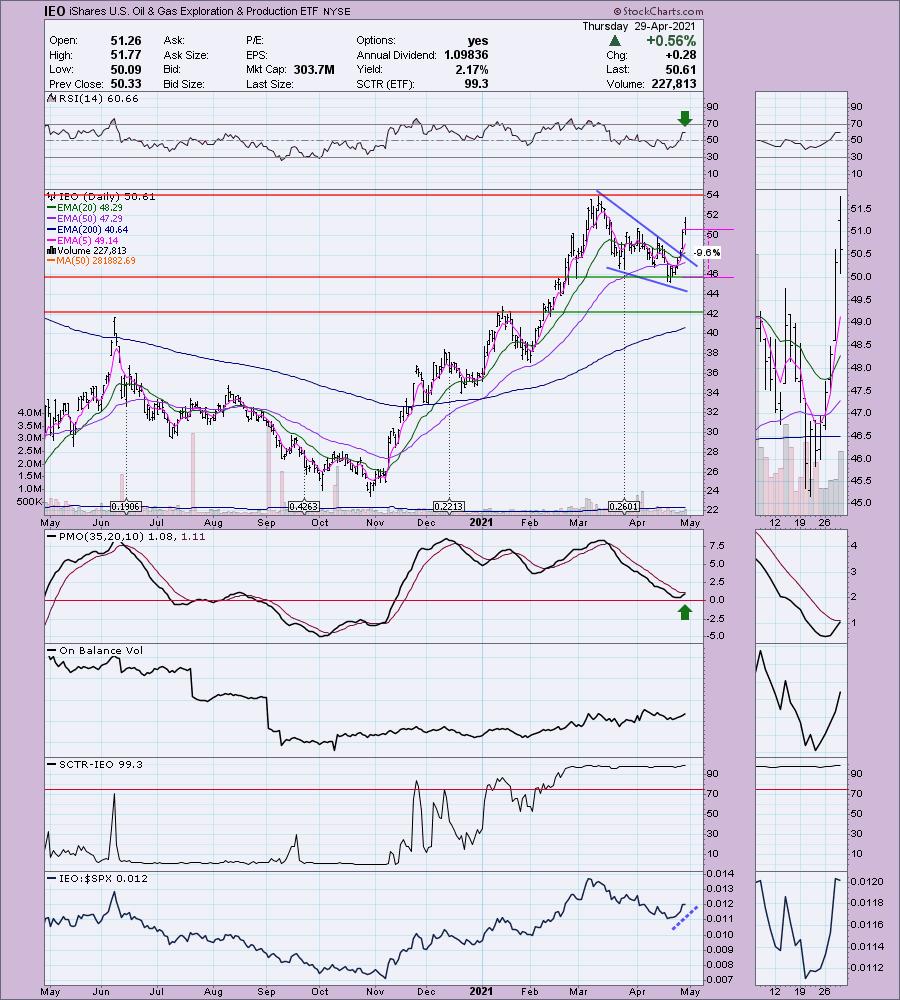
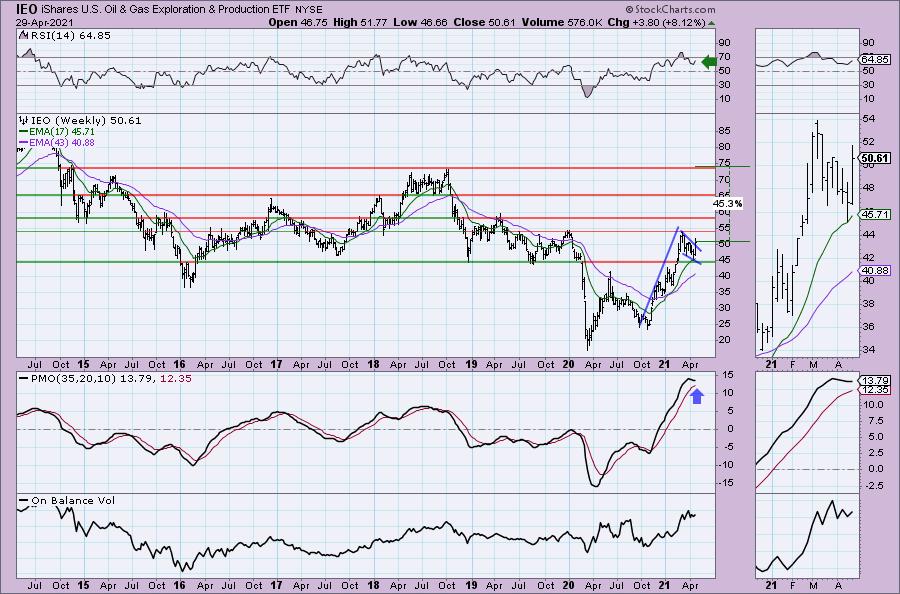
IEO is down -0.55% in after hours trading. I covered IEO back on February 10th 2021. The stop was never hit, so the position is up +17.2% since. This one is in a sharp rally, but the PMO, which hasn't given us a BUY signal yet, suggests we will see a continuation. The RSI is positive and I also like that the PMO turned up right above the zero line. This ETF has been outperforming the SPY since mid-April. Price broke out from a bullish falling wedge. I set the stop at 9.6%, but you could move it up to the first April bottom or down to the second April bottom. I split the difference.
This week's rally has executed a bullish flag formation. The upside target lies at $85, but I think getting to the 2018 high is enough for me. The weekly PMO is bottoming above the signal line and the RSI is positive.
Vedanta Ltd. (VEDL)
EARNINGS: 6/3/2021
Vedanta Ltd. is a natural resource company, which engages in the exploration, extraction, and processing of minerals, oil, and gas properties. It operates through the following segments: Copper, Aluminum, Iron Ore, Power, and Oil and Gas. The Copper segment focuses in custom smelting and also include a copper smelter, a refinery, a phosphoric acid plant, a sulphuric acid plant, a copper rod plant, and three captive power plants. The Aluminum segment comprises refinery and a captive power plant at Lanjigarh and a smelter, a thermal coal based captive power facility at Jharsuguda both situated in the State of Odisha in India. The Iron Ore segment explores, mines, and processes iron ore, pig iron, and metallurgical coke. The Power segment consists 600 MW thermal coal-based commercial power facility at Jharsuguda in the State of Odisha in Eastern India. The Oil and Gas segment involves in the exploration and development and production of oil and gas. The company was founded by Anil Kumar Agarwal on June 25, 1965 and is headquartered in Panaji, India.
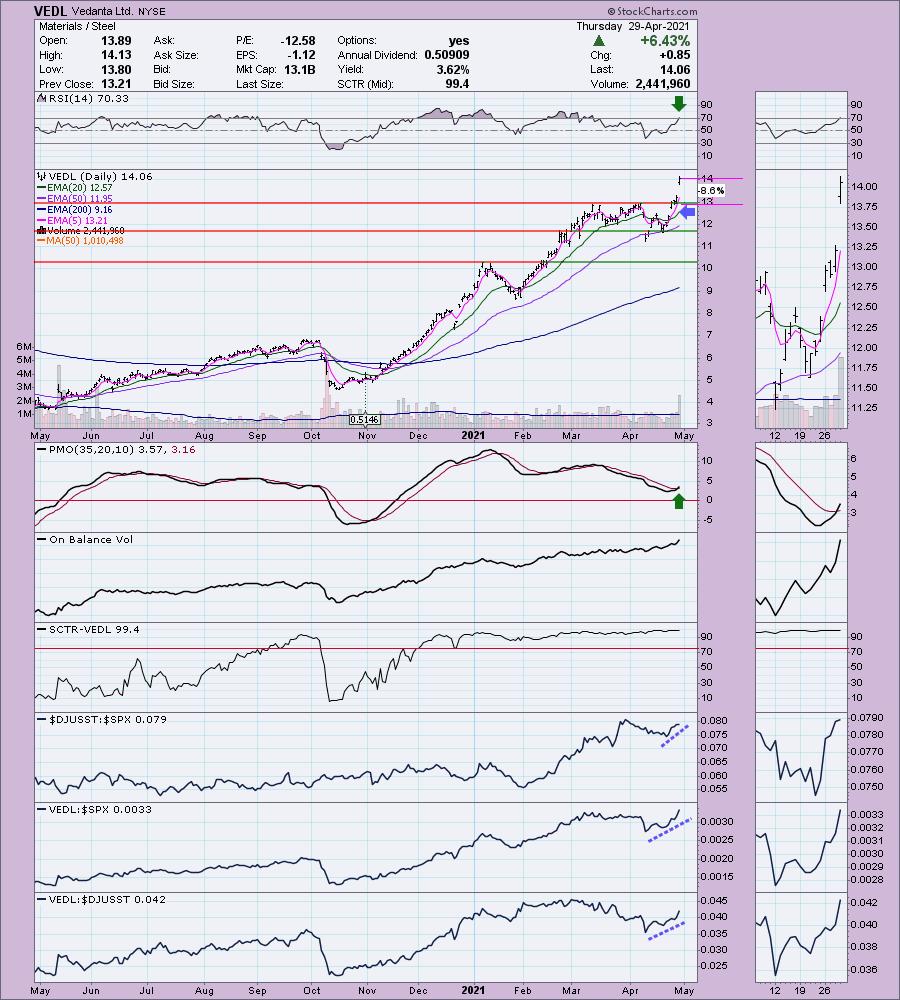
VEDL is unchanged in after hours trading. Two readers sent this one in as a request, one sent it in before today's open! Steel is taking off. That is clear when you see the group's performance against the SPX. This stock is outperforming in every way. First we had a breakaway gap and then today we had a follow-on runaway gap. This one isn't done yet. The tricky part is when to enter. I have set a stop with the close as usual, but consider watching for a pullback or a digestive move sideways. Overall, this one looks good with a new PMO BUY signal. The RSI got overbought today, but looking at history, it can stay that way for some time. It also appears based on history that when this one gets going it rises for some time. If you get in at this price point, you'll want your stop just below the March tops.
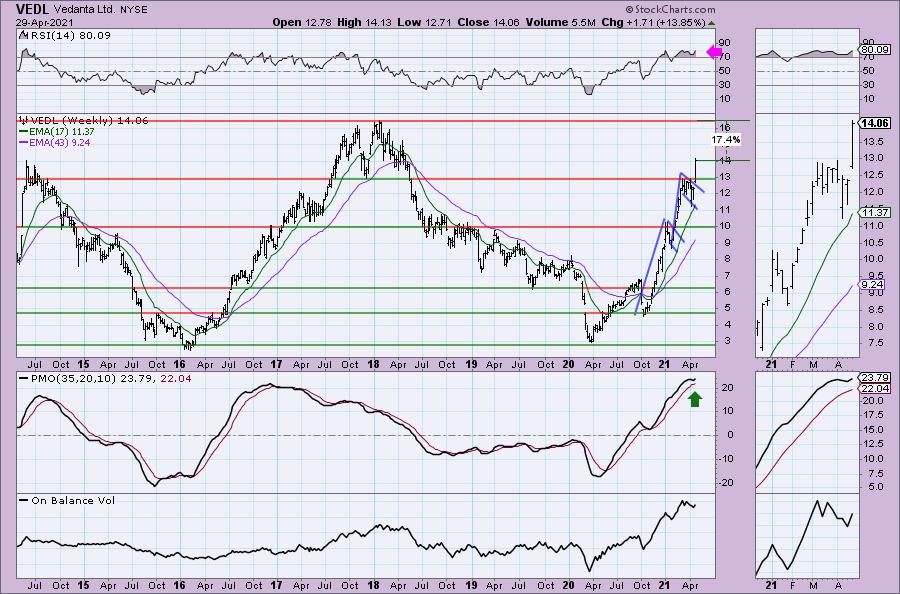
The weekly chart shows a very overbought RSI, but the PMO has now bottomed above its signal line. Notice the two flag formations. We are executing the current one with the strong breakout rally. Upside target would take us above the 2018 top.
SPDR S&P Oil & Gas Equipment & Services ETF (XES)
EARNINGS: N/A
XES tracks an equal-weighted index of companies in the oil & gas equipment and services sub-industry of the S&P Total Market Index.
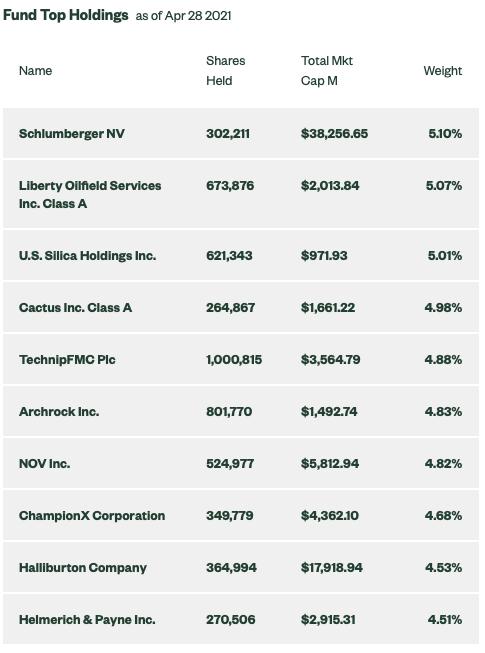
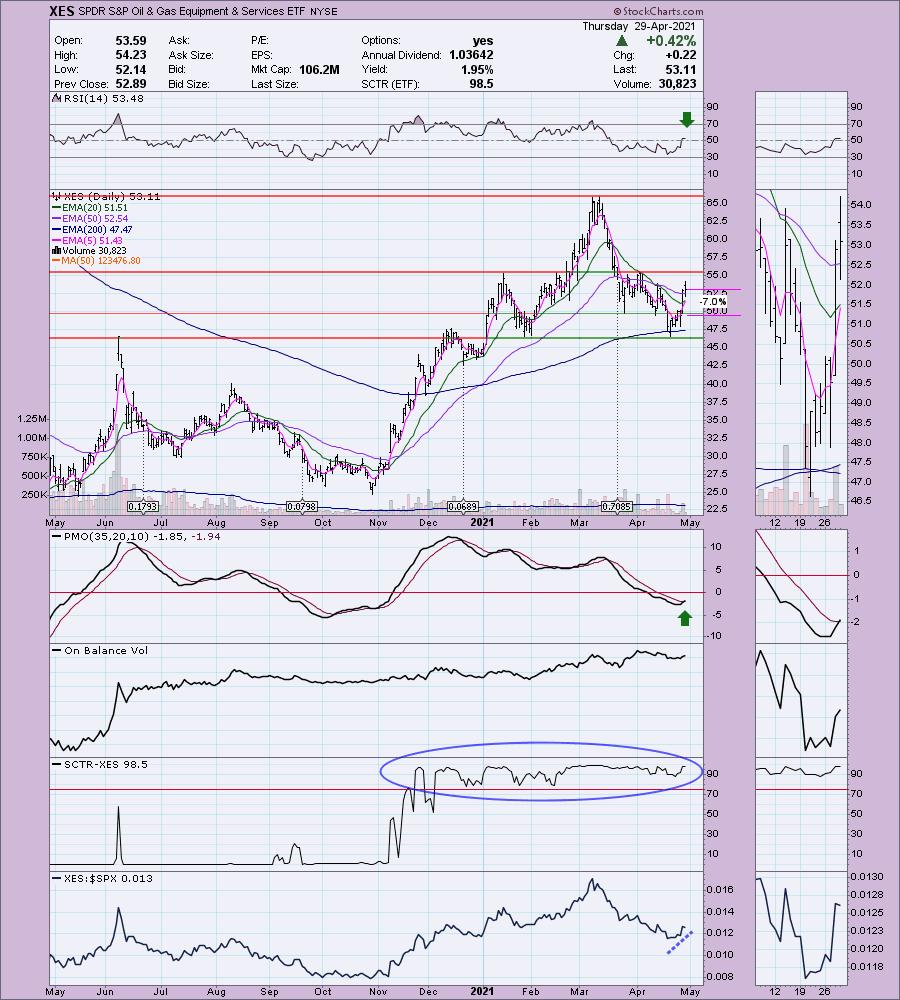
XES is up +0.73% in after hours trading. You'll note in the top ten holdings that AROC is one of them. I love the breakouts on XES above both the 20/50-EMAs. The RSI just moved above net neutral (50) and the PMO triggered a crossover BUY signal today. We nearly saw a 5/20-EMA positive crossover--that would've triggered a ST Trend Model BUY signal. This ETF is at the top of all ETFs as it has a SCTR of 98.5. Performance is picking up against the SPX. The stop is modest at 7% to line up with the March low.
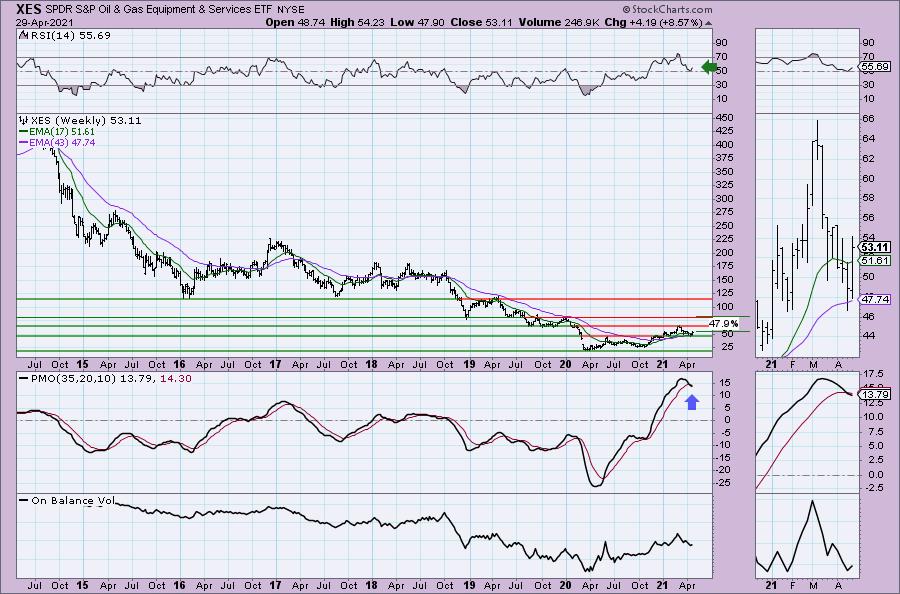
It's crazy to think back in 2014 this ETF was running in the $400 range, I'm not looking for that. I am setting the target at the 2018 low. The weekly PMO has triggered a new SELL signal which isn't good, but the rest of the chart looks pretty good.
Exxon Mobil Corp. (XOM)
EARNINGS: 4/30/2021 (BMO) ** REPORTS TOMORROW **
Exxon Mobil Corporation. The Group's principal activities are exploration, production, transportation and sale of crude oil and natural gas. The Group operates through three segments: Upstream, Downstream and Chemicals. The Upstream operates to explore for and produce crude oil and natural gas. The Downstream segment manufactures and markets petroleum products. The Chemicals segment manufactures and markets petrochemicals. The Group manufactures petroleum products, which includes olefins, aromatics, polyethylene and polypropylene plastics and other specialty products. It is also a major worldwide manufacturer and marketer of petrochemicals and participates in electric power generation. The Group operates and markets in the United States, Canada, Europe, Africa, Asia Pacific and Middle East, Russia and Caspian and South America.
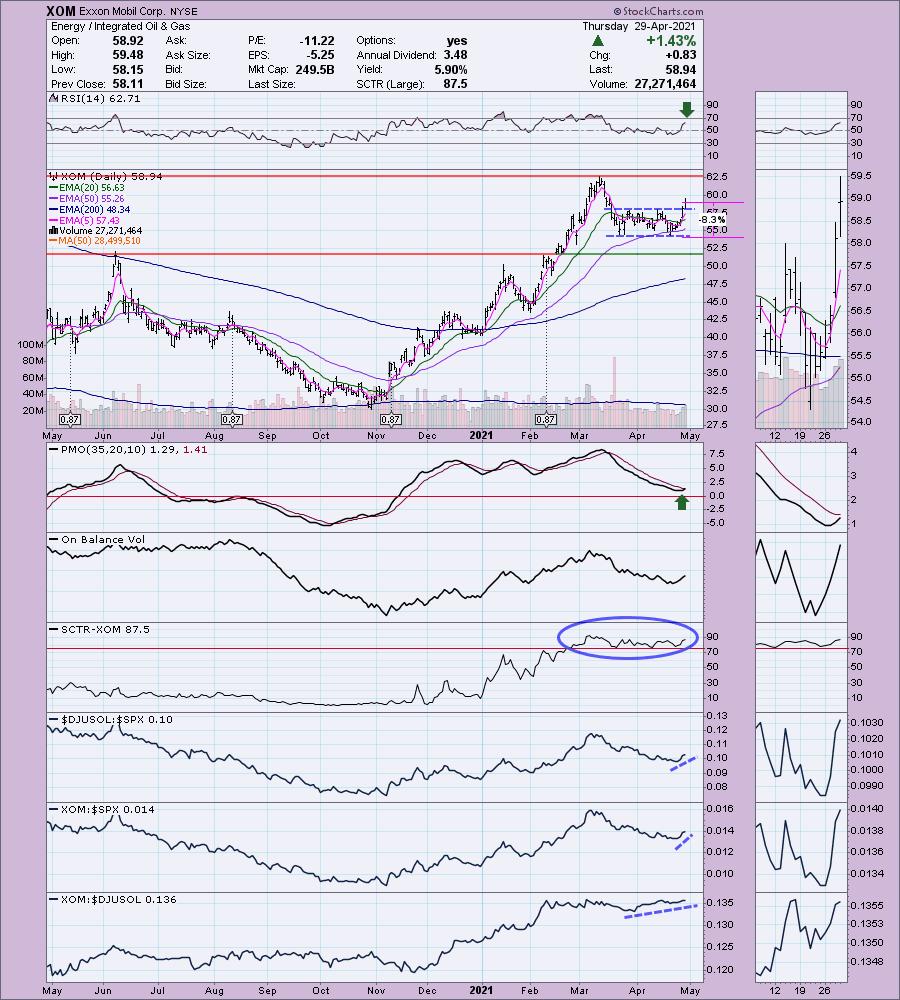
XOM is up +0.53% in after hours trading in anticipation of the earnings announcement tomorrow morning. We have the ability to reevaluate this reader request after the open tomorrow. Probably not a great idea to buy into earnings. In any case, the chart looks good with a positive RSI and PMO nearing an oversold BUY signal. This stock is in the upper quartile of all large cap stocks based on the SCTR of 87.5. My favorite part of this chart is that it is a clear outperformer within its industry group. The stop is set below the prior trading range.
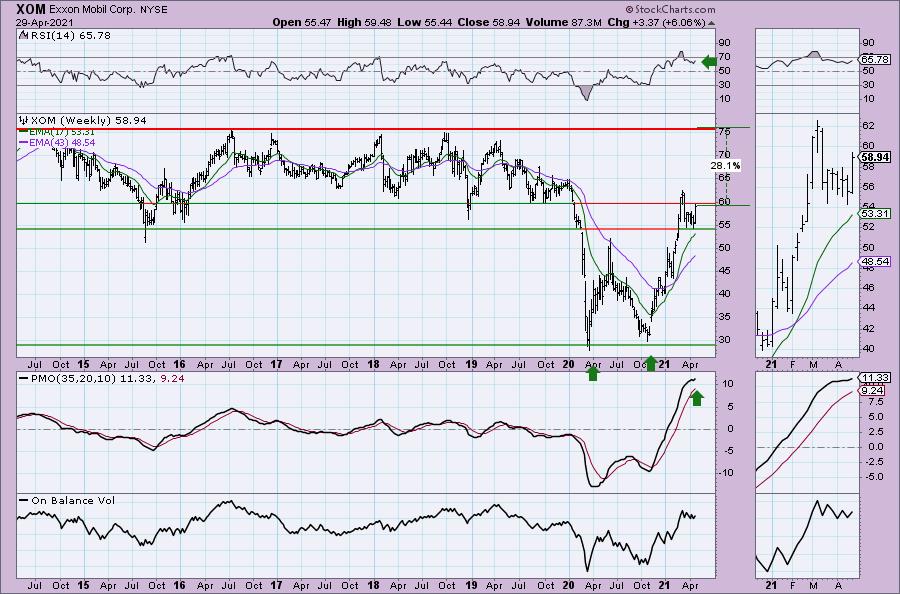
I annotated a large double-bottom pattern. It resolved to the upside as expected. The weekly RSI and PMO are both positive and rising. The upside target of the double-bottom pattern would take it to overhead resistance at $75.
Don't forget, on Thursdays I look at reader-requested symbols, so shoot me an email at erin@decisionpoint.com. I read every email I receive and try to answer them all!
Current Market Outlook:
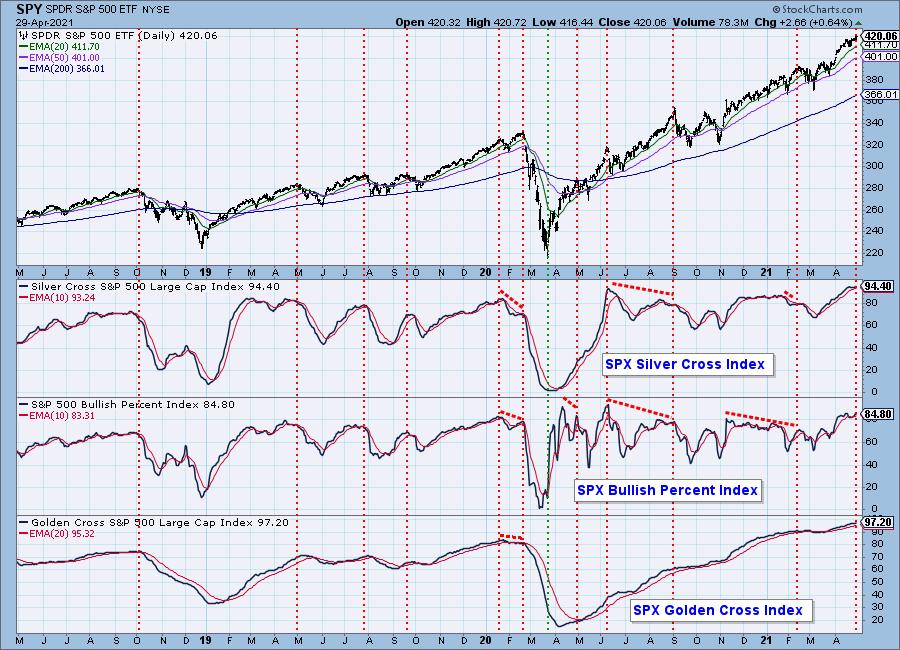
Market Environment: It is important to consider the odds for success by assessing the market tides. The following chart uses different methodologies for objectively showing the depth and trend of participation for intermediate- and long-term time frames.
- The Silver Cross Index (SCI) shows the percentage of SPX stocks on IT Trend Model BUY signals (20-EMA > 50-EMA)
- The Golden Cross Index (GCI) shows the percentage of SPX stocks on LT Trend Model BUY signals (50-EMA > 200-EMA)
- The Bullish Percent Index (BPI) shows the percentage of SPX stocks on Point & Figure BUY signals.
Don't forget that as a "Diamonds" member, you have access to our GCI/SCI curated ChartList on DecisionPoint.com. You'll find it under "Members Only" links on the left side on the Blogs and Links Page.
Here is the current chart:
Diamond Index:
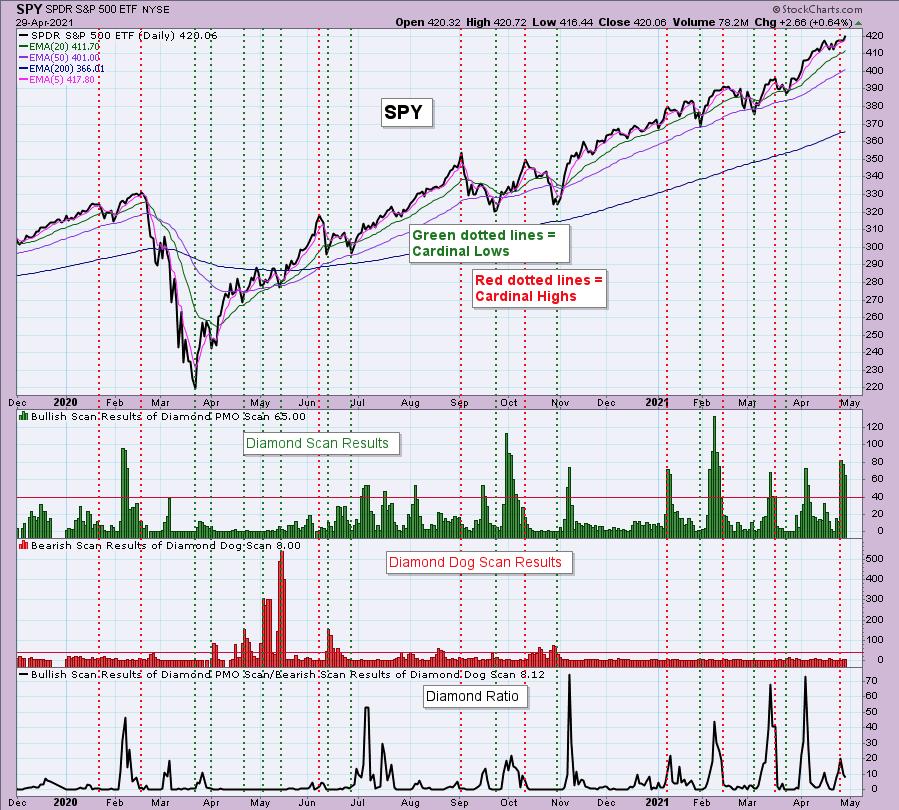
The Diamond Index chart looks at the number of scan results from my bullish Diamond PMO Scan and the number of scan results from the inverse Diamond Dog Scan. The Diamond Ratio divides the bullish results by the bearish results.
I only have data going back to October 2019 so I won't make any sweeping conclusions about the Diamond Index chart. I have marked cardinal tops with red dotted vertical lines and cardinal price bottoms with green dotted vertical lines. I believe that when the Diamond Dog results spike, it usually comes at a price bottom, or marks a strong continuation of the rising trend.
Unfortunately, the Diamond PMO Scan result numbers aren't providing much insight. The Diamond Ratio has promise, but again I don't see a clear correlation to the market tops/bottoms right now. I need to study and manipulate the data some more. Keep you posted!
Full Disclosure: I'm about 75% invested and 25% is in 'cash', meaning in money markets and readily available to trade with.
Technical Analysis is a windsock, not a crystal ball.
Happy Charting!
- Erin
erin@decisionpoint.com
Watch the latest episode of DecisionPoint with Carl & Erin Swenlin on Mondays 7:00p EST or on the DecisionPoint playlist on the StockCharts TV YouTube channel here!
NOTE: The stocks reported herein are from mechanical trading model scans that are based upon moving average relationships, momentum and volume. DecisionPoint analysis is then applied to get five selections from the scans. The selections given should prompt readers to do a chart review using their own analysis process. This letter is not a call for a specific action to buy, sell or short any of the stocks provided. There are NO sure things or guaranteed returns on the daily selection of "diamonds in the rough."
Helpful DecisionPoint Links:
DecisionPoint Shared ChartList and DecisionPoint Chart Gallery
Price Momentum Oscillator (PMO)
Swenlin Trading Oscillators (STO-B and STO-V)
For more links, go to DecisionPoint.com!
